

Key Insights
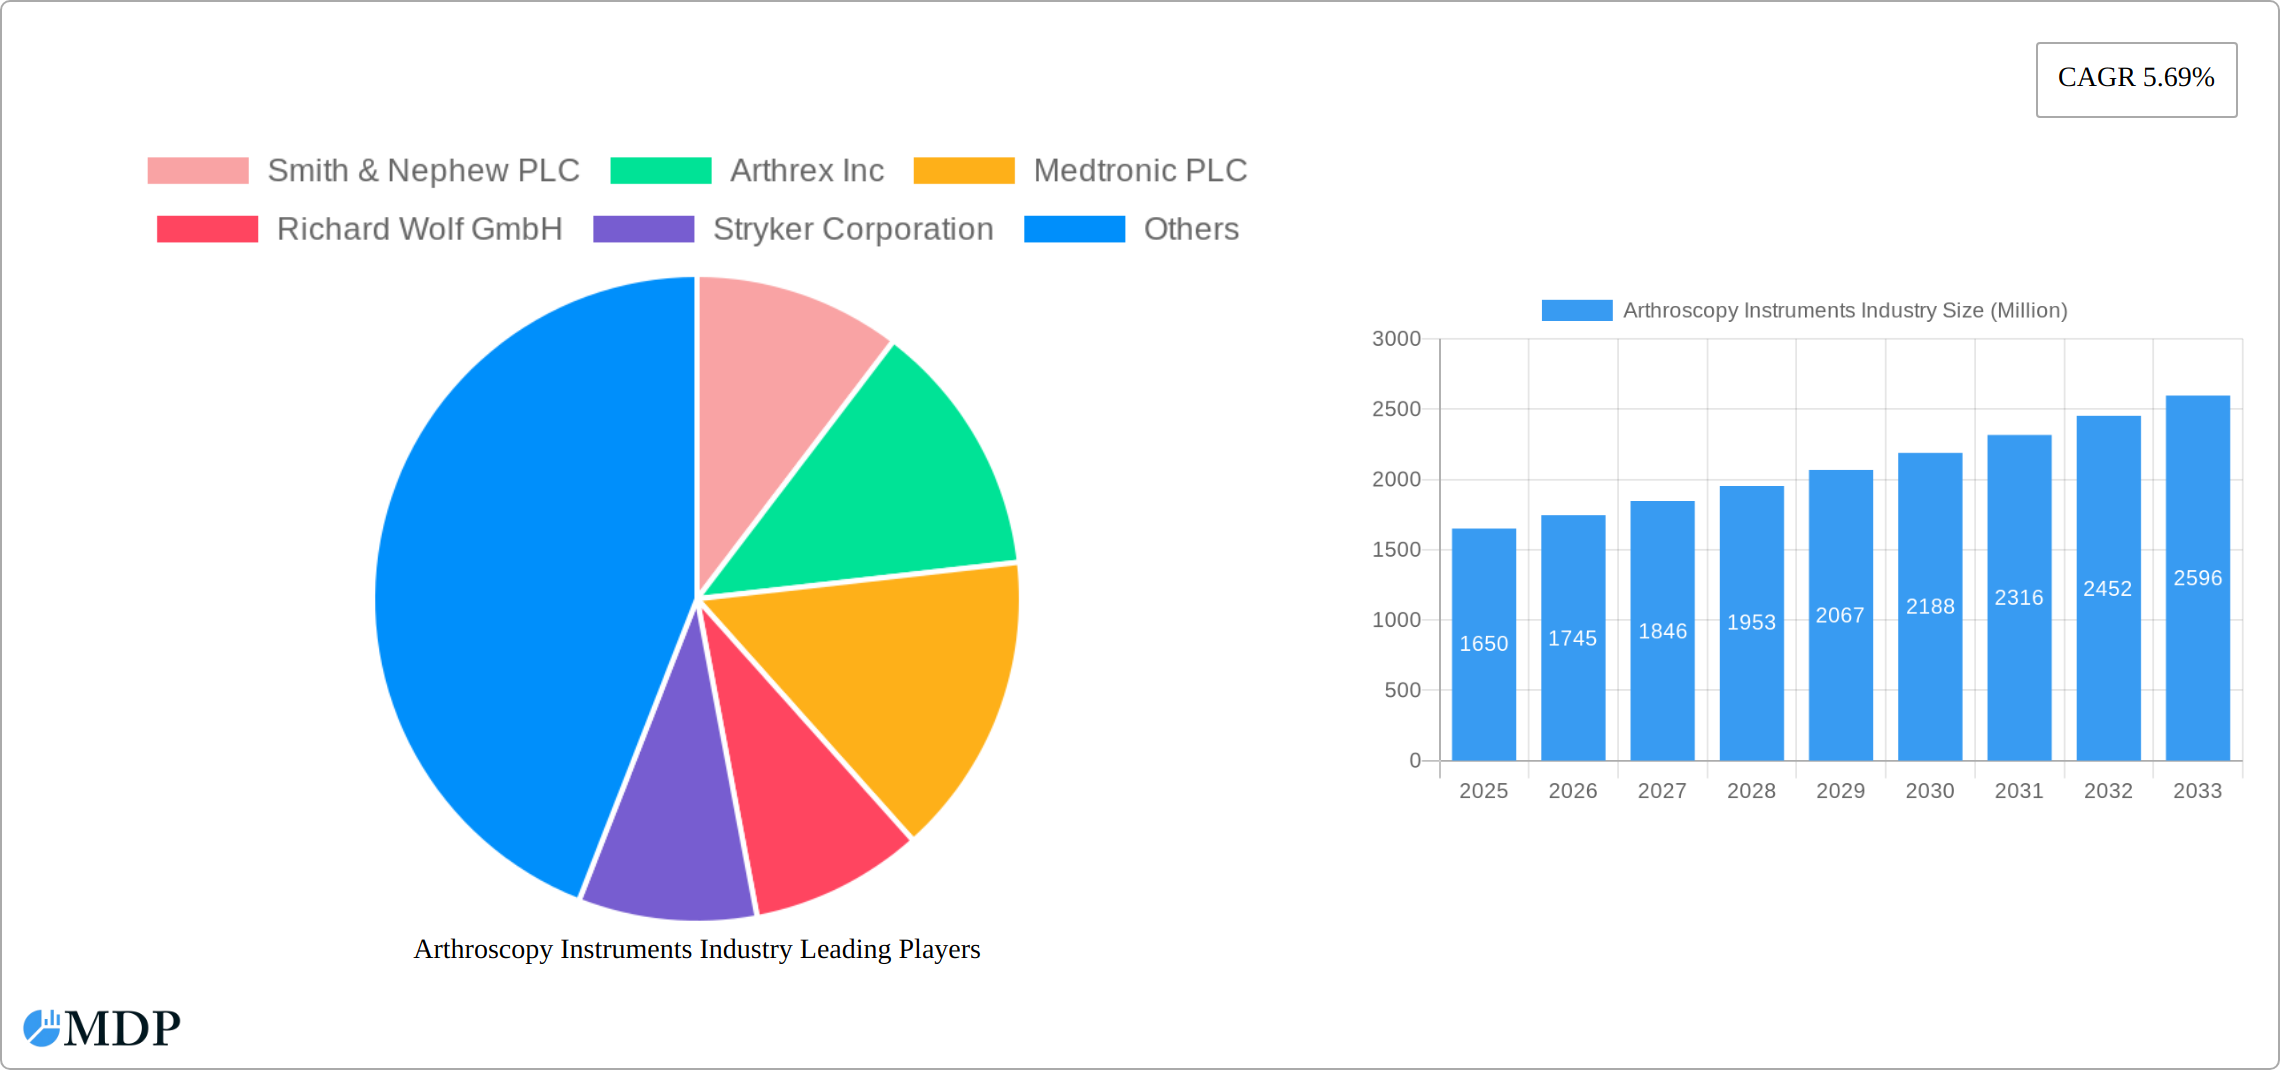
The global arthroscopy instruments market, valued at $1.65 billion in 2025, is projected to experience robust growth, driven by several key factors. An aging global population experiencing increased incidence of osteoarthritis and other musculoskeletal disorders fuels demand for minimally invasive arthroscopic procedures. Technological advancements in arthroscopic instrumentation, such as improved visualization systems, smaller incisions, and enhanced surgical precision, contribute significantly to market expansion. Furthermore, the rising adoption of arthroscopy for various applications, including knee, hip, shoulder, and spine surgeries, supports market growth. The increasing preference for outpatient surgeries, driven by cost-effectiveness and reduced recovery times, further accelerates market expansion. While the market faces potential restraints from high procedure costs and the risk of complications associated with arthroscopic surgeries, these are expected to be largely offset by the aforementioned growth drivers. Competition among established players like Smith & Nephew, Arthrex, and Medtronic fosters innovation and ensures a wide range of high-quality products are available. Geographical expansion, particularly in emerging markets with increasing healthcare infrastructure development, presents further opportunities for market growth. This positive market trajectory indicates substantial investment and expansion within the industry in the coming years.
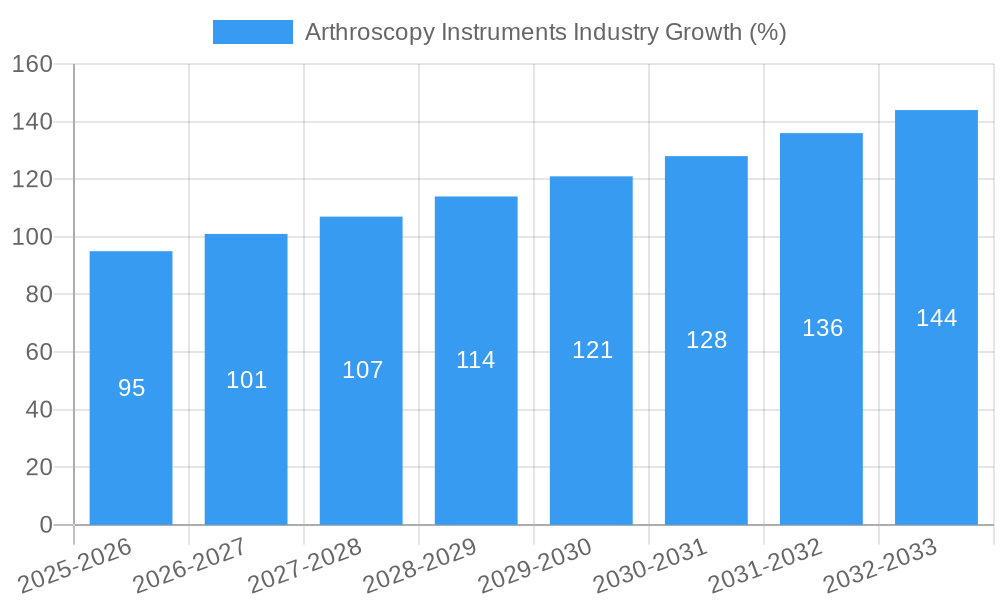
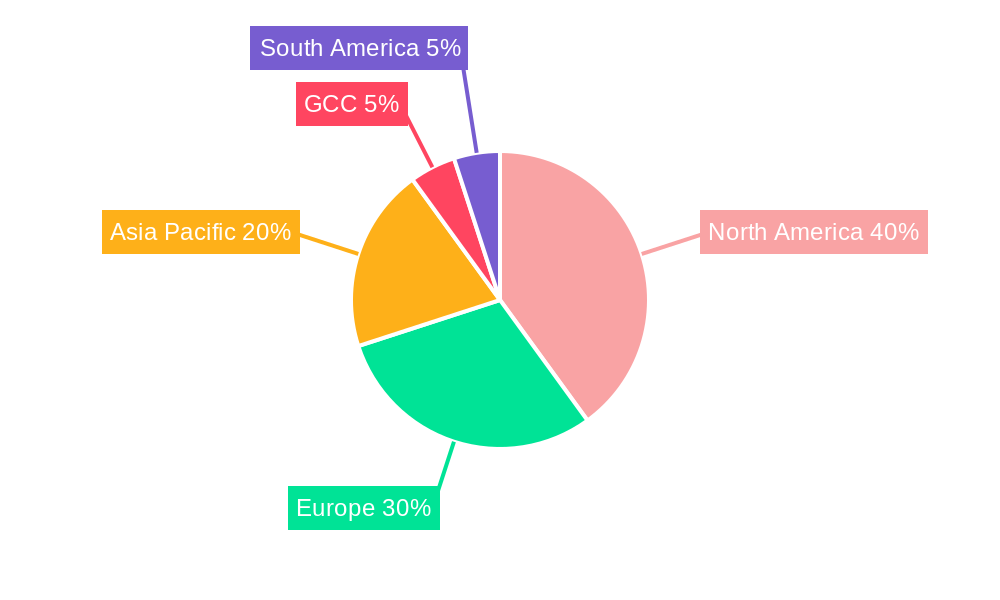
The forecast period of 2025-2033 anticipates a continued upward trend. The Compound Annual Growth Rate (CAGR) of 5.69% suggests a steady increase in market value. Segment-wise, the arthroscope and arthroscopic implant segments are projected to dominate due to their high usage in most arthroscopic procedures. Regional analysis indicates that North America and Europe will likely retain significant market share due to advanced healthcare infrastructure and high adoption rates of minimally invasive surgeries. However, the Asia-Pacific region is expected to exhibit the highest growth rate due to increasing healthcare expenditure and rising prevalence of musculoskeletal diseases. This necessitates a focus on strategic partnerships and product localization to tap into the growth potential of this region. Overall, the arthroscopy instruments market presents a promising investment opportunity with considerable growth prospects.
Arthroscopy Instruments Industry: A Comprehensive Market Report (2019-2033)
This comprehensive report provides a detailed analysis of the Arthroscopy Instruments market, offering invaluable insights for stakeholders across the industry value chain. With a study period spanning 2019-2033, a base year of 2025, and a forecast period of 2025-2033, this report leverages rigorous data analysis and expert insights to deliver a complete overview of this dynamic sector. The market is valued at xx Million in 2025 and is projected to reach xx Million by 2033, exhibiting a CAGR of xx%.
Arthroscopy Instruments Industry Market Dynamics & Concentration
The Arthroscopy Instruments market is characterized by a moderately concentrated landscape, with key players like Smith & Nephew PLC, Arthrex Inc, Medtronic PLC, Richard Wolf GmbH, Stryker Corporation, Karl Storz GmbH & Co KG, Conmed Corporation, and Johnson & Johnson holding significant market share. The market share distribution in 2025 is estimated as follows: Arthrex Inc. (xx%), Smith & Nephew PLC (xx%), Medtronic PLC (xx%), and others (xx%). Innovation is a key driver, with companies continually investing in developing advanced arthroscopic instruments and minimally invasive surgical techniques. Stringent regulatory frameworks, particularly concerning product safety and efficacy, significantly influence market dynamics. The market faces competition from substitute technologies such as open surgery, but the growing preference for minimally invasive procedures continues to propel the market’s growth. End-user trends, including an aging population and rising incidence of osteoarthritis and sports injuries, are major catalysts. The market has witnessed a moderate level of M&A activity in recent years, with an estimated xx M&A deals concluded between 2019 and 2024, primarily focused on expanding product portfolios and geographic reach.
- Market Concentration: Moderately concentrated, with top players holding significant market share.
- Innovation Drivers: Development of advanced instruments and minimally invasive techniques.
- Regulatory Landscape: Stringent regulations concerning safety and efficacy.
- Product Substitutes: Open surgery, but minimally invasive procedures remain preferred.
- End-User Trends: Aging population, rising incidence of osteoarthritis and sports injuries.
- M&A Activity: Moderate level of M&A activity, focused on portfolio and geographic expansion.
Arthroscopy Instruments Industry Industry Trends & Analysis
The Arthroscopy Instruments market is experiencing robust growth, driven by several key factors. Technological advancements, such as the introduction of robotic-assisted arthroscopy and improved imaging systems, are enhancing surgical precision and outcomes. Consumer preferences are shifting towards minimally invasive procedures due to shorter recovery times and reduced scarring. Competitive dynamics are intense, with companies focusing on product differentiation, technological innovation, and strategic partnerships to gain market share. The market growth is further fueled by increasing healthcare expenditure, rising prevalence of musculoskeletal disorders, and favorable reimbursement policies in developed and developing economies. The market is expected to witness significant expansion across various applications, with knee arthroscopy remaining the largest segment. The market penetration of arthroscopic procedures is continuously increasing, particularly in emerging markets. This growth is anticipated to continue throughout the forecast period, with a significant increase in market value and penetration.
Leading Markets & Segments in Arthroscopy Instruments Industry
North America currently dominates the Arthroscopy Instruments market, driven by high healthcare expenditure, advanced medical infrastructure, and a large patient pool. Within the product segments, Arthroscopes and Arthroscopic Implants represent the largest market share, followed by Fluid Management Systems and Visualization Systems. Knee Arthroscopy is the dominant application segment, representing a significant portion of the overall market.
- Key Drivers in North America: High healthcare expenditure, advanced infrastructure, large patient pool.
- Dominant Product Segment: Arthroscopes and Arthroscopic Implants.
- Dominant Application Segment: Knee Arthroscopy.
- European Market Dynamics: Increasing adoption of minimally invasive techniques.
- Asia-Pacific Market Potential: Growing healthcare infrastructure and rising disposable incomes.
Arthroscopy Instruments Industry Product Developments
Recent product innovations focus on improving surgical precision, minimizing invasiveness, and enhancing patient recovery. This includes the development of smaller, more flexible arthroscopes, improved visualization systems with enhanced imaging capabilities, and innovative implant designs with improved biocompatibility. These advancements are driving increased adoption of arthroscopic procedures and shaping the competitive landscape.
Key Drivers of Arthroscopy Instruments Industry Growth
Several factors contribute to the robust growth of this industry. Technological advancements, such as the development of minimally invasive instruments and improved imaging systems, are crucial. The increasing prevalence of musculoskeletal disorders, coupled with a growing aging population, fuels demand for arthroscopic procedures. Favorable reimbursement policies and increasing healthcare expenditure in many regions also contribute.
Challenges in the Arthroscopy Instruments Industry Market
The market faces challenges such as stringent regulatory requirements, increasing competition, and the potential for supply chain disruptions. These factors can impact profitability and market access. The cost of advanced instruments and technologies can also be a barrier to adoption in some regions.
Emerging Opportunities in Arthroscopy Instruments Industry
Several opportunities exist for long-term growth. Technological breakthroughs, such as the development of robotic-assisted arthroscopy and AI-powered diagnostic tools, promise to further enhance precision and efficiency. Strategic partnerships and collaborations between medical device companies and healthcare providers can expand market access and adoption. Expansion into emerging markets with growing healthcare infrastructure presents significant opportunities.
Leading Players in the Arthroscopy Instruments Industry Sector
- Smith & Nephew PLC
- Arthrex Inc
- Medtronic PLC
- Richard Wolf GmbH
- Stryker Corporation
- Karl Storz GmbH & Co KG
- Conmed Corporation
- Johnson & Johnson
Key Milestones in Arthroscopy Instruments Industry Industry
- December 2020: Arthrex Inc. launched SwiveLock ACL Repair Kit, the first FDA-cleared primary repair kit for ACL tears. This significantly enhanced treatment options for ACL injuries.
- February 2022: Formus Labs secured USD 5 Million in funding and partnered with Zimmer Biomet for co-development and global distribution of its technology. This highlights the growing interest in innovative arthroscopy solutions.
Strategic Outlook for Arthroscopy Instruments Industry Market
The Arthroscopy Instruments market presents significant growth potential driven by technological advancements, increasing prevalence of musculoskeletal disorders, and a growing preference for minimally invasive procedures. Companies focusing on innovation, strategic partnerships, and market expansion will be best positioned to capitalize on these opportunities. The market is poised for continued expansion, with particular growth expected in emerging markets and applications beyond traditional knee arthroscopy.
Arthroscopy Instruments Industry Segmentation
-
1. Application
- 1.1. Knee Arthroscopy
- 1.2. Hip Arthroscopy
- 1.3. Spine Arthroscopy
- 1.4. Shoulder and Elbow Arthroscopy
- 1.5. Other Arthroscopy Applications
-
2. Product
- 2.1. Arthroscope
- 2.2. Arthroscopic Implant
- 2.3. Fluid Management System
- 2.4. Radiofrequency (RF) System
- 2.5. Visualization System
- 2.6. Other Products
Arthroscopy Instruments Industry Segmentation By Geography
-
1. North America
- 1.1. United States
- 1.2. Canada
- 1.3. Mexico
-
2. Europe
- 2.1. Germany
- 2.2. United Kingdom
- 2.3. France
- 2.4. Italy
- 2.5. Spain
- 2.6. Rest of Europe
-
3. Asia Pacific
- 3.1. China
- 3.2. Japan
- 3.3. India
- 3.4. Australia
- 3.5. South korea
- 3.6. Rest of Asia Pacific
- 4. Middle East
-
5. GCC
- 5.1. South Africa
- 5.2. Rest of Middle East
-
6. South America
- 6.1. Brazil
- 6.2. Argentina
- 6.3. Rest of South America
Arthroscopy Instruments Industry REPORT HIGHLIGHTS
| Aspects | Details |
|---|---|
| Study Period | 2019-2033 |
| Base Year | 2024 |
| Estimated Year | 2025 |
| Forecast Period | 2025-2033 |
| Historical Period | 2019-2024 |
| Growth Rate | CAGR of 5.69% from 2019-2033 |
| Segmentation |
|
Table of Contents
- 1. Introduction
- 1.1. Research Scope
- 1.2. Market Segmentation
- 1.3. Research Methodology
- 1.4. Definitions and Assumptions
- 2. Executive Summary
- 2.1. Introduction
- 3. Market Dynamics
- 3.1. Introduction
- 3.2. Market Drivers
- 3.2.1. Increasing Incidences of Sports Injuries; Rising Geriatric Population; Technological Advancements in Arthroscopic Implants
- 3.3. Market Restrains
- 3.3.1. Lack of Skilled Surgeons; Stringent Regulatory Requirements; High Cost of Arthroscopy Devices
- 3.4. Market Trends
- 3.4.1. Knee Arthroscopy Segment is Expected to Witness Growth Over the Forecast Period
- 4. Market Factor Analysis
- 4.1. Porters Five Forces
- 4.2. Supply/Value Chain
- 4.3. PESTEL analysis
- 4.4. Market Entropy
- 4.5. Patent/Trademark Analysis
- 5. Global Arthroscopy Instruments Industry Analysis, Insights and Forecast, 2019-2031
- 5.1. Market Analysis, Insights and Forecast - by Application
- 5.1.1. Knee Arthroscopy
- 5.1.2. Hip Arthroscopy
- 5.1.3. Spine Arthroscopy
- 5.1.4. Shoulder and Elbow Arthroscopy
- 5.1.5. Other Arthroscopy Applications
- 5.2. Market Analysis, Insights and Forecast - by Product
- 5.2.1. Arthroscope
- 5.2.2. Arthroscopic Implant
- 5.2.3. Fluid Management System
- 5.2.4. Radiofrequency (RF) System
- 5.2.5. Visualization System
- 5.2.6. Other Products
- 5.3. Market Analysis, Insights and Forecast - by Region
- 5.3.1. North America
- 5.3.2. Europe
- 5.3.3. Asia Pacific
- 5.3.4. Middle East
- 5.3.5. GCC
- 5.3.6. South America
- 5.1. Market Analysis, Insights and Forecast - by Application
- 6. North America Arthroscopy Instruments Industry Analysis, Insights and Forecast, 2019-2031
- 6.1. Market Analysis, Insights and Forecast - by Application
- 6.1.1. Knee Arthroscopy
- 6.1.2. Hip Arthroscopy
- 6.1.3. Spine Arthroscopy
- 6.1.4. Shoulder and Elbow Arthroscopy
- 6.1.5. Other Arthroscopy Applications
- 6.2. Market Analysis, Insights and Forecast - by Product
- 6.2.1. Arthroscope
- 6.2.2. Arthroscopic Implant
- 6.2.3. Fluid Management System
- 6.2.4. Radiofrequency (RF) System
- 6.2.5. Visualization System
- 6.2.6. Other Products
- 6.1. Market Analysis, Insights and Forecast - by Application
- 7. Europe Arthroscopy Instruments Industry Analysis, Insights and Forecast, 2019-2031
- 7.1. Market Analysis, Insights and Forecast - by Application
- 7.1.1. Knee Arthroscopy
- 7.1.2. Hip Arthroscopy
- 7.1.3. Spine Arthroscopy
- 7.1.4. Shoulder and Elbow Arthroscopy
- 7.1.5. Other Arthroscopy Applications
- 7.2. Market Analysis, Insights and Forecast - by Product
- 7.2.1. Arthroscope
- 7.2.2. Arthroscopic Implant
- 7.2.3. Fluid Management System
- 7.2.4. Radiofrequency (RF) System
- 7.2.5. Visualization System
- 7.2.6. Other Products
- 7.1. Market Analysis, Insights and Forecast - by Application
- 8. Asia Pacific Arthroscopy Instruments Industry Analysis, Insights and Forecast, 2019-2031
- 8.1. Market Analysis, Insights and Forecast - by Application
- 8.1.1. Knee Arthroscopy
- 8.1.2. Hip Arthroscopy
- 8.1.3. Spine Arthroscopy
- 8.1.4. Shoulder and Elbow Arthroscopy
- 8.1.5. Other Arthroscopy Applications
- 8.2. Market Analysis, Insights and Forecast - by Product
- 8.2.1. Arthroscope
- 8.2.2. Arthroscopic Implant
- 8.2.3. Fluid Management System
- 8.2.4. Radiofrequency (RF) System
- 8.2.5. Visualization System
- 8.2.6. Other Products
- 8.1. Market Analysis, Insights and Forecast - by Application
- 9. Middle East Arthroscopy Instruments Industry Analysis, Insights and Forecast, 2019-2031
- 9.1. Market Analysis, Insights and Forecast - by Application
- 9.1.1. Knee Arthroscopy
- 9.1.2. Hip Arthroscopy
- 9.1.3. Spine Arthroscopy
- 9.1.4. Shoulder and Elbow Arthroscopy
- 9.1.5. Other Arthroscopy Applications
- 9.2. Market Analysis, Insights and Forecast - by Product
- 9.2.1. Arthroscope
- 9.2.2. Arthroscopic Implant
- 9.2.3. Fluid Management System
- 9.2.4. Radiofrequency (RF) System
- 9.2.5. Visualization System
- 9.2.6. Other Products
- 9.1. Market Analysis, Insights and Forecast - by Application
- 10. GCC Arthroscopy Instruments Industry Analysis, Insights and Forecast, 2019-2031
- 10.1. Market Analysis, Insights and Forecast - by Application
- 10.1.1. Knee Arthroscopy
- 10.1.2. Hip Arthroscopy
- 10.1.3. Spine Arthroscopy
- 10.1.4. Shoulder and Elbow Arthroscopy
- 10.1.5. Other Arthroscopy Applications
- 10.2. Market Analysis, Insights and Forecast - by Product
- 10.2.1. Arthroscope
- 10.2.2. Arthroscopic Implant
- 10.2.3. Fluid Management System
- 10.2.4. Radiofrequency (RF) System
- 10.2.5. Visualization System
- 10.2.6. Other Products
- 10.1. Market Analysis, Insights and Forecast - by Application
- 11. South America Arthroscopy Instruments Industry Analysis, Insights and Forecast, 2019-2031
- 11.1. Market Analysis, Insights and Forecast - by Application
- 11.1.1. Knee Arthroscopy
- 11.1.2. Hip Arthroscopy
- 11.1.3. Spine Arthroscopy
- 11.1.4. Shoulder and Elbow Arthroscopy
- 11.1.5. Other Arthroscopy Applications
- 11.2. Market Analysis, Insights and Forecast - by Product
- 11.2.1. Arthroscope
- 11.2.2. Arthroscopic Implant
- 11.2.3. Fluid Management System
- 11.2.4. Radiofrequency (RF) System
- 11.2.5. Visualization System
- 11.2.6. Other Products
- 11.1. Market Analysis, Insights and Forecast - by Application
- 12. North America Arthroscopy Instruments Industry Analysis, Insights and Forecast, 2019-2031
- 12.1. Market Analysis, Insights and Forecast - By Country/Sub-region
- 12.1.1. undefined
- 13. Europe Arthroscopy Instruments Industry Analysis, Insights and Forecast, 2019-2031
- 13.1. Market Analysis, Insights and Forecast - By Country/Sub-region
- 13.1.1. undefined
- 14. Asia Pacific Arthroscopy Instruments Industry Analysis, Insights and Forecast, 2019-2031
- 14.1. Market Analysis, Insights and Forecast - By Country/Sub-region
- 14.1.1. undefined
- 15. GCC Arthroscopy Instruments Industry Analysis, Insights and Forecast, 2019-2031
- 15.1. Market Analysis, Insights and Forecast - By Country/Sub-region
- 15.1.1. undefined
- 16. South America Arthroscopy Instruments Industry Analysis, Insights and Forecast, 2019-2031
- 16.1. Market Analysis, Insights and Forecast - By Country/Sub-region
- 16.1.1. undefined
- 17. Competitive Analysis
- 17.1. Global Market Share Analysis 2024
- 17.2. Company Profiles
- 17.2.1 Smith & Nephew PLC
- 17.2.1.1. Overview
- 17.2.1.2. Products
- 17.2.1.3. SWOT Analysis
- 17.2.1.4. Recent Developments
- 17.2.1.5. Financials (Based on Availability)
- 17.2.2 Arthrex Inc
- 17.2.2.1. Overview
- 17.2.2.2. Products
- 17.2.2.3. SWOT Analysis
- 17.2.2.4. Recent Developments
- 17.2.2.5. Financials (Based on Availability)
- 17.2.3 Medtronic PLC
- 17.2.3.1. Overview
- 17.2.3.2. Products
- 17.2.3.3. SWOT Analysis
- 17.2.3.4. Recent Developments
- 17.2.3.5. Financials (Based on Availability)
- 17.2.4 Richard Wolf GmbH
- 17.2.4.1. Overview
- 17.2.4.2. Products
- 17.2.4.3. SWOT Analysis
- 17.2.4.4. Recent Developments
- 17.2.4.5. Financials (Based on Availability)
- 17.2.5 Stryker Corporation
- 17.2.5.1. Overview
- 17.2.5.2. Products
- 17.2.5.3. SWOT Analysis
- 17.2.5.4. Recent Developments
- 17.2.5.5. Financials (Based on Availability)
- 17.2.6 Karl Storz GmbH & Co KG
- 17.2.6.1. Overview
- 17.2.6.2. Products
- 17.2.6.3. SWOT Analysis
- 17.2.6.4. Recent Developments
- 17.2.6.5. Financials (Based on Availability)
- 17.2.7 Conmed Corporation
- 17.2.7.1. Overview
- 17.2.7.2. Products
- 17.2.7.3. SWOT Analysis
- 17.2.7.4. Recent Developments
- 17.2.7.5. Financials (Based on Availability)
- 17.2.8 Johnson & Johnson
- 17.2.8.1. Overview
- 17.2.8.2. Products
- 17.2.8.3. SWOT Analysis
- 17.2.8.4. Recent Developments
- 17.2.8.5. Financials (Based on Availability)
- 17.2.1 Smith & Nephew PLC
List of Figures
- Figure 1: Global Arthroscopy Instruments Industry Revenue Breakdown (Million, %) by Region 2024 & 2032
- Figure 2: Global Arthroscopy Instruments Industry Volume Breakdown (K Unit, %) by Region 2024 & 2032
- Figure 3: North America Arthroscopy Instruments Industry Revenue (Million), by Country 2024 & 2032
- Figure 4: North America Arthroscopy Instruments Industry Volume (K Unit), by Country 2024 & 2032
- Figure 5: North America Arthroscopy Instruments Industry Revenue Share (%), by Country 2024 & 2032
- Figure 6: North America Arthroscopy Instruments Industry Volume Share (%), by Country 2024 & 2032
- Figure 7: Europe Arthroscopy Instruments Industry Revenue (Million), by Country 2024 & 2032
- Figure 8: Europe Arthroscopy Instruments Industry Volume (K Unit), by Country 2024 & 2032
- Figure 9: Europe Arthroscopy Instruments Industry Revenue Share (%), by Country 2024 & 2032
- Figure 10: Europe Arthroscopy Instruments Industry Volume Share (%), by Country 2024 & 2032
- Figure 11: Asia Pacific Arthroscopy Instruments Industry Revenue (Million), by Country 2024 & 2032
- Figure 12: Asia Pacific Arthroscopy Instruments Industry Volume (K Unit), by Country 2024 & 2032
- Figure 13: Asia Pacific Arthroscopy Instruments Industry Revenue Share (%), by Country 2024 & 2032
- Figure 14: Asia Pacific Arthroscopy Instruments Industry Volume Share (%), by Country 2024 & 2032
- Figure 15: GCC Arthroscopy Instruments Industry Revenue (Million), by Country 2024 & 2032
- Figure 16: GCC Arthroscopy Instruments Industry Volume (K Unit), by Country 2024 & 2032
- Figure 17: GCC Arthroscopy Instruments Industry Revenue Share (%), by Country 2024 & 2032
- Figure 18: GCC Arthroscopy Instruments Industry Volume Share (%), by Country 2024 & 2032
- Figure 19: South America Arthroscopy Instruments Industry Revenue (Million), by Country 2024 & 2032
- Figure 20: South America Arthroscopy Instruments Industry Volume (K Unit), by Country 2024 & 2032
- Figure 21: South America Arthroscopy Instruments Industry Revenue Share (%), by Country 2024 & 2032
- Figure 22: South America Arthroscopy Instruments Industry Volume Share (%), by Country 2024 & 2032
- Figure 23: North America Arthroscopy Instruments Industry Revenue (Million), by Application 2024 & 2032
- Figure 24: North America Arthroscopy Instruments Industry Volume (K Unit), by Application 2024 & 2032
- Figure 25: North America Arthroscopy Instruments Industry Revenue Share (%), by Application 2024 & 2032
- Figure 26: North America Arthroscopy Instruments Industry Volume Share (%), by Application 2024 & 2032
- Figure 27: North America Arthroscopy Instruments Industry Revenue (Million), by Product 2024 & 2032
- Figure 28: North America Arthroscopy Instruments Industry Volume (K Unit), by Product 2024 & 2032
- Figure 29: North America Arthroscopy Instruments Industry Revenue Share (%), by Product 2024 & 2032
- Figure 30: North America Arthroscopy Instruments Industry Volume Share (%), by Product 2024 & 2032
- Figure 31: North America Arthroscopy Instruments Industry Revenue (Million), by Country 2024 & 2032
- Figure 32: North America Arthroscopy Instruments Industry Volume (K Unit), by Country 2024 & 2032
- Figure 33: North America Arthroscopy Instruments Industry Revenue Share (%), by Country 2024 & 2032
- Figure 34: North America Arthroscopy Instruments Industry Volume Share (%), by Country 2024 & 2032
- Figure 35: Europe Arthroscopy Instruments Industry Revenue (Million), by Application 2024 & 2032
- Figure 36: Europe Arthroscopy Instruments Industry Volume (K Unit), by Application 2024 & 2032
- Figure 37: Europe Arthroscopy Instruments Industry Revenue Share (%), by Application 2024 & 2032
- Figure 38: Europe Arthroscopy Instruments Industry Volume Share (%), by Application 2024 & 2032
- Figure 39: Europe Arthroscopy Instruments Industry Revenue (Million), by Product 2024 & 2032
- Figure 40: Europe Arthroscopy Instruments Industry Volume (K Unit), by Product 2024 & 2032
- Figure 41: Europe Arthroscopy Instruments Industry Revenue Share (%), by Product 2024 & 2032
- Figure 42: Europe Arthroscopy Instruments Industry Volume Share (%), by Product 2024 & 2032
- Figure 43: Europe Arthroscopy Instruments Industry Revenue (Million), by Country 2024 & 2032
- Figure 44: Europe Arthroscopy Instruments Industry Volume (K Unit), by Country 2024 & 2032
- Figure 45: Europe Arthroscopy Instruments Industry Revenue Share (%), by Country 2024 & 2032
- Figure 46: Europe Arthroscopy Instruments Industry Volume Share (%), by Country 2024 & 2032
- Figure 47: Asia Pacific Arthroscopy Instruments Industry Revenue (Million), by Application 2024 & 2032
- Figure 48: Asia Pacific Arthroscopy Instruments Industry Volume (K Unit), by Application 2024 & 2032
- Figure 49: Asia Pacific Arthroscopy Instruments Industry Revenue Share (%), by Application 2024 & 2032
- Figure 50: Asia Pacific Arthroscopy Instruments Industry Volume Share (%), by Application 2024 & 2032
- Figure 51: Asia Pacific Arthroscopy Instruments Industry Revenue (Million), by Product 2024 & 2032
- Figure 52: Asia Pacific Arthroscopy Instruments Industry Volume (K Unit), by Product 2024 & 2032
- Figure 53: Asia Pacific Arthroscopy Instruments Industry Revenue Share (%), by Product 2024 & 2032
- Figure 54: Asia Pacific Arthroscopy Instruments Industry Volume Share (%), by Product 2024 & 2032
- Figure 55: Asia Pacific Arthroscopy Instruments Industry Revenue (Million), by Country 2024 & 2032
- Figure 56: Asia Pacific Arthroscopy Instruments Industry Volume (K Unit), by Country 2024 & 2032
- Figure 57: Asia Pacific Arthroscopy Instruments Industry Revenue Share (%), by Country 2024 & 2032
- Figure 58: Asia Pacific Arthroscopy Instruments Industry Volume Share (%), by Country 2024 & 2032
- Figure 59: Middle East Arthroscopy Instruments Industry Revenue (Million), by Application 2024 & 2032
- Figure 60: Middle East Arthroscopy Instruments Industry Volume (K Unit), by Application 2024 & 2032
- Figure 61: Middle East Arthroscopy Instruments Industry Revenue Share (%), by Application 2024 & 2032
- Figure 62: Middle East Arthroscopy Instruments Industry Volume Share (%), by Application 2024 & 2032
- Figure 63: Middle East Arthroscopy Instruments Industry Revenue (Million), by Product 2024 & 2032
- Figure 64: Middle East Arthroscopy Instruments Industry Volume (K Unit), by Product 2024 & 2032
- Figure 65: Middle East Arthroscopy Instruments Industry Revenue Share (%), by Product 2024 & 2032
- Figure 66: Middle East Arthroscopy Instruments Industry Volume Share (%), by Product 2024 & 2032
- Figure 67: Middle East Arthroscopy Instruments Industry Revenue (Million), by Country 2024 & 2032
- Figure 68: Middle East Arthroscopy Instruments Industry Volume (K Unit), by Country 2024 & 2032
- Figure 69: Middle East Arthroscopy Instruments Industry Revenue Share (%), by Country 2024 & 2032
- Figure 70: Middle East Arthroscopy Instruments Industry Volume Share (%), by Country 2024 & 2032
- Figure 71: GCC Arthroscopy Instruments Industry Revenue (Million), by Application 2024 & 2032
- Figure 72: GCC Arthroscopy Instruments Industry Volume (K Unit), by Application 2024 & 2032
- Figure 73: GCC Arthroscopy Instruments Industry Revenue Share (%), by Application 2024 & 2032
- Figure 74: GCC Arthroscopy Instruments Industry Volume Share (%), by Application 2024 & 2032
- Figure 75: GCC Arthroscopy Instruments Industry Revenue (Million), by Product 2024 & 2032
- Figure 76: GCC Arthroscopy Instruments Industry Volume (K Unit), by Product 2024 & 2032
- Figure 77: GCC Arthroscopy Instruments Industry Revenue Share (%), by Product 2024 & 2032
- Figure 78: GCC Arthroscopy Instruments Industry Volume Share (%), by Product 2024 & 2032
- Figure 79: GCC Arthroscopy Instruments Industry Revenue (Million), by Country 2024 & 2032
- Figure 80: GCC Arthroscopy Instruments Industry Volume (K Unit), by Country 2024 & 2032
- Figure 81: GCC Arthroscopy Instruments Industry Revenue Share (%), by Country 2024 & 2032
- Figure 82: GCC Arthroscopy Instruments Industry Volume Share (%), by Country 2024 & 2032
- Figure 83: South America Arthroscopy Instruments Industry Revenue (Million), by Application 2024 & 2032
- Figure 84: South America Arthroscopy Instruments Industry Volume (K Unit), by Application 2024 & 2032
- Figure 85: South America Arthroscopy Instruments Industry Revenue Share (%), by Application 2024 & 2032
- Figure 86: South America Arthroscopy Instruments Industry Volume Share (%), by Application 2024 & 2032
- Figure 87: South America Arthroscopy Instruments Industry Revenue (Million), by Product 2024 & 2032
- Figure 88: South America Arthroscopy Instruments Industry Volume (K Unit), by Product 2024 & 2032
- Figure 89: South America Arthroscopy Instruments Industry Revenue Share (%), by Product 2024 & 2032
- Figure 90: South America Arthroscopy Instruments Industry Volume Share (%), by Product 2024 & 2032
- Figure 91: South America Arthroscopy Instruments Industry Revenue (Million), by Country 2024 & 2032
- Figure 92: South America Arthroscopy Instruments Industry Volume (K Unit), by Country 2024 & 2032
- Figure 93: South America Arthroscopy Instruments Industry Revenue Share (%), by Country 2024 & 2032
- Figure 94: South America Arthroscopy Instruments Industry Volume Share (%), by Country 2024 & 2032
List of Tables
- Table 1: Global Arthroscopy Instruments Industry Revenue Million Forecast, by Region 2019 & 2032
- Table 2: Global Arthroscopy Instruments Industry Volume K Unit Forecast, by Region 2019 & 2032
- Table 3: Global Arthroscopy Instruments Industry Revenue Million Forecast, by Application 2019 & 2032
- Table 4: Global Arthroscopy Instruments Industry Volume K Unit Forecast, by Application 2019 & 2032
- Table 5: Global Arthroscopy Instruments Industry Revenue Million Forecast, by Product 2019 & 2032
- Table 6: Global Arthroscopy Instruments Industry Volume K Unit Forecast, by Product 2019 & 2032
- Table 7: Global Arthroscopy Instruments Industry Revenue Million Forecast, by Region 2019 & 2032
- Table 8: Global Arthroscopy Instruments Industry Volume K Unit Forecast, by Region 2019 & 2032
- Table 9: Global Arthroscopy Instruments Industry Revenue Million Forecast, by Country 2019 & 2032
- Table 10: Global Arthroscopy Instruments Industry Volume K Unit Forecast, by Country 2019 & 2032
- Table 11: Global Arthroscopy Instruments Industry Revenue Million Forecast, by Country 2019 & 2032
- Table 12: Global Arthroscopy Instruments Industry Volume K Unit Forecast, by Country 2019 & 2032
- Table 13: Global Arthroscopy Instruments Industry Revenue Million Forecast, by Country 2019 & 2032
- Table 14: Global Arthroscopy Instruments Industry Volume K Unit Forecast, by Country 2019 & 2032
- Table 15: Global Arthroscopy Instruments Industry Revenue Million Forecast, by Country 2019 & 2032
- Table 16: Global Arthroscopy Instruments Industry Volume K Unit Forecast, by Country 2019 & 2032
- Table 17: Global Arthroscopy Instruments Industry Revenue Million Forecast, by Country 2019 & 2032
- Table 18: Global Arthroscopy Instruments Industry Volume K Unit Forecast, by Country 2019 & 2032
- Table 19: Global Arthroscopy Instruments Industry Revenue Million Forecast, by Application 2019 & 2032
- Table 20: Global Arthroscopy Instruments Industry Volume K Unit Forecast, by Application 2019 & 2032
- Table 21: Global Arthroscopy Instruments Industry Revenue Million Forecast, by Product 2019 & 2032
- Table 22: Global Arthroscopy Instruments Industry Volume K Unit Forecast, by Product 2019 & 2032
- Table 23: Global Arthroscopy Instruments Industry Revenue Million Forecast, by Country 2019 & 2032
- Table 24: Global Arthroscopy Instruments Industry Volume K Unit Forecast, by Country 2019 & 2032
- Table 25: United States Arthroscopy Instruments Industry Revenue (Million) Forecast, by Application 2019 & 2032
- Table 26: United States Arthroscopy Instruments Industry Volume (K Unit) Forecast, by Application 2019 & 2032
- Table 27: Canada Arthroscopy Instruments Industry Revenue (Million) Forecast, by Application 2019 & 2032
- Table 28: Canada Arthroscopy Instruments Industry Volume (K Unit) Forecast, by Application 2019 & 2032
- Table 29: Mexico Arthroscopy Instruments Industry Revenue (Million) Forecast, by Application 2019 & 2032
- Table 30: Mexico Arthroscopy Instruments Industry Volume (K Unit) Forecast, by Application 2019 & 2032
- Table 31: Global Arthroscopy Instruments Industry Revenue Million Forecast, by Application 2019 & 2032
- Table 32: Global Arthroscopy Instruments Industry Volume K Unit Forecast, by Application 2019 & 2032
- Table 33: Global Arthroscopy Instruments Industry Revenue Million Forecast, by Product 2019 & 2032
- Table 34: Global Arthroscopy Instruments Industry Volume K Unit Forecast, by Product 2019 & 2032
- Table 35: Global Arthroscopy Instruments Industry Revenue Million Forecast, by Country 2019 & 2032
- Table 36: Global Arthroscopy Instruments Industry Volume K Unit Forecast, by Country 2019 & 2032
- Table 37: Germany Arthroscopy Instruments Industry Revenue (Million) Forecast, by Application 2019 & 2032
- Table 38: Germany Arthroscopy Instruments Industry Volume (K Unit) Forecast, by Application 2019 & 2032
- Table 39: United Kingdom Arthroscopy Instruments Industry Revenue (Million) Forecast, by Application 2019 & 2032
- Table 40: United Kingdom Arthroscopy Instruments Industry Volume (K Unit) Forecast, by Application 2019 & 2032
- Table 41: France Arthroscopy Instruments Industry Revenue (Million) Forecast, by Application 2019 & 2032
- Table 42: France Arthroscopy Instruments Industry Volume (K Unit) Forecast, by Application 2019 & 2032
- Table 43: Italy Arthroscopy Instruments Industry Revenue (Million) Forecast, by Application 2019 & 2032
- Table 44: Italy Arthroscopy Instruments Industry Volume (K Unit) Forecast, by Application 2019 & 2032
- Table 45: Spain Arthroscopy Instruments Industry Revenue (Million) Forecast, by Application 2019 & 2032
- Table 46: Spain Arthroscopy Instruments Industry Volume (K Unit) Forecast, by Application 2019 & 2032
- Table 47: Rest of Europe Arthroscopy Instruments Industry Revenue (Million) Forecast, by Application 2019 & 2032
- Table 48: Rest of Europe Arthroscopy Instruments Industry Volume (K Unit) Forecast, by Application 2019 & 2032
- Table 49: Global Arthroscopy Instruments Industry Revenue Million Forecast, by Application 2019 & 2032
- Table 50: Global Arthroscopy Instruments Industry Volume K Unit Forecast, by Application 2019 & 2032
- Table 51: Global Arthroscopy Instruments Industry Revenue Million Forecast, by Product 2019 & 2032
- Table 52: Global Arthroscopy Instruments Industry Volume K Unit Forecast, by Product 2019 & 2032
- Table 53: Global Arthroscopy Instruments Industry Revenue Million Forecast, by Country 2019 & 2032
- Table 54: Global Arthroscopy Instruments Industry Volume K Unit Forecast, by Country 2019 & 2032
- Table 55: China Arthroscopy Instruments Industry Revenue (Million) Forecast, by Application 2019 & 2032
- Table 56: China Arthroscopy Instruments Industry Volume (K Unit) Forecast, by Application 2019 & 2032
- Table 57: Japan Arthroscopy Instruments Industry Revenue (Million) Forecast, by Application 2019 & 2032
- Table 58: Japan Arthroscopy Instruments Industry Volume (K Unit) Forecast, by Application 2019 & 2032
- Table 59: India Arthroscopy Instruments Industry Revenue (Million) Forecast, by Application 2019 & 2032
- Table 60: India Arthroscopy Instruments Industry Volume (K Unit) Forecast, by Application 2019 & 2032
- Table 61: Australia Arthroscopy Instruments Industry Revenue (Million) Forecast, by Application 2019 & 2032
- Table 62: Australia Arthroscopy Instruments Industry Volume (K Unit) Forecast, by Application 2019 & 2032
- Table 63: South korea Arthroscopy Instruments Industry Revenue (Million) Forecast, by Application 2019 & 2032
- Table 64: South korea Arthroscopy Instruments Industry Volume (K Unit) Forecast, by Application 2019 & 2032
- Table 65: Rest of Asia Pacific Arthroscopy Instruments Industry Revenue (Million) Forecast, by Application 2019 & 2032
- Table 66: Rest of Asia Pacific Arthroscopy Instruments Industry Volume (K Unit) Forecast, by Application 2019 & 2032
- Table 67: Global Arthroscopy Instruments Industry Revenue Million Forecast, by Application 2019 & 2032
- Table 68: Global Arthroscopy Instruments Industry Volume K Unit Forecast, by Application 2019 & 2032
- Table 69: Global Arthroscopy Instruments Industry Revenue Million Forecast, by Product 2019 & 2032
- Table 70: Global Arthroscopy Instruments Industry Volume K Unit Forecast, by Product 2019 & 2032
- Table 71: Global Arthroscopy Instruments Industry Revenue Million Forecast, by Country 2019 & 2032
- Table 72: Global Arthroscopy Instruments Industry Volume K Unit Forecast, by Country 2019 & 2032
- Table 73: Global Arthroscopy Instruments Industry Revenue Million Forecast, by Application 2019 & 2032
- Table 74: Global Arthroscopy Instruments Industry Volume K Unit Forecast, by Application 2019 & 2032
- Table 75: Global Arthroscopy Instruments Industry Revenue Million Forecast, by Product 2019 & 2032
- Table 76: Global Arthroscopy Instruments Industry Volume K Unit Forecast, by Product 2019 & 2032
- Table 77: Global Arthroscopy Instruments Industry Revenue Million Forecast, by Country 2019 & 2032
- Table 78: Global Arthroscopy Instruments Industry Volume K Unit Forecast, by Country 2019 & 2032
- Table 79: South Africa Arthroscopy Instruments Industry Revenue (Million) Forecast, by Application 2019 & 2032
- Table 80: South Africa Arthroscopy Instruments Industry Volume (K Unit) Forecast, by Application 2019 & 2032
- Table 81: Rest of Middle East Arthroscopy Instruments Industry Revenue (Million) Forecast, by Application 2019 & 2032
- Table 82: Rest of Middle East Arthroscopy Instruments Industry Volume (K Unit) Forecast, by Application 2019 & 2032
- Table 83: Global Arthroscopy Instruments Industry Revenue Million Forecast, by Application 2019 & 2032
- Table 84: Global Arthroscopy Instruments Industry Volume K Unit Forecast, by Application 2019 & 2032
- Table 85: Global Arthroscopy Instruments Industry Revenue Million Forecast, by Product 2019 & 2032
- Table 86: Global Arthroscopy Instruments Industry Volume K Unit Forecast, by Product 2019 & 2032
- Table 87: Global Arthroscopy Instruments Industry Revenue Million Forecast, by Country 2019 & 2032
- Table 88: Global Arthroscopy Instruments Industry Volume K Unit Forecast, by Country 2019 & 2032
- Table 89: Brazil Arthroscopy Instruments Industry Revenue (Million) Forecast, by Application 2019 & 2032
- Table 90: Brazil Arthroscopy Instruments Industry Volume (K Unit) Forecast, by Application 2019 & 2032
- Table 91: Argentina Arthroscopy Instruments Industry Revenue (Million) Forecast, by Application 2019 & 2032
- Table 92: Argentina Arthroscopy Instruments Industry Volume (K Unit) Forecast, by Application 2019 & 2032
- Table 93: Rest of South America Arthroscopy Instruments Industry Revenue (Million) Forecast, by Application 2019 & 2032
- Table 94: Rest of South America Arthroscopy Instruments Industry Volume (K Unit) Forecast, by Application 2019 & 2032
Frequently Asked Questions
1. What is the projected Compound Annual Growth Rate (CAGR) of the Arthroscopy Instruments Industry?
The projected CAGR is approximately 5.69%.
2. Which companies are prominent players in the Arthroscopy Instruments Industry?
Key companies in the market include Smith & Nephew PLC, Arthrex Inc, Medtronic PLC, Richard Wolf GmbH, Stryker Corporation, Karl Storz GmbH & Co KG, Conmed Corporation, Johnson & Johnson.
3. What are the main segments of the Arthroscopy Instruments Industry?
The market segments include Application, Product.
4. Can you provide details about the market size?
The market size is estimated to be USD 1.65 Million as of 2022.
5. What are some drivers contributing to market growth?
Increasing Incidences of Sports Injuries; Rising Geriatric Population; Technological Advancements in Arthroscopic Implants.
6. What are the notable trends driving market growth?
Knee Arthroscopy Segment is Expected to Witness Growth Over the Forecast Period.
7. Are there any restraints impacting market growth?
Lack of Skilled Surgeons; Stringent Regulatory Requirements; High Cost of Arthroscopy Devices.
8. Can you provide examples of recent developments in the market?
In February 2022, Formus Labs raised USD 5 million and struck a partnership with Zimmer Biomet for the co-development and global distribution of its technology.
9. What pricing options are available for accessing the report?
Pricing options include single-user, multi-user, and enterprise licenses priced at USD 4750, USD 5250, and USD 8750 respectively.
10. Is the market size provided in terms of value or volume?
The market size is provided in terms of value, measured in Million and volume, measured in K Unit.
11. Are there any specific market keywords associated with the report?
Yes, the market keyword associated with the report is "Arthroscopy Instruments Industry," which aids in identifying and referencing the specific market segment covered.
12. How do I determine which pricing option suits my needs best?
The pricing options vary based on user requirements and access needs. Individual users may opt for single-user licenses, while businesses requiring broader access may choose multi-user or enterprise licenses for cost-effective access to the report.
13. Are there any additional resources or data provided in the Arthroscopy Instruments Industry report?
While the report offers comprehensive insights, it's advisable to review the specific contents or supplementary materials provided to ascertain if additional resources or data are available.
14. How can I stay updated on further developments or reports in the Arthroscopy Instruments Industry?
To stay informed about further developments, trends, and reports in the Arthroscopy Instruments Industry, consider subscribing to industry newsletters, following relevant companies and organizations, or regularly checking reputable industry news sources and publications.
Methodology
Step 1 - Identification of Relevant Samples Size from Population Database


Step 2 - Approaches for Defining Global Market Size (Value, Volume* & Price*)

Note*: In applicable scenarios
Step 3 - Data Sources
Primary Research
- Web Analytics
- Survey Reports
- Research Institute
- Latest Research Reports
- Opinion Leaders
Secondary Research
- Annual Reports
- White Paper
- Latest Press Release
- Industry Association
- Paid Database
- Investor Presentations

Step 4 - Data Triangulation
Involves using different sources of information in order to increase the validity of a study
These sources are likely to be stakeholders in a program - participants, other researchers, program staff, other community members, and so on.
Then we put all data in single framework & apply various statistical tools to find out the dynamic on the market.
During the analysis stage, feedback from the stakeholder groups would be compared to determine areas of agreement as well as areas of divergence
