

Key Insights
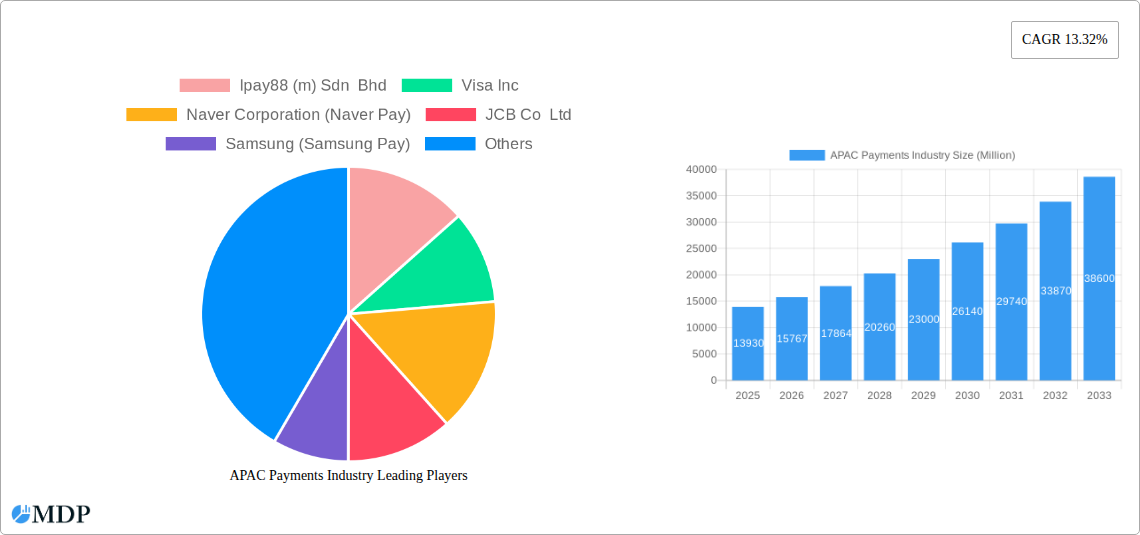
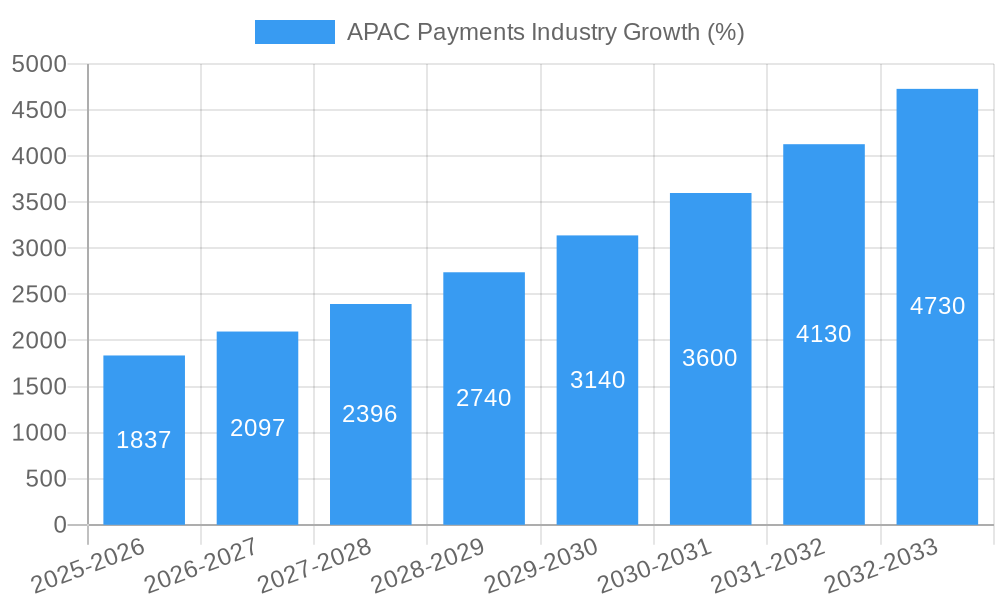
The Asia-Pacific (APAC) payments industry is experiencing robust growth, projected to reach a market size of $13.93 billion in 2025, expanding at a Compound Annual Growth Rate (CAGR) of 13.32%. This surge is driven by several key factors. The region's burgeoning e-commerce sector, fueled by increasing smartphone penetration and internet access, is a significant catalyst. Furthermore, the rising adoption of digital wallets and mobile payment solutions, like those offered by Alipay, WeChat Pay, and GrabPay, is significantly disrupting traditional payment methods. Government initiatives promoting financial inclusion and digital transformation across various sectors – retail, entertainment, healthcare, and hospitality – are also accelerating this transformation. While challenges exist, such as addressing cybersecurity concerns and ensuring interoperability between various payment systems, the overall outlook remains overwhelmingly positive. The diverse landscape of payment providers, ranging from global giants like Visa and Mastercard to regional players like iPay88 and KakaoPay, is further fueling competition and innovation within the market.
China and India are the dominant markets within the APAC region, accounting for a significant portion of the overall market value. However, other countries like South Korea, Singapore, and Indonesia are also witnessing impressive growth trajectories, driven by their rapidly expanding economies and digitally savvy populations. The shift towards online payments is particularly pronounced in these countries, with e-commerce platforms integrating seamless payment gateways, enhancing user experience and driving transaction volumes. Looking ahead, the continued growth of the APAC payments industry is expected to be influenced by factors such as the expansion of 5G networks, the increasing adoption of contactless payments, and the emergence of innovative payment technologies like Buy Now Pay Later (BNPL) services. The regulatory landscape will also play a crucial role in shaping the future of the industry, particularly regarding data privacy and consumer protection.
This in-depth report provides a comprehensive analysis of the Asia-Pacific (APAC) payments industry, covering market dynamics, leading players, key trends, and future growth prospects. With a focus on the period 2019-2033, including a base year of 2025 and a forecast period of 2025-2033, this report is an essential resource for industry stakeholders, investors, and businesses seeking to understand and capitalize on the opportunities within this rapidly evolving market. The report analyzes a market valued at xx Million in 2024, projected to reach xx Million by 2033.
APAC Payments Industry Market Dynamics & Concentration
The APAC payments landscape is characterized by high growth, intense competition, and significant regional variations. Market concentration is moderate, with several global players alongside a multitude of regional and niche providers. Innovation is driven by advancements in mobile technology, digital wallets, and open banking initiatives. Regulatory frameworks vary significantly across countries, impacting market entry and operations. Product substitutes include traditional cash transactions and checks, though their usage is declining rapidly. End-user trends showcase a strong preference for digital and mobile payment options, especially among younger demographics. M&A activity has been significant, with larger players consolidating their market share and expanding into new markets.
- Market Share: Visa and Mastercard hold substantial market share, but regional players like Alipay and WeChat Pay dominate in specific countries. Ipay88 (m) Sdn Bhd holds a significant share in Malaysia. xx% of the market is controlled by the top 5 players.
- M&A Deal Counts: Over the past five years, there have been approximately xx M&A deals in the APAC payments industry, reflecting a consolidation trend.
APAC Payments Industry Industry Trends & Analysis
The APAC payments industry exhibits robust growth, driven by factors such as rising smartphone penetration, increasing internet and mobile banking adoption, and government initiatives promoting digital financial inclusion. The CAGR for the forecast period is estimated to be xx%. Technological disruptions, particularly the rise of super apps and embedded finance, are reshaping the competitive landscape. Consumer preferences are shifting rapidly towards contactless payments, mobile wallets, and buy-now-pay-later (BNPL) services. The market penetration of digital payments is expected to reach xx% by 2033. Competitive dynamics are marked by fierce competition, with both established players and fintech startups vying for market share.
Leading Markets & Segments in APAC Payments Industry
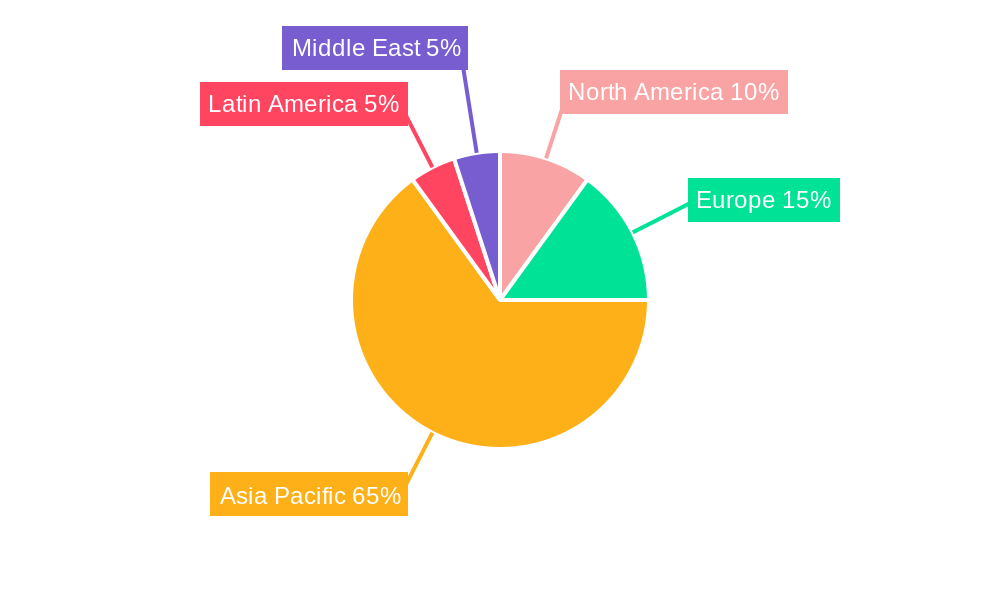
Dominant Regions/Countries: China and India are the largest markets, driven by their vast populations and rapid digital adoption. Other key markets include South Korea, Japan, Singapore, and Australia.
Dominant Segments:
- By Mode of Payment: Online payments (e-commerce) are experiencing faster growth than offline (Point of Sale) payments, primarily due to the expansion of e-commerce.
- By End-user Industry: The retail sector is the largest segment, followed by entertainment, healthcare and hospitality. Growth is particularly strong in the e-commerce sector driving demand for online payment solutions.
Key Drivers:
- China: Strong government support for digitalization, massive e-commerce market.
- India: Government's Digital India initiative, expanding UPI adoption.
- South Korea: High smartphone penetration, advanced technological infrastructure.
- Singapore: Pro-business environment, strong digital infrastructure.
The dominance of specific regions and segments stems from factors like economic policies that encourage digital payments, favorable regulatory environments, well-developed digital infrastructure, and high mobile penetration rates.
APAC Payments Industry Product Developments
The APAC payments industry is witnessing a surge in innovative payment products and services, including mobile wallets (e.g., Alipay, WeChat Pay, Grab Pay, Samsung Pay, Google Pay), BNPL solutions, and embedded finance offerings. These innovations aim to enhance convenience, security, and user experience. Technological trends such as AI, blockchain, and biometrics are being integrated into payment solutions to improve fraud prevention and personalization. The market fit for these innovations is strong, driven by the increasing demand for seamless and secure digital payment experiences.
Key Drivers of APAP Payments Industry Growth
Several factors fuel the growth of the APAC payments industry: rapid technological advancements, especially in mobile technology and digital wallets; increasing smartphone penetration and internet access; the expansion of e-commerce; supportive government policies promoting digital financial inclusion (e.g., India's Digital India initiative, China's fintech policies); and rising disposable incomes and consumer spending in many APAC countries.
Challenges in the APAC Payments Industry Market
The APAC payments industry faces various challenges, including the complexities of fragmented regulatory frameworks across different countries, concerns around data security and fraud, the need to address financial inclusion in underserved populations, and intense competition from both established players and new fintech entrants. These challenges can result in xx Million in annual losses, impacting overall market growth.
Emerging Opportunities in APAP Payments Industry
Significant long-term growth opportunities exist in the APAC payments industry due to the increasing adoption of mobile payments, the rise of cross-border payments, and the potential for growth in emerging markets. Technological breakthroughs such as AI and blockchain are poised to further enhance efficiency and security. Strategic partnerships between fintechs and traditional financial institutions will play a key role in shaping the future of the industry.
Leading Players in the APAC Payments Industry Sector
- Ipay88 (m) Sdn Bhd
- Visa Inc
- Naver Corporation (Naver Pay)
- JCB Co Ltd
- Samsung (Samsung Pay)
- Huawei Pay (Huawei Technologies Co Limited)
- Matercard Inc
- Smile Pay
- Toss Financial Services Private Limited
- American Express Company
- Grab Pay (grab Holdings Limited)
- PayCo (NHN Corp )
- Paypal Holdings Inc
- Google Pay (Alphabet Inc )
- kakaopay Corp
Key Milestones in APAC Payments Industry Industry
- October 2023: The linkage between India’s Unified Payments Interface (UPI) and Singapore’s PayNow expands cross-border digital payment options, boosting transaction volumes and financial inclusion. Six Indian banks (Indian Bank, Axis Bank, Bank of Baroda, DBS Bank India, ICICI Bank, Indian Overseas Bank, and State Bank of India) are initially participating.
- July 2023: Razorpay's launch of its first international payment gateway in Malaysia through Curlec, aiming to serve over 5,000 companies and achieve RM10 Bn in annualized GTV by 2025, expands its regional presence and enhances market competitiveness.
Strategic Outlook for APAC Payments Industry Market
The future of the APAC payments industry is bright, with substantial growth potential driven by ongoing digitalization, expanding e-commerce activities, and increasing financial inclusion initiatives. Strategic opportunities exist in leveraging emerging technologies like AI and blockchain, fostering strategic partnerships, and expanding into underserved markets. The industry will continue to see a shift towards mobile-first and super app-based payment solutions.
APAC Payments Industry Segmentation
-
1. Mode of Payment
-
1.1. Offline (Point of Sale)
- 1.1.1. Card Pay
- 1.1.2. Digital Wallets (includes mobile wallets)
- 1.1.3. Cash
- 1.1.4. Other Modes of Payment
-
1.2. Online Sale (E-commerce)
- 1.2.1. Other Mo
-
1.1. Offline (Point of Sale)
-
2. End-user Industry
- 2.1. Retail
- 2.2. Entertainment
- 2.3. Healthcare
- 2.4. Hospitality
- 2.5. Other End-user Industries
APAC Payments Industry Segmentation By Geography
-
1. North America
- 1.1. United States
- 1.2. Canada
- 1.3. Mexico
-
2. South America
- 2.1. Brazil
- 2.2. Argentina
- 2.3. Rest of South America
-
3. Europe
- 3.1. United Kingdom
- 3.2. Germany
- 3.3. France
- 3.4. Italy
- 3.5. Spain
- 3.6. Russia
- 3.7. Benelux
- 3.8. Nordics
- 3.9. Rest of Europe
-
4. Middle East & Africa
- 4.1. Turkey
- 4.2. Israel
- 4.3. GCC
- 4.4. North Africa
- 4.5. South Africa
- 4.6. Rest of Middle East & Africa
-
5. Asia Pacific
- 5.1. China
- 5.2. India
- 5.3. Japan
- 5.4. South Korea
- 5.5. ASEAN
- 5.6. Oceania
- 5.7. Rest of Asia Pacific
APAC Payments Industry REPORT HIGHLIGHTS
| Aspects | Details |
|---|---|
| Study Period | 2019-2033 |
| Base Year | 2024 |
| Estimated Year | 2025 |
| Forecast Period | 2025-2033 |
| Historical Period | 2019-2024 |
| Growth Rate | CAGR of 13.32% from 2019-2033 |
| Segmentation |
|
Table of Contents
- 1. Introduction
- 1.1. Research Scope
- 1.2. Market Segmentation
- 1.3. Research Methodology
- 1.4. Definitions and Assumptions
- 2. Executive Summary
- 2.1. Introduction
- 3. Market Dynamics
- 3.1. Introduction
- 3.2. Market Drivers
- 3.2.1. High Proliferation of E-commerce and Rising Adoption of M-commerce; Enablement Programs by Key Retailers and Government Encouraging Digitization of the Market; Growing Adoption of Buy Now Pay Later in Asia-Pacific Countries
- 3.3. Market Restrains
- 3.3.1. High Implementation and Maintenance Cost
- 3.4. Market Trends
- 3.4.1. Online sales segment to show higher growth
- 4. Market Factor Analysis
- 4.1. Porters Five Forces
- 4.2. Supply/Value Chain
- 4.3. PESTEL analysis
- 4.4. Market Entropy
- 4.5. Patent/Trademark Analysis
- 5. Global APAC Payments Industry Analysis, Insights and Forecast, 2019-2031
- 5.1. Market Analysis, Insights and Forecast - by Mode of Payment
- 5.1.1. Offline (Point of Sale)
- 5.1.1.1. Card Pay
- 5.1.1.2. Digital Wallets (includes mobile wallets)
- 5.1.1.3. Cash
- 5.1.1.4. Other Modes of Payment
- 5.1.2. Online Sale (E-commerce)
- 5.1.2.1. Other Mo
- 5.1.1. Offline (Point of Sale)
- 5.2. Market Analysis, Insights and Forecast - by End-user Industry
- 5.2.1. Retail
- 5.2.2. Entertainment
- 5.2.3. Healthcare
- 5.2.4. Hospitality
- 5.2.5. Other End-user Industries
- 5.3. Market Analysis, Insights and Forecast - by Region
- 5.3.1. North America
- 5.3.2. South America
- 5.3.3. Europe
- 5.3.4. Middle East & Africa
- 5.3.5. Asia Pacific
- 5.1. Market Analysis, Insights and Forecast - by Mode of Payment
- 6. North America APAC Payments Industry Analysis, Insights and Forecast, 2019-2031
- 6.1. Market Analysis, Insights and Forecast - by Mode of Payment
- 6.1.1. Offline (Point of Sale)
- 6.1.1.1. Card Pay
- 6.1.1.2. Digital Wallets (includes mobile wallets)
- 6.1.1.3. Cash
- 6.1.1.4. Other Modes of Payment
- 6.1.2. Online Sale (E-commerce)
- 6.1.2.1. Other Mo
- 6.1.1. Offline (Point of Sale)
- 6.2. Market Analysis, Insights and Forecast - by End-user Industry
- 6.2.1. Retail
- 6.2.2. Entertainment
- 6.2.3. Healthcare
- 6.2.4. Hospitality
- 6.2.5. Other End-user Industries
- 6.1. Market Analysis, Insights and Forecast - by Mode of Payment
- 7. South America APAC Payments Industry Analysis, Insights and Forecast, 2019-2031
- 7.1. Market Analysis, Insights and Forecast - by Mode of Payment
- 7.1.1. Offline (Point of Sale)
- 7.1.1.1. Card Pay
- 7.1.1.2. Digital Wallets (includes mobile wallets)
- 7.1.1.3. Cash
- 7.1.1.4. Other Modes of Payment
- 7.1.2. Online Sale (E-commerce)
- 7.1.2.1. Other Mo
- 7.1.1. Offline (Point of Sale)
- 7.2. Market Analysis, Insights and Forecast - by End-user Industry
- 7.2.1. Retail
- 7.2.2. Entertainment
- 7.2.3. Healthcare
- 7.2.4. Hospitality
- 7.2.5. Other End-user Industries
- 7.1. Market Analysis, Insights and Forecast - by Mode of Payment
- 8. Europe APAC Payments Industry Analysis, Insights and Forecast, 2019-2031
- 8.1. Market Analysis, Insights and Forecast - by Mode of Payment
- 8.1.1. Offline (Point of Sale)
- 8.1.1.1. Card Pay
- 8.1.1.2. Digital Wallets (includes mobile wallets)
- 8.1.1.3. Cash
- 8.1.1.4. Other Modes of Payment
- 8.1.2. Online Sale (E-commerce)
- 8.1.2.1. Other Mo
- 8.1.1. Offline (Point of Sale)
- 8.2. Market Analysis, Insights and Forecast - by End-user Industry
- 8.2.1. Retail
- 8.2.2. Entertainment
- 8.2.3. Healthcare
- 8.2.4. Hospitality
- 8.2.5. Other End-user Industries
- 8.1. Market Analysis, Insights and Forecast - by Mode of Payment
- 9. Middle East & Africa APAC Payments Industry Analysis, Insights and Forecast, 2019-2031
- 9.1. Market Analysis, Insights and Forecast - by Mode of Payment
- 9.1.1. Offline (Point of Sale)
- 9.1.1.1. Card Pay
- 9.1.1.2. Digital Wallets (includes mobile wallets)
- 9.1.1.3. Cash
- 9.1.1.4. Other Modes of Payment
- 9.1.2. Online Sale (E-commerce)
- 9.1.2.1. Other Mo
- 9.1.1. Offline (Point of Sale)
- 9.2. Market Analysis, Insights and Forecast - by End-user Industry
- 9.2.1. Retail
- 9.2.2. Entertainment
- 9.2.3. Healthcare
- 9.2.4. Hospitality
- 9.2.5. Other End-user Industries
- 9.1. Market Analysis, Insights and Forecast - by Mode of Payment
- 10. Asia Pacific APAC Payments Industry Analysis, Insights and Forecast, 2019-2031
- 10.1. Market Analysis, Insights and Forecast - by Mode of Payment
- 10.1.1. Offline (Point of Sale)
- 10.1.1.1. Card Pay
- 10.1.1.2. Digital Wallets (includes mobile wallets)
- 10.1.1.3. Cash
- 10.1.1.4. Other Modes of Payment
- 10.1.2. Online Sale (E-commerce)
- 10.1.2.1. Other Mo
- 10.1.1. Offline (Point of Sale)
- 10.2. Market Analysis, Insights and Forecast - by End-user Industry
- 10.2.1. Retail
- 10.2.2. Entertainment
- 10.2.3. Healthcare
- 10.2.4. Hospitality
- 10.2.5. Other End-user Industries
- 10.1. Market Analysis, Insights and Forecast - by Mode of Payment
- 11. North America APAC Payments Industry Analysis, Insights and Forecast, 2019-2031
- 11.1. Market Analysis, Insights and Forecast - By Country/Sub-region
- 11.1.1.
- 12. Europe APAC Payments Industry Analysis, Insights and Forecast, 2019-2031
- 12.1. Market Analysis, Insights and Forecast - By Country/Sub-region
- 12.1.1.
- 13. Asia Pacific APAC Payments Industry Analysis, Insights and Forecast, 2019-2031
- 13.1. Market Analysis, Insights and Forecast - By Country/Sub-region
- 13.1.1.
- 14. Latin America APAC Payments Industry Analysis, Insights and Forecast, 2019-2031
- 14.1. Market Analysis, Insights and Forecast - By Country/Sub-region
- 14.1.1.
- 15. Middle East APAC Payments Industry Analysis, Insights and Forecast, 2019-2031
- 15.1. Market Analysis, Insights and Forecast - By Country/Sub-region
- 15.1.1.
- 16. Competitive Analysis
- 16.1. Global Market Share Analysis 2024
- 16.2. Company Profiles
- 16.2.1 Ipay88 (m) Sdn Bhd
- 16.2.1.1. Overview
- 16.2.1.2. Products
- 16.2.1.3. SWOT Analysis
- 16.2.1.4. Recent Developments
- 16.2.1.5. Financials (Based on Availability)
- 16.2.2 Visa Inc
- 16.2.2.1. Overview
- 16.2.2.2. Products
- 16.2.2.3. SWOT Analysis
- 16.2.2.4. Recent Developments
- 16.2.2.5. Financials (Based on Availability)
- 16.2.3 Naver Corporation (Naver Pay)
- 16.2.3.1. Overview
- 16.2.3.2. Products
- 16.2.3.3. SWOT Analysis
- 16.2.3.4. Recent Developments
- 16.2.3.5. Financials (Based on Availability)
- 16.2.4 JCB Co Ltd
- 16.2.4.1. Overview
- 16.2.4.2. Products
- 16.2.4.3. SWOT Analysis
- 16.2.4.4. Recent Developments
- 16.2.4.5. Financials (Based on Availability)
- 16.2.5 Samsung (Samsung Pay)
- 16.2.5.1. Overview
- 16.2.5.2. Products
- 16.2.5.3. SWOT Analysis
- 16.2.5.4. Recent Developments
- 16.2.5.5. Financials (Based on Availability)
- 16.2.6 Huawei Pay (Huawei Technologies Co Limited*List Not Exhaustive
- 16.2.6.1. Overview
- 16.2.6.2. Products
- 16.2.6.3. SWOT Analysis
- 16.2.6.4. Recent Developments
- 16.2.6.5. Financials (Based on Availability)
- 16.2.7 Matercard Inc
- 16.2.7.1. Overview
- 16.2.7.2. Products
- 16.2.7.3. SWOT Analysis
- 16.2.7.4. Recent Developments
- 16.2.7.5. Financials (Based on Availability)
- 16.2.8 Smile Pay
- 16.2.8.1. Overview
- 16.2.8.2. Products
- 16.2.8.3. SWOT Analysis
- 16.2.8.4. Recent Developments
- 16.2.8.5. Financials (Based on Availability)
- 16.2.9 Toss Financial Services Private Limited
- 16.2.9.1. Overview
- 16.2.9.2. Products
- 16.2.9.3. SWOT Analysis
- 16.2.9.4. Recent Developments
- 16.2.9.5. Financials (Based on Availability)
- 16.2.10 American Express Company
- 16.2.10.1. Overview
- 16.2.10.2. Products
- 16.2.10.3. SWOT Analysis
- 16.2.10.4. Recent Developments
- 16.2.10.5. Financials (Based on Availability)
- 16.2.11 Grab Pay (grab Holdings Limited)
- 16.2.11.1. Overview
- 16.2.11.2. Products
- 16.2.11.3. SWOT Analysis
- 16.2.11.4. Recent Developments
- 16.2.11.5. Financials (Based on Availability)
- 16.2.12 Samsung Pay (Samsung Electronics Co ltd)
- 16.2.12.1. Overview
- 16.2.12.2. Products
- 16.2.12.3. SWOT Analysis
- 16.2.12.4. Recent Developments
- 16.2.12.5. Financials (Based on Availability)
- 16.2.13 PayCo (NHN Corp )
- 16.2.13.1. Overview
- 16.2.13.2. Products
- 16.2.13.3. SWOT Analysis
- 16.2.13.4. Recent Developments
- 16.2.13.5. Financials (Based on Availability)
- 16.2.14 Paypal Holdings Inc
- 16.2.14.1. Overview
- 16.2.14.2. Products
- 16.2.14.3. SWOT Analysis
- 16.2.14.4. Recent Developments
- 16.2.14.5. Financials (Based on Availability)
- 16.2.15 Google Pay (Alphabet Inc )
- 16.2.15.1. Overview
- 16.2.15.2. Products
- 16.2.15.3. SWOT Analysis
- 16.2.15.4. Recent Developments
- 16.2.15.5. Financials (Based on Availability)
- 16.2.16 kakaopay Corp
- 16.2.16.1. Overview
- 16.2.16.2. Products
- 16.2.16.3. SWOT Analysis
- 16.2.16.4. Recent Developments
- 16.2.16.5. Financials (Based on Availability)
- 16.2.1 Ipay88 (m) Sdn Bhd
List of Figures
- Figure 1: Global APAC Payments Industry Revenue Breakdown (Million, %) by Region 2024 & 2032
- Figure 2: North America APAC Payments Industry Revenue (Million), by Country 2024 & 2032
- Figure 3: North America APAC Payments Industry Revenue Share (%), by Country 2024 & 2032
- Figure 4: Europe APAC Payments Industry Revenue (Million), by Country 2024 & 2032
- Figure 5: Europe APAC Payments Industry Revenue Share (%), by Country 2024 & 2032
- Figure 6: Asia Pacific APAC Payments Industry Revenue (Million), by Country 2024 & 2032
- Figure 7: Asia Pacific APAC Payments Industry Revenue Share (%), by Country 2024 & 2032
- Figure 8: Latin America APAC Payments Industry Revenue (Million), by Country 2024 & 2032
- Figure 9: Latin America APAC Payments Industry Revenue Share (%), by Country 2024 & 2032
- Figure 10: Middle East APAC Payments Industry Revenue (Million), by Country 2024 & 2032
- Figure 11: Middle East APAC Payments Industry Revenue Share (%), by Country 2024 & 2032
- Figure 12: North America APAC Payments Industry Revenue (Million), by Mode of Payment 2024 & 2032
- Figure 13: North America APAC Payments Industry Revenue Share (%), by Mode of Payment 2024 & 2032
- Figure 14: North America APAC Payments Industry Revenue (Million), by End-user Industry 2024 & 2032
- Figure 15: North America APAC Payments Industry Revenue Share (%), by End-user Industry 2024 & 2032
- Figure 16: North America APAC Payments Industry Revenue (Million), by Country 2024 & 2032
- Figure 17: North America APAC Payments Industry Revenue Share (%), by Country 2024 & 2032
- Figure 18: South America APAC Payments Industry Revenue (Million), by Mode of Payment 2024 & 2032
- Figure 19: South America APAC Payments Industry Revenue Share (%), by Mode of Payment 2024 & 2032
- Figure 20: South America APAC Payments Industry Revenue (Million), by End-user Industry 2024 & 2032
- Figure 21: South America APAC Payments Industry Revenue Share (%), by End-user Industry 2024 & 2032
- Figure 22: South America APAC Payments Industry Revenue (Million), by Country 2024 & 2032
- Figure 23: South America APAC Payments Industry Revenue Share (%), by Country 2024 & 2032
- Figure 24: Europe APAC Payments Industry Revenue (Million), by Mode of Payment 2024 & 2032
- Figure 25: Europe APAC Payments Industry Revenue Share (%), by Mode of Payment 2024 & 2032
- Figure 26: Europe APAC Payments Industry Revenue (Million), by End-user Industry 2024 & 2032
- Figure 27: Europe APAC Payments Industry Revenue Share (%), by End-user Industry 2024 & 2032
- Figure 28: Europe APAC Payments Industry Revenue (Million), by Country 2024 & 2032
- Figure 29: Europe APAC Payments Industry Revenue Share (%), by Country 2024 & 2032
- Figure 30: Middle East & Africa APAC Payments Industry Revenue (Million), by Mode of Payment 2024 & 2032
- Figure 31: Middle East & Africa APAC Payments Industry Revenue Share (%), by Mode of Payment 2024 & 2032
- Figure 32: Middle East & Africa APAC Payments Industry Revenue (Million), by End-user Industry 2024 & 2032
- Figure 33: Middle East & Africa APAC Payments Industry Revenue Share (%), by End-user Industry 2024 & 2032
- Figure 34: Middle East & Africa APAC Payments Industry Revenue (Million), by Country 2024 & 2032
- Figure 35: Middle East & Africa APAC Payments Industry Revenue Share (%), by Country 2024 & 2032
- Figure 36: Asia Pacific APAC Payments Industry Revenue (Million), by Mode of Payment 2024 & 2032
- Figure 37: Asia Pacific APAC Payments Industry Revenue Share (%), by Mode of Payment 2024 & 2032
- Figure 38: Asia Pacific APAC Payments Industry Revenue (Million), by End-user Industry 2024 & 2032
- Figure 39: Asia Pacific APAC Payments Industry Revenue Share (%), by End-user Industry 2024 & 2032
- Figure 40: Asia Pacific APAC Payments Industry Revenue (Million), by Country 2024 & 2032
- Figure 41: Asia Pacific APAC Payments Industry Revenue Share (%), by Country 2024 & 2032
List of Tables
- Table 1: Global APAC Payments Industry Revenue Million Forecast, by Region 2019 & 2032
- Table 2: Global APAC Payments Industry Revenue Million Forecast, by Mode of Payment 2019 & 2032
- Table 3: Global APAC Payments Industry Revenue Million Forecast, by End-user Industry 2019 & 2032
- Table 4: Global APAC Payments Industry Revenue Million Forecast, by Region 2019 & 2032
- Table 5: Global APAC Payments Industry Revenue Million Forecast, by Country 2019 & 2032
- Table 6: APAC Payments Industry Revenue (Million) Forecast, by Application 2019 & 2032
- Table 7: Global APAC Payments Industry Revenue Million Forecast, by Country 2019 & 2032
- Table 8: APAC Payments Industry Revenue (Million) Forecast, by Application 2019 & 2032
- Table 9: Global APAC Payments Industry Revenue Million Forecast, by Country 2019 & 2032
- Table 10: APAC Payments Industry Revenue (Million) Forecast, by Application 2019 & 2032
- Table 11: Global APAC Payments Industry Revenue Million Forecast, by Country 2019 & 2032
- Table 12: APAC Payments Industry Revenue (Million) Forecast, by Application 2019 & 2032
- Table 13: Global APAC Payments Industry Revenue Million Forecast, by Country 2019 & 2032
- Table 14: APAC Payments Industry Revenue (Million) Forecast, by Application 2019 & 2032
- Table 15: Global APAC Payments Industry Revenue Million Forecast, by Mode of Payment 2019 & 2032
- Table 16: Global APAC Payments Industry Revenue Million Forecast, by End-user Industry 2019 & 2032
- Table 17: Global APAC Payments Industry Revenue Million Forecast, by Country 2019 & 2032
- Table 18: United States APAC Payments Industry Revenue (Million) Forecast, by Application 2019 & 2032
- Table 19: Canada APAC Payments Industry Revenue (Million) Forecast, by Application 2019 & 2032
- Table 20: Mexico APAC Payments Industry Revenue (Million) Forecast, by Application 2019 & 2032
- Table 21: Global APAC Payments Industry Revenue Million Forecast, by Mode of Payment 2019 & 2032
- Table 22: Global APAC Payments Industry Revenue Million Forecast, by End-user Industry 2019 & 2032
- Table 23: Global APAC Payments Industry Revenue Million Forecast, by Country 2019 & 2032
- Table 24: Brazil APAC Payments Industry Revenue (Million) Forecast, by Application 2019 & 2032
- Table 25: Argentina APAC Payments Industry Revenue (Million) Forecast, by Application 2019 & 2032
- Table 26: Rest of South America APAC Payments Industry Revenue (Million) Forecast, by Application 2019 & 2032
- Table 27: Global APAC Payments Industry Revenue Million Forecast, by Mode of Payment 2019 & 2032
- Table 28: Global APAC Payments Industry Revenue Million Forecast, by End-user Industry 2019 & 2032
- Table 29: Global APAC Payments Industry Revenue Million Forecast, by Country 2019 & 2032
- Table 30: United Kingdom APAC Payments Industry Revenue (Million) Forecast, by Application 2019 & 2032
- Table 31: Germany APAC Payments Industry Revenue (Million) Forecast, by Application 2019 & 2032
- Table 32: France APAC Payments Industry Revenue (Million) Forecast, by Application 2019 & 2032
- Table 33: Italy APAC Payments Industry Revenue (Million) Forecast, by Application 2019 & 2032
- Table 34: Spain APAC Payments Industry Revenue (Million) Forecast, by Application 2019 & 2032
- Table 35: Russia APAC Payments Industry Revenue (Million) Forecast, by Application 2019 & 2032
- Table 36: Benelux APAC Payments Industry Revenue (Million) Forecast, by Application 2019 & 2032
- Table 37: Nordics APAC Payments Industry Revenue (Million) Forecast, by Application 2019 & 2032
- Table 38: Rest of Europe APAC Payments Industry Revenue (Million) Forecast, by Application 2019 & 2032
- Table 39: Global APAC Payments Industry Revenue Million Forecast, by Mode of Payment 2019 & 2032
- Table 40: Global APAC Payments Industry Revenue Million Forecast, by End-user Industry 2019 & 2032
- Table 41: Global APAC Payments Industry Revenue Million Forecast, by Country 2019 & 2032
- Table 42: Turkey APAC Payments Industry Revenue (Million) Forecast, by Application 2019 & 2032
- Table 43: Israel APAC Payments Industry Revenue (Million) Forecast, by Application 2019 & 2032
- Table 44: GCC APAC Payments Industry Revenue (Million) Forecast, by Application 2019 & 2032
- Table 45: North Africa APAC Payments Industry Revenue (Million) Forecast, by Application 2019 & 2032
- Table 46: South Africa APAC Payments Industry Revenue (Million) Forecast, by Application 2019 & 2032
- Table 47: Rest of Middle East & Africa APAC Payments Industry Revenue (Million) Forecast, by Application 2019 & 2032
- Table 48: Global APAC Payments Industry Revenue Million Forecast, by Mode of Payment 2019 & 2032
- Table 49: Global APAC Payments Industry Revenue Million Forecast, by End-user Industry 2019 & 2032
- Table 50: Global APAC Payments Industry Revenue Million Forecast, by Country 2019 & 2032
- Table 51: China APAC Payments Industry Revenue (Million) Forecast, by Application 2019 & 2032
- Table 52: India APAC Payments Industry Revenue (Million) Forecast, by Application 2019 & 2032
- Table 53: Japan APAC Payments Industry Revenue (Million) Forecast, by Application 2019 & 2032
- Table 54: South Korea APAC Payments Industry Revenue (Million) Forecast, by Application 2019 & 2032
- Table 55: ASEAN APAC Payments Industry Revenue (Million) Forecast, by Application 2019 & 2032
- Table 56: Oceania APAC Payments Industry Revenue (Million) Forecast, by Application 2019 & 2032
- Table 57: Rest of Asia Pacific APAC Payments Industry Revenue (Million) Forecast, by Application 2019 & 2032
Frequently Asked Questions
1. What is the projected Compound Annual Growth Rate (CAGR) of the APAC Payments Industry?
The projected CAGR is approximately 13.32%.
2. Which companies are prominent players in the APAC Payments Industry?
Key companies in the market include Ipay88 (m) Sdn Bhd, Visa Inc, Naver Corporation (Naver Pay), JCB Co Ltd, Samsung (Samsung Pay), Huawei Pay (Huawei Technologies Co Limited*List Not Exhaustive, Matercard Inc, Smile Pay, Toss Financial Services Private Limited, American Express Company, Grab Pay (grab Holdings Limited), Samsung Pay (Samsung Electronics Co ltd), PayCo (NHN Corp ), Paypal Holdings Inc, Google Pay (Alphabet Inc ), kakaopay Corp.
3. What are the main segments of the APAC Payments Industry?
The market segments include Mode of Payment, End-user Industry.
4. Can you provide details about the market size?
The market size is estimated to be USD 13.93 Million as of 2022.
5. What are some drivers contributing to market growth?
High Proliferation of E-commerce and Rising Adoption of M-commerce; Enablement Programs by Key Retailers and Government Encouraging Digitization of the Market; Growing Adoption of Buy Now Pay Later in Asia-Pacific Countries.
6. What are the notable trends driving market growth?
Online sales segment to show higher growth.
7. Are there any restraints impacting market growth?
High Implementation and Maintenance Cost.
8. Can you provide examples of recent developments in the market?
October 2023, According to a statement made by the National Payments Corporation of India (NPCI), six Indian banks contributing to the arrangement are Indian Bank, Axis Bank, Bank, DBS Bank India, ICICI Indian Overseas Bank, as well as State Bank of India. India and Singapore are all set to increase the range of their digital payment link after they proclaimed the milestone linkage between India’s Unified Payments Interface (UPI) in addition to Singapore’s PayNow.
9. What pricing options are available for accessing the report?
Pricing options include single-user, multi-user, and enterprise licenses priced at USD 4750, USD 4950, and USD 6800 respectively.
10. Is the market size provided in terms of value or volume?
The market size is provided in terms of value, measured in Million.
11. Are there any specific market keywords associated with the report?
Yes, the market keyword associated with the report is "APAC Payments Industry," which aids in identifying and referencing the specific market segment covered.
12. How do I determine which pricing option suits my needs best?
The pricing options vary based on user requirements and access needs. Individual users may opt for single-user licenses, while businesses requiring broader access may choose multi-user or enterprise licenses for cost-effective access to the report.
13. Are there any additional resources or data provided in the APAC Payments Industry report?
While the report offers comprehensive insights, it's advisable to review the specific contents or supplementary materials provided to ascertain if additional resources or data are available.
14. How can I stay updated on further developments or reports in the APAC Payments Industry?
To stay informed about further developments, trends, and reports in the APAC Payments Industry, consider subscribing to industry newsletters, following relevant companies and organizations, or regularly checking reputable industry news sources and publications.
Methodology
Step 1 - Identification of Relevant Samples Size from Population Database


Step 2 - Approaches for Defining Global Market Size (Value, Volume* & Price*)

Note*: In applicable scenarios
Step 3 - Data Sources
Primary Research
- Web Analytics
- Survey Reports
- Research Institute
- Latest Research Reports
- Opinion Leaders
Secondary Research
- Annual Reports
- White Paper
- Latest Press Release
- Industry Association
- Paid Database
- Investor Presentations

Step 4 - Data Triangulation
Involves using different sources of information in order to increase the validity of a study
These sources are likely to be stakeholders in a program - participants, other researchers, program staff, other community members, and so on.
Then we put all data in single framework & apply various statistical tools to find out the dynamic on the market.
During the analysis stage, feedback from the stakeholder groups would be compared to determine areas of agreement as well as areas of divergence
