

Key Insights
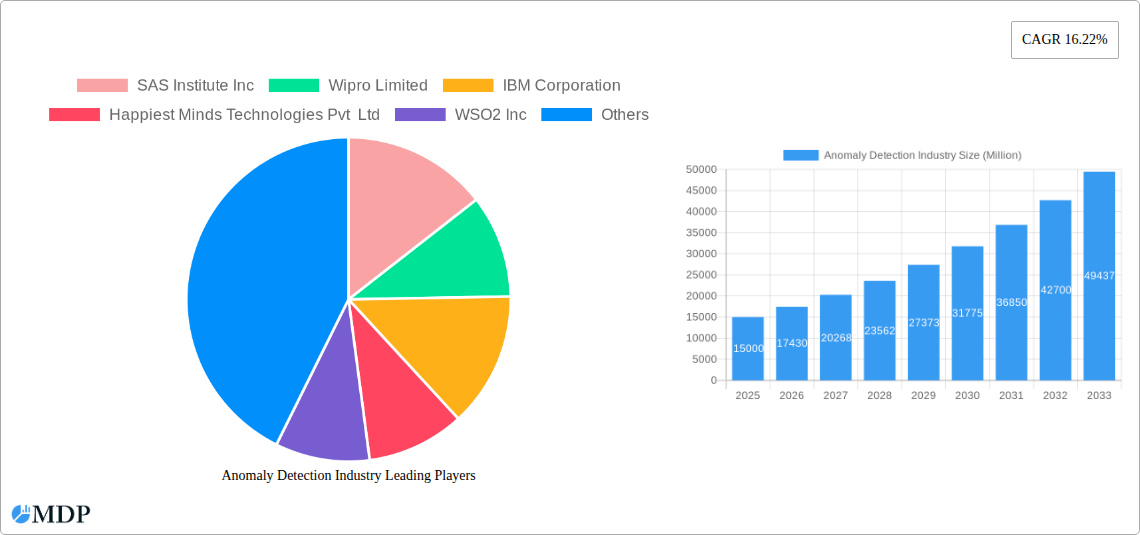
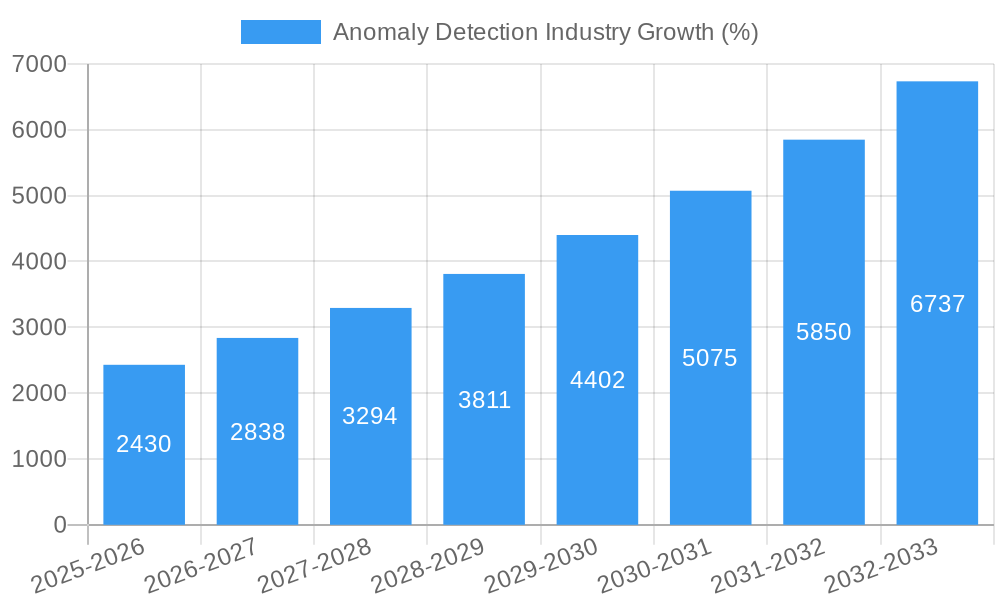
The anomaly detection market is experiencing robust growth, driven by the increasing need for robust cybersecurity measures and the proliferation of data across various industries. With a Compound Annual Growth Rate (CAGR) of 16.22% from 2019 to 2024, the market is projected to reach a substantial value. Key drivers include the rising incidence of cyberattacks, the expanding adoption of cloud computing (increasing the attack surface), and the growing need for real-time threat detection across diverse sectors like BFSI, manufacturing, and healthcare. The market is segmented by type (solutions and services), end-user industry (BFSI, Manufacturing, Healthcare, IT & Telecommunications, and Others), and deployment (on-premise and cloud). The cloud deployment segment is expected to dominate due to its scalability, cost-effectiveness, and ease of access. Furthermore, increasing regulatory compliance requirements across industries are fueling the demand for sophisticated anomaly detection systems to ensure data integrity and prevent financial losses. Leading players like SAS Institute, IBM, and Microsoft are investing heavily in research and development, contributing to market innovation through advanced machine learning algorithms and AI-powered solutions. The competitive landscape is characterized by both established players and emerging technology providers, fostering innovation and driving down costs.
The continued growth of the anomaly detection market is projected through 2033, with the cloud-based solutions segment anticipated to maintain its lead. The increasing volume and complexity of data generated by various sectors necessitate advanced analytics capabilities. Therefore, the demand for sophisticated anomaly detection solutions capable of handling big data and providing actionable insights will fuel further market expansion. While challenges exist, including the need for skilled professionals and the complexities of integrating with existing systems, the overall market outlook remains overwhelmingly positive, driven by the inherent need for improved security and operational efficiency across all industries. Expansion into emerging markets and the development of more specialized solutions catering to industry-specific needs will further contribute to future growth.
Anomaly Detection Market Report: A Comprehensive Analysis (2019-2033)
This comprehensive report provides an in-depth analysis of the Anomaly Detection market, projecting a market value of $XX Million by 2033. The study covers the period from 2019 to 2033, with a base year of 2025 and a forecast period spanning 2025-2033. It delves into market dynamics, leading players, key trends, and future opportunities, providing actionable insights for stakeholders across the industry. This report is invaluable for investors, businesses, and researchers seeking a deep understanding of this rapidly evolving market. High-impact keywords include: Anomaly Detection, Market Analysis, AI, Machine Learning, Cybersecurity, BFSI, Cloud Computing, Market Growth, Market Forecast.
Anomaly Detection Industry Market Dynamics & Concentration
The Anomaly Detection market is experiencing significant growth, driven by increasing adoption of AI and machine learning across various sectors. Market concentration is moderately high, with a few major players holding significant market share. However, the presence of numerous smaller niche players indicates a competitive landscape. The market is influenced by several factors, including:
- Innovation Drivers: Advancements in AI/ML algorithms, big data analytics, and cloud computing are key innovation drivers, constantly pushing the boundaries of anomaly detection capabilities.
- Regulatory Frameworks: Growing data privacy regulations like GDPR and CCPA are influencing the development and adoption of secure and compliant anomaly detection solutions.
- Product Substitutes: Traditional security solutions and manual monitoring processes are being gradually replaced by more efficient and automated anomaly detection systems.
- End-User Trends: The increasing need for real-time threat detection and proactive security measures across diverse industries drives market growth. Businesses are moving towards predictive analytics to mitigate risks and improve operational efficiency.
- M&A Activities: The market has witnessed a moderate number of mergers and acquisitions (XX deals in the last five years), indicating consolidation amongst key players and a focus on expanding capabilities and market reach. Major players such as SAS Institute Inc are actively involved in strategic acquisitions. Estimated market share for SAS Institute Inc is xx%.
Anomaly Detection Industry Industry Trends & Analysis
The Anomaly Detection market exhibits a robust Compound Annual Growth Rate (CAGR) of XX% during the forecast period (2025-2033). This growth is fueled by several key factors:
- Technological Disruptions: The rise of AI, ML, and deep learning is revolutionizing anomaly detection techniques, enabling more accurate and faster detection of anomalies. The increasing availability of advanced analytics tools is driving market penetration.
- Market Growth Drivers: The rising adoption of cloud-based solutions, increasing cybersecurity concerns across industries (particularly BFSI and Healthcare), and the growing need for predictive analytics are primary drivers for growth. Market penetration for cloud-based solutions is estimated at xx%.
- Consumer Preferences: Businesses increasingly prefer automated, real-time anomaly detection systems that minimize manual intervention and improve operational efficiency. There is a shift from reactive to proactive security measures.
- Competitive Dynamics: The market is witnessing intense competition among established players and emerging startups, driving innovation and affordability. Price wars and strategic partnerships are common tactics used to gain market share.
Leading Markets & Segments in Anomaly Detection Industry
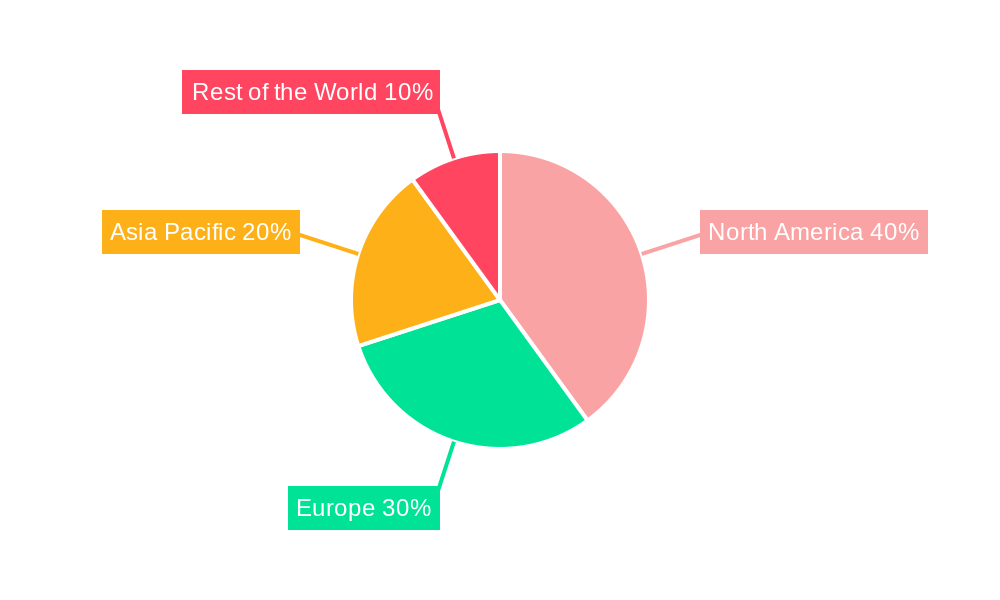
The North American region currently dominates the Anomaly Detection market, driven by strong technological advancements, high cybersecurity spending, and a large pool of data-rich industries. However, the Asia-Pacific region is projected to experience significant growth in the coming years, fueled by increasing digitalization and expanding IT infrastructure.
Key Drivers by Segment:
- By Type: The Solutions segment currently holds a larger market share than the Service segment, driven by the increasing demand for comprehensive software solutions that integrate with existing infrastructure.
- By End-user Industry: The BFSI sector dominates the market, due to its high reliance on data security and the significant financial implications of fraud and security breaches. Other significant segments include Healthcare and IT & Telecommunications.
- By Deployment: The Cloud segment is experiencing rapid growth, driven by its scalability, cost-effectiveness, and accessibility.
Dominance Analysis: The BFSI sector’s dominance stems from stringent regulatory compliance requirements and the high cost associated with data breaches. The cloud deployment model is gaining traction due to its flexibility and reduced infrastructure costs.
Anomaly Detection Industry Product Developments
Recent product innovations in anomaly detection focus on enhancing accuracy, speed, and scalability. Advancements in AI and ML algorithms are leading to the development of more sophisticated solutions capable of detecting complex anomalies in real-time. New solutions incorporate advanced visualization dashboards, enabling easier interpretation of results and effective threat management. This focus on user-friendliness improves market adoption rates.
Key Drivers of Anomaly Detection Industry Growth
Several factors contribute to the growth of the anomaly detection industry. Technological advancements in AI and machine learning are paramount, offering more accurate and efficient anomaly detection capabilities. The increasing volume of data generated across various industries necessitates robust anomaly detection systems. Stringent data privacy regulations further fuel the demand for secure and compliant solutions. Lastly, the growing awareness of cybersecurity threats and the need for proactive security measures are driving market growth across numerous sectors.
Challenges in the Anomaly Detection Industry Market
The Anomaly Detection market faces several challenges including the complexity of integrating solutions with existing legacy systems, potential skill gaps in deploying and managing sophisticated AI/ML-based systems, and the high cost of implementing advanced anomaly detection solutions. Data silos within organizations can also hinder effective implementation and the need for robust data governance presents a further hurdle. The market faces strong competition, impacting margins.
Emerging Opportunities in Anomaly Detection Industry
The Anomaly Detection market presents significant long-term opportunities. The convergence of AI/ML with IoT (Internet of Things) data is creating new avenues for anomaly detection in diverse sectors. Strategic partnerships between technology providers and industry experts are leading to the development of specialized and highly effective solutions. Expanding market penetration into emerging economies, particularly in Asia-Pacific, presents a substantial opportunity for growth. Furthermore, advancements in quantum computing may unlock even more powerful anomaly detection capabilities in the future.
Leading Players in the Anomaly Detection Industry Sector
- SAS Institute Inc
- Wipro Limited
- IBM Corporation
- Happiest Minds Technologies Pvt Ltd
- WSO2 Inc
- Cisco Systems Inc
- Microsoft Corporation
- Trend Micro Incorporated
- Verint Systems Inc
- Guardian Analytics Inc
- Broadcom Inc (Symantec Corporation)
Key Milestones in Anomaly Detection Industry Industry
- June 2023: Wipro launched a new suite of banking financial services built on Microsoft Cloud, leveraging combined expertise to accelerate growth for financial services clients. This partnership significantly strengthens Wipro's position in the BFSI sector and demonstrates the increasing collaboration between leading technology firms.
- June 2023: Cisco announced its AI-driven Cisco Security Cloud, simplifying cybersecurity and enhancing workforce productivity. This launch showcases the growing importance of AI in strengthening security infrastructure, directly impacting the market landscape.
Strategic Outlook for Anomaly Detection Industry Market
The future of the Anomaly Detection market is promising. Continued technological advancements in AI and ML will drive further innovation. Strategic partnerships and acquisitions will reshape the competitive landscape. Growing adoption across various sectors, particularly in emerging markets, will fuel market expansion. The increasing focus on proactive security measures and risk mitigation will solidify the long-term growth trajectory of the Anomaly Detection market. The market is poised for sustained growth, driven by the ever-increasing need for robust security solutions in a data-driven world.
Anomaly Detection Industry Segmentation
-
1. Type
- 1.1. Solutions
- 1.2. Service
-
2. End-user Industry
- 2.1. BFSI
- 2.2. Manufacturing
- 2.3. Healthcare
- 2.4. IT and Telecommunications
- 2.5. Other End-user Industries
-
3. Deployment
- 3.1. On-premise
- 3.2. Cloud
Anomaly Detection Industry Segmentation By Geography
-
1. North America
- 1.1. United States
- 1.2. Canada
-
2. Europe
- 2.1. United Kingdom
- 2.2. Germany
- 2.3. France
-
3. Asia
- 3.1. Australia
- 3.2. Japan
- 3.3. India
- 4. Latin America
- 5. Middle East and Africa
Anomaly Detection Industry REPORT HIGHLIGHTS
| Aspects | Details |
|---|---|
| Study Period | 2019-2033 |
| Base Year | 2024 |
| Estimated Year | 2025 |
| Forecast Period | 2025-2033 |
| Historical Period | 2019-2024 |
| Growth Rate | CAGR of 16.22% from 2019-2033 |
| Segmentation |
|
Table of Contents
- 1. Introduction
- 1.1. Research Scope
- 1.2. Market Segmentation
- 1.3. Research Methodology
- 1.4. Definitions and Assumptions
- 2. Executive Summary
- 2.1. Introduction
- 3. Market Dynamics
- 3.1. Introduction
- 3.2. Market Drivers
- 3.2.1. Increasing Number of Cyber Crimes; Increasing Adoption of Anomaly Detection Solutions in Software Testing
- 3.3. Market Restrains
- 3.3.1. Open Source Alternatives Pose as a Threat
- 3.4. Market Trends
- 3.4.1. BFSI is Expected to Hold a Significant Part of the Market Share
- 4. Market Factor Analysis
- 4.1. Porters Five Forces
- 4.2. Supply/Value Chain
- 4.3. PESTEL analysis
- 4.4. Market Entropy
- 4.5. Patent/Trademark Analysis
- 5. Global Anomaly Detection Industry Analysis, Insights and Forecast, 2019-2031
- 5.1. Market Analysis, Insights and Forecast - by Type
- 5.1.1. Solutions
- 5.1.2. Service
- 5.2. Market Analysis, Insights and Forecast - by End-user Industry
- 5.2.1. BFSI
- 5.2.2. Manufacturing
- 5.2.3. Healthcare
- 5.2.4. IT and Telecommunications
- 5.2.5. Other End-user Industries
- 5.3. Market Analysis, Insights and Forecast - by Deployment
- 5.3.1. On-premise
- 5.3.2. Cloud
- 5.4. Market Analysis, Insights and Forecast - by Region
- 5.4.1. North America
- 5.4.2. Europe
- 5.4.3. Asia
- 5.4.4. Latin America
- 5.4.5. Middle East and Africa
- 5.1. Market Analysis, Insights and Forecast - by Type
- 6. North America Anomaly Detection Industry Analysis, Insights and Forecast, 2019-2031
- 6.1. Market Analysis, Insights and Forecast - by Type
- 6.1.1. Solutions
- 6.1.2. Service
- 6.2. Market Analysis, Insights and Forecast - by End-user Industry
- 6.2.1. BFSI
- 6.2.2. Manufacturing
- 6.2.3. Healthcare
- 6.2.4. IT and Telecommunications
- 6.2.5. Other End-user Industries
- 6.3. Market Analysis, Insights and Forecast - by Deployment
- 6.3.1. On-premise
- 6.3.2. Cloud
- 6.1. Market Analysis, Insights and Forecast - by Type
- 7. Europe Anomaly Detection Industry Analysis, Insights and Forecast, 2019-2031
- 7.1. Market Analysis, Insights and Forecast - by Type
- 7.1.1. Solutions
- 7.1.2. Service
- 7.2. Market Analysis, Insights and Forecast - by End-user Industry
- 7.2.1. BFSI
- 7.2.2. Manufacturing
- 7.2.3. Healthcare
- 7.2.4. IT and Telecommunications
- 7.2.5. Other End-user Industries
- 7.3. Market Analysis, Insights and Forecast - by Deployment
- 7.3.1. On-premise
- 7.3.2. Cloud
- 7.1. Market Analysis, Insights and Forecast - by Type
- 8. Asia Anomaly Detection Industry Analysis, Insights and Forecast, 2019-2031
- 8.1. Market Analysis, Insights and Forecast - by Type
- 8.1.1. Solutions
- 8.1.2. Service
- 8.2. Market Analysis, Insights and Forecast - by End-user Industry
- 8.2.1. BFSI
- 8.2.2. Manufacturing
- 8.2.3. Healthcare
- 8.2.4. IT and Telecommunications
- 8.2.5. Other End-user Industries
- 8.3. Market Analysis, Insights and Forecast - by Deployment
- 8.3.1. On-premise
- 8.3.2. Cloud
- 8.1. Market Analysis, Insights and Forecast - by Type
- 9. Latin America Anomaly Detection Industry Analysis, Insights and Forecast, 2019-2031
- 9.1. Market Analysis, Insights and Forecast - by Type
- 9.1.1. Solutions
- 9.1.2. Service
- 9.2. Market Analysis, Insights and Forecast - by End-user Industry
- 9.2.1. BFSI
- 9.2.2. Manufacturing
- 9.2.3. Healthcare
- 9.2.4. IT and Telecommunications
- 9.2.5. Other End-user Industries
- 9.3. Market Analysis, Insights and Forecast - by Deployment
- 9.3.1. On-premise
- 9.3.2. Cloud
- 9.1. Market Analysis, Insights and Forecast - by Type
- 10. Middle East and Africa Anomaly Detection Industry Analysis, Insights and Forecast, 2019-2031
- 10.1. Market Analysis, Insights and Forecast - by Type
- 10.1.1. Solutions
- 10.1.2. Service
- 10.2. Market Analysis, Insights and Forecast - by End-user Industry
- 10.2.1. BFSI
- 10.2.2. Manufacturing
- 10.2.3. Healthcare
- 10.2.4. IT and Telecommunications
- 10.2.5. Other End-user Industries
- 10.3. Market Analysis, Insights and Forecast - by Deployment
- 10.3.1. On-premise
- 10.3.2. Cloud
- 10.1. Market Analysis, Insights and Forecast - by Type
- 11. North America Anomaly Detection Industry Analysis, Insights and Forecast, 2019-2031
- 11.1. Market Analysis, Insights and Forecast - By Country/Sub-region
- 11.1.1 United States
- 11.1.2 Canada
- 12. Europe Anomaly Detection Industry Analysis, Insights and Forecast, 2019-2031
- 12.1. Market Analysis, Insights and Forecast - By Country/Sub-region
- 12.1.1 United Kingdom
- 12.1.2 Germany
- 12.1.3 France
- 12.1.4 Rest of Europe
- 13. Asia Pacific Anomaly Detection Industry Analysis, Insights and Forecast, 2019-2031
- 13.1. Market Analysis, Insights and Forecast - By Country/Sub-region
- 13.1.1 Australia
- 13.1.2 Japan
- 13.1.3 India
- 13.1.4 Rest of Asia Pacific
- 14. Rest of the World Anomaly Detection Industry Analysis, Insights and Forecast, 2019-2031
- 14.1. Market Analysis, Insights and Forecast - By Country/Sub-region
- 14.1.1.
- 15. Competitive Analysis
- 15.1. Global Market Share Analysis 2024
- 15.2. Company Profiles
- 15.2.1 SAS Institute Inc
- 15.2.1.1. Overview
- 15.2.1.2. Products
- 15.2.1.3. SWOT Analysis
- 15.2.1.4. Recent Developments
- 15.2.1.5. Financials (Based on Availability)
- 15.2.2 Wipro Limited
- 15.2.2.1. Overview
- 15.2.2.2. Products
- 15.2.2.3. SWOT Analysis
- 15.2.2.4. Recent Developments
- 15.2.2.5. Financials (Based on Availability)
- 15.2.3 IBM Corporation
- 15.2.3.1. Overview
- 15.2.3.2. Products
- 15.2.3.3. SWOT Analysis
- 15.2.3.4. Recent Developments
- 15.2.3.5. Financials (Based on Availability)
- 15.2.4 Happiest Minds Technologies Pvt Ltd
- 15.2.4.1. Overview
- 15.2.4.2. Products
- 15.2.4.3. SWOT Analysis
- 15.2.4.4. Recent Developments
- 15.2.4.5. Financials (Based on Availability)
- 15.2.5 WSO2 Inc
- 15.2.5.1. Overview
- 15.2.5.2. Products
- 15.2.5.3. SWOT Analysis
- 15.2.5.4. Recent Developments
- 15.2.5.5. Financials (Based on Availability)
- 15.2.6 Cisco Systems Inc
- 15.2.6.1. Overview
- 15.2.6.2. Products
- 15.2.6.3. SWOT Analysis
- 15.2.6.4. Recent Developments
- 15.2.6.5. Financials (Based on Availability)
- 15.2.7 Microsoft Corporation
- 15.2.7.1. Overview
- 15.2.7.2. Products
- 15.2.7.3. SWOT Analysis
- 15.2.7.4. Recent Developments
- 15.2.7.5. Financials (Based on Availability)
- 15.2.8 Trend Micro Incorporated
- 15.2.8.1. Overview
- 15.2.8.2. Products
- 15.2.8.3. SWOT Analysis
- 15.2.8.4. Recent Developments
- 15.2.8.5. Financials (Based on Availability)
- 15.2.9 Verint Systems Inc
- 15.2.9.1. Overview
- 15.2.9.2. Products
- 15.2.9.3. SWOT Analysis
- 15.2.9.4. Recent Developments
- 15.2.9.5. Financials (Based on Availability)
- 15.2.10 Guardian Analytics Inc *List Not Exhaustive
- 15.2.10.1. Overview
- 15.2.10.2. Products
- 15.2.10.3. SWOT Analysis
- 15.2.10.4. Recent Developments
- 15.2.10.5. Financials (Based on Availability)
- 15.2.11 Broadcom Inc (Symantec Corporation)
- 15.2.11.1. Overview
- 15.2.11.2. Products
- 15.2.11.3. SWOT Analysis
- 15.2.11.4. Recent Developments
- 15.2.11.5. Financials (Based on Availability)
- 15.2.1 SAS Institute Inc
List of Figures
- Figure 1: Global Anomaly Detection Industry Revenue Breakdown (Million, %) by Region 2024 & 2032
- Figure 2: North America Anomaly Detection Industry Revenue (Million), by Country 2024 & 2032
- Figure 3: North America Anomaly Detection Industry Revenue Share (%), by Country 2024 & 2032
- Figure 4: Europe Anomaly Detection Industry Revenue (Million), by Country 2024 & 2032
- Figure 5: Europe Anomaly Detection Industry Revenue Share (%), by Country 2024 & 2032
- Figure 6: Asia Pacific Anomaly Detection Industry Revenue (Million), by Country 2024 & 2032
- Figure 7: Asia Pacific Anomaly Detection Industry Revenue Share (%), by Country 2024 & 2032
- Figure 8: Rest of the World Anomaly Detection Industry Revenue (Million), by Country 2024 & 2032
- Figure 9: Rest of the World Anomaly Detection Industry Revenue Share (%), by Country 2024 & 2032
- Figure 10: North America Anomaly Detection Industry Revenue (Million), by Type 2024 & 2032
- Figure 11: North America Anomaly Detection Industry Revenue Share (%), by Type 2024 & 2032
- Figure 12: North America Anomaly Detection Industry Revenue (Million), by End-user Industry 2024 & 2032
- Figure 13: North America Anomaly Detection Industry Revenue Share (%), by End-user Industry 2024 & 2032
- Figure 14: North America Anomaly Detection Industry Revenue (Million), by Deployment 2024 & 2032
- Figure 15: North America Anomaly Detection Industry Revenue Share (%), by Deployment 2024 & 2032
- Figure 16: North America Anomaly Detection Industry Revenue (Million), by Country 2024 & 2032
- Figure 17: North America Anomaly Detection Industry Revenue Share (%), by Country 2024 & 2032
- Figure 18: Europe Anomaly Detection Industry Revenue (Million), by Type 2024 & 2032
- Figure 19: Europe Anomaly Detection Industry Revenue Share (%), by Type 2024 & 2032
- Figure 20: Europe Anomaly Detection Industry Revenue (Million), by End-user Industry 2024 & 2032
- Figure 21: Europe Anomaly Detection Industry Revenue Share (%), by End-user Industry 2024 & 2032
- Figure 22: Europe Anomaly Detection Industry Revenue (Million), by Deployment 2024 & 2032
- Figure 23: Europe Anomaly Detection Industry Revenue Share (%), by Deployment 2024 & 2032
- Figure 24: Europe Anomaly Detection Industry Revenue (Million), by Country 2024 & 2032
- Figure 25: Europe Anomaly Detection Industry Revenue Share (%), by Country 2024 & 2032
- Figure 26: Asia Anomaly Detection Industry Revenue (Million), by Type 2024 & 2032
- Figure 27: Asia Anomaly Detection Industry Revenue Share (%), by Type 2024 & 2032
- Figure 28: Asia Anomaly Detection Industry Revenue (Million), by End-user Industry 2024 & 2032
- Figure 29: Asia Anomaly Detection Industry Revenue Share (%), by End-user Industry 2024 & 2032
- Figure 30: Asia Anomaly Detection Industry Revenue (Million), by Deployment 2024 & 2032
- Figure 31: Asia Anomaly Detection Industry Revenue Share (%), by Deployment 2024 & 2032
- Figure 32: Asia Anomaly Detection Industry Revenue (Million), by Country 2024 & 2032
- Figure 33: Asia Anomaly Detection Industry Revenue Share (%), by Country 2024 & 2032
- Figure 34: Latin America Anomaly Detection Industry Revenue (Million), by Type 2024 & 2032
- Figure 35: Latin America Anomaly Detection Industry Revenue Share (%), by Type 2024 & 2032
- Figure 36: Latin America Anomaly Detection Industry Revenue (Million), by End-user Industry 2024 & 2032
- Figure 37: Latin America Anomaly Detection Industry Revenue Share (%), by End-user Industry 2024 & 2032
- Figure 38: Latin America Anomaly Detection Industry Revenue (Million), by Deployment 2024 & 2032
- Figure 39: Latin America Anomaly Detection Industry Revenue Share (%), by Deployment 2024 & 2032
- Figure 40: Latin America Anomaly Detection Industry Revenue (Million), by Country 2024 & 2032
- Figure 41: Latin America Anomaly Detection Industry Revenue Share (%), by Country 2024 & 2032
- Figure 42: Middle East and Africa Anomaly Detection Industry Revenue (Million), by Type 2024 & 2032
- Figure 43: Middle East and Africa Anomaly Detection Industry Revenue Share (%), by Type 2024 & 2032
- Figure 44: Middle East and Africa Anomaly Detection Industry Revenue (Million), by End-user Industry 2024 & 2032
- Figure 45: Middle East and Africa Anomaly Detection Industry Revenue Share (%), by End-user Industry 2024 & 2032
- Figure 46: Middle East and Africa Anomaly Detection Industry Revenue (Million), by Deployment 2024 & 2032
- Figure 47: Middle East and Africa Anomaly Detection Industry Revenue Share (%), by Deployment 2024 & 2032
- Figure 48: Middle East and Africa Anomaly Detection Industry Revenue (Million), by Country 2024 & 2032
- Figure 49: Middle East and Africa Anomaly Detection Industry Revenue Share (%), by Country 2024 & 2032
List of Tables
- Table 1: Global Anomaly Detection Industry Revenue Million Forecast, by Region 2019 & 2032
- Table 2: Global Anomaly Detection Industry Revenue Million Forecast, by Type 2019 & 2032
- Table 3: Global Anomaly Detection Industry Revenue Million Forecast, by End-user Industry 2019 & 2032
- Table 4: Global Anomaly Detection Industry Revenue Million Forecast, by Deployment 2019 & 2032
- Table 5: Global Anomaly Detection Industry Revenue Million Forecast, by Region 2019 & 2032
- Table 6: Global Anomaly Detection Industry Revenue Million Forecast, by Country 2019 & 2032
- Table 7: United States Anomaly Detection Industry Revenue (Million) Forecast, by Application 2019 & 2032
- Table 8: Canada Anomaly Detection Industry Revenue (Million) Forecast, by Application 2019 & 2032
- Table 9: Global Anomaly Detection Industry Revenue Million Forecast, by Country 2019 & 2032
- Table 10: United Kingdom Anomaly Detection Industry Revenue (Million) Forecast, by Application 2019 & 2032
- Table 11: Germany Anomaly Detection Industry Revenue (Million) Forecast, by Application 2019 & 2032
- Table 12: France Anomaly Detection Industry Revenue (Million) Forecast, by Application 2019 & 2032
- Table 13: Rest of Europe Anomaly Detection Industry Revenue (Million) Forecast, by Application 2019 & 2032
- Table 14: Global Anomaly Detection Industry Revenue Million Forecast, by Country 2019 & 2032
- Table 15: Australia Anomaly Detection Industry Revenue (Million) Forecast, by Application 2019 & 2032
- Table 16: Japan Anomaly Detection Industry Revenue (Million) Forecast, by Application 2019 & 2032
- Table 17: India Anomaly Detection Industry Revenue (Million) Forecast, by Application 2019 & 2032
- Table 18: Rest of Asia Pacific Anomaly Detection Industry Revenue (Million) Forecast, by Application 2019 & 2032
- Table 19: Global Anomaly Detection Industry Revenue Million Forecast, by Country 2019 & 2032
- Table 20: Anomaly Detection Industry Revenue (Million) Forecast, by Application 2019 & 2032
- Table 21: Global Anomaly Detection Industry Revenue Million Forecast, by Type 2019 & 2032
- Table 22: Global Anomaly Detection Industry Revenue Million Forecast, by End-user Industry 2019 & 2032
- Table 23: Global Anomaly Detection Industry Revenue Million Forecast, by Deployment 2019 & 2032
- Table 24: Global Anomaly Detection Industry Revenue Million Forecast, by Country 2019 & 2032
- Table 25: United States Anomaly Detection Industry Revenue (Million) Forecast, by Application 2019 & 2032
- Table 26: Canada Anomaly Detection Industry Revenue (Million) Forecast, by Application 2019 & 2032
- Table 27: Global Anomaly Detection Industry Revenue Million Forecast, by Type 2019 & 2032
- Table 28: Global Anomaly Detection Industry Revenue Million Forecast, by End-user Industry 2019 & 2032
- Table 29: Global Anomaly Detection Industry Revenue Million Forecast, by Deployment 2019 & 2032
- Table 30: Global Anomaly Detection Industry Revenue Million Forecast, by Country 2019 & 2032
- Table 31: United Kingdom Anomaly Detection Industry Revenue (Million) Forecast, by Application 2019 & 2032
- Table 32: Germany Anomaly Detection Industry Revenue (Million) Forecast, by Application 2019 & 2032
- Table 33: France Anomaly Detection Industry Revenue (Million) Forecast, by Application 2019 & 2032
- Table 34: Global Anomaly Detection Industry Revenue Million Forecast, by Type 2019 & 2032
- Table 35: Global Anomaly Detection Industry Revenue Million Forecast, by End-user Industry 2019 & 2032
- Table 36: Global Anomaly Detection Industry Revenue Million Forecast, by Deployment 2019 & 2032
- Table 37: Global Anomaly Detection Industry Revenue Million Forecast, by Country 2019 & 2032
- Table 38: Australia Anomaly Detection Industry Revenue (Million) Forecast, by Application 2019 & 2032
- Table 39: Japan Anomaly Detection Industry Revenue (Million) Forecast, by Application 2019 & 2032
- Table 40: India Anomaly Detection Industry Revenue (Million) Forecast, by Application 2019 & 2032
- Table 41: Global Anomaly Detection Industry Revenue Million Forecast, by Type 2019 & 2032
- Table 42: Global Anomaly Detection Industry Revenue Million Forecast, by End-user Industry 2019 & 2032
- Table 43: Global Anomaly Detection Industry Revenue Million Forecast, by Deployment 2019 & 2032
- Table 44: Global Anomaly Detection Industry Revenue Million Forecast, by Country 2019 & 2032
- Table 45: Global Anomaly Detection Industry Revenue Million Forecast, by Type 2019 & 2032
- Table 46: Global Anomaly Detection Industry Revenue Million Forecast, by End-user Industry 2019 & 2032
- Table 47: Global Anomaly Detection Industry Revenue Million Forecast, by Deployment 2019 & 2032
- Table 48: Global Anomaly Detection Industry Revenue Million Forecast, by Country 2019 & 2032
Frequently Asked Questions
1. What is the projected Compound Annual Growth Rate (CAGR) of the Anomaly Detection Industry?
The projected CAGR is approximately 16.22%.
2. Which companies are prominent players in the Anomaly Detection Industry?
Key companies in the market include SAS Institute Inc, Wipro Limited, IBM Corporation, Happiest Minds Technologies Pvt Ltd, WSO2 Inc, Cisco Systems Inc, Microsoft Corporation, Trend Micro Incorporated, Verint Systems Inc, Guardian Analytics Inc *List Not Exhaustive, Broadcom Inc (Symantec Corporation).
3. What are the main segments of the Anomaly Detection Industry?
The market segments include Type, End-user Industry, Deployment.
4. Can you provide details about the market size?
The market size is estimated to be USD XX Million as of 2022.
5. What are some drivers contributing to market growth?
Increasing Number of Cyber Crimes; Increasing Adoption of Anomaly Detection Solutions in Software Testing.
6. What are the notable trends driving market growth?
BFSI is Expected to Hold a Significant Part of the Market Share.
7. Are there any restraints impacting market growth?
Open Source Alternatives Pose as a Threat.
8. Can you provide examples of recent developments in the market?
June 2023: Wipro has launched a new suite of banking financial services built on Microsoft Cloud; the partnership will combine Microsoft Cloud capabilities with Wipro FullStride Cloud and leverage Wipro's and Capco's deep domain expertise in financial services. And develop new solutions to help financial services clients accelerate growth and deepen client relationships.
9. What pricing options are available for accessing the report?
Pricing options include single-user, multi-user, and enterprise licenses priced at USD 4750, USD 5250, and USD 8750 respectively.
10. Is the market size provided in terms of value or volume?
The market size is provided in terms of value, measured in Million.
11. Are there any specific market keywords associated with the report?
Yes, the market keyword associated with the report is "Anomaly Detection Industry," which aids in identifying and referencing the specific market segment covered.
12. How do I determine which pricing option suits my needs best?
The pricing options vary based on user requirements and access needs. Individual users may opt for single-user licenses, while businesses requiring broader access may choose multi-user or enterprise licenses for cost-effective access to the report.
13. Are there any additional resources or data provided in the Anomaly Detection Industry report?
While the report offers comprehensive insights, it's advisable to review the specific contents or supplementary materials provided to ascertain if additional resources or data are available.
14. How can I stay updated on further developments or reports in the Anomaly Detection Industry?
To stay informed about further developments, trends, and reports in the Anomaly Detection Industry, consider subscribing to industry newsletters, following relevant companies and organizations, or regularly checking reputable industry news sources and publications.
Methodology
Step 1 - Identification of Relevant Samples Size from Population Database


Step 2 - Approaches for Defining Global Market Size (Value, Volume* & Price*)

Note*: In applicable scenarios
Step 3 - Data Sources
Primary Research
- Web Analytics
- Survey Reports
- Research Institute
- Latest Research Reports
- Opinion Leaders
Secondary Research
- Annual Reports
- White Paper
- Latest Press Release
- Industry Association
- Paid Database
- Investor Presentations

Step 4 - Data Triangulation
Involves using different sources of information in order to increase the validity of a study
These sources are likely to be stakeholders in a program - participants, other researchers, program staff, other community members, and so on.
Then we put all data in single framework & apply various statistical tools to find out the dynamic on the market.
During the analysis stage, feedback from the stakeholder groups would be compared to determine areas of agreement as well as areas of divergence
