

Key Insights
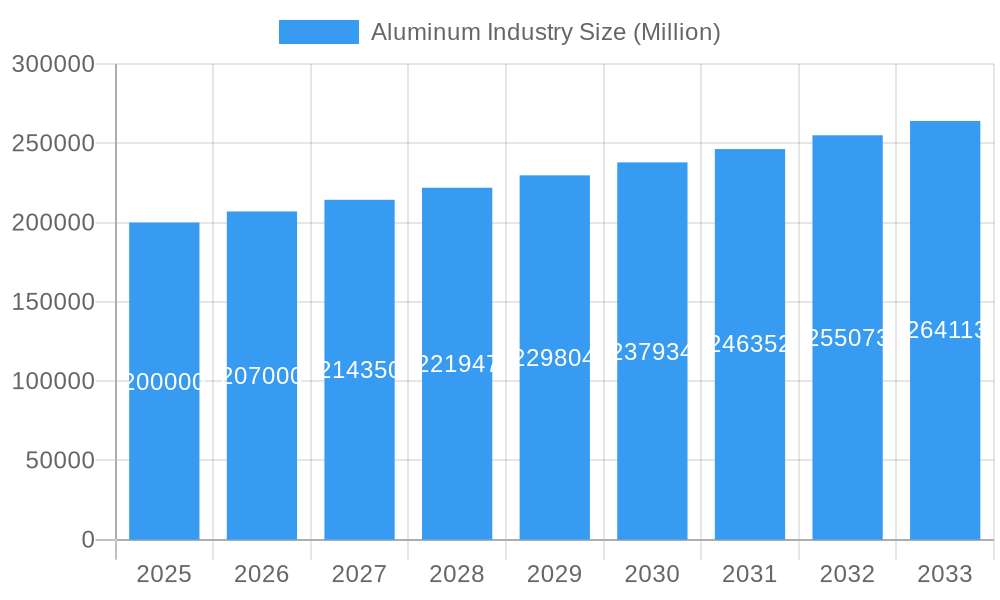
The global aluminum market, projected to reach $52.4 billion by 2025, is poised for significant expansion with a Compound Annual Growth Rate (CAGR) of 6% from 2025 to 2033. This growth is propelled by increasing demand from the automotive sector for lightweight materials, robust aerospace and defense applications, and the construction industry's need for durable and versatile materials. Furthermore, the expanding electrical and electronics sectors are driving consumption, complemented by advancements in aluminum processing technologies that enhance efficiency and broaden applications. However, market growth may be tempered by fluctuating aluminum prices and environmental production concerns.
Aluminum Industry Market Size (In Billion)
The industry exhibits diverse segmentation by processing type (castings, extrusions, forgings) and end-user industries. Geographically, the Asia-Pacific region, particularly China and India, leads due to strong manufacturing bases and infrastructure development. North America and Europe also maintain significant market shares driven by industrial activity and established processing capabilities.
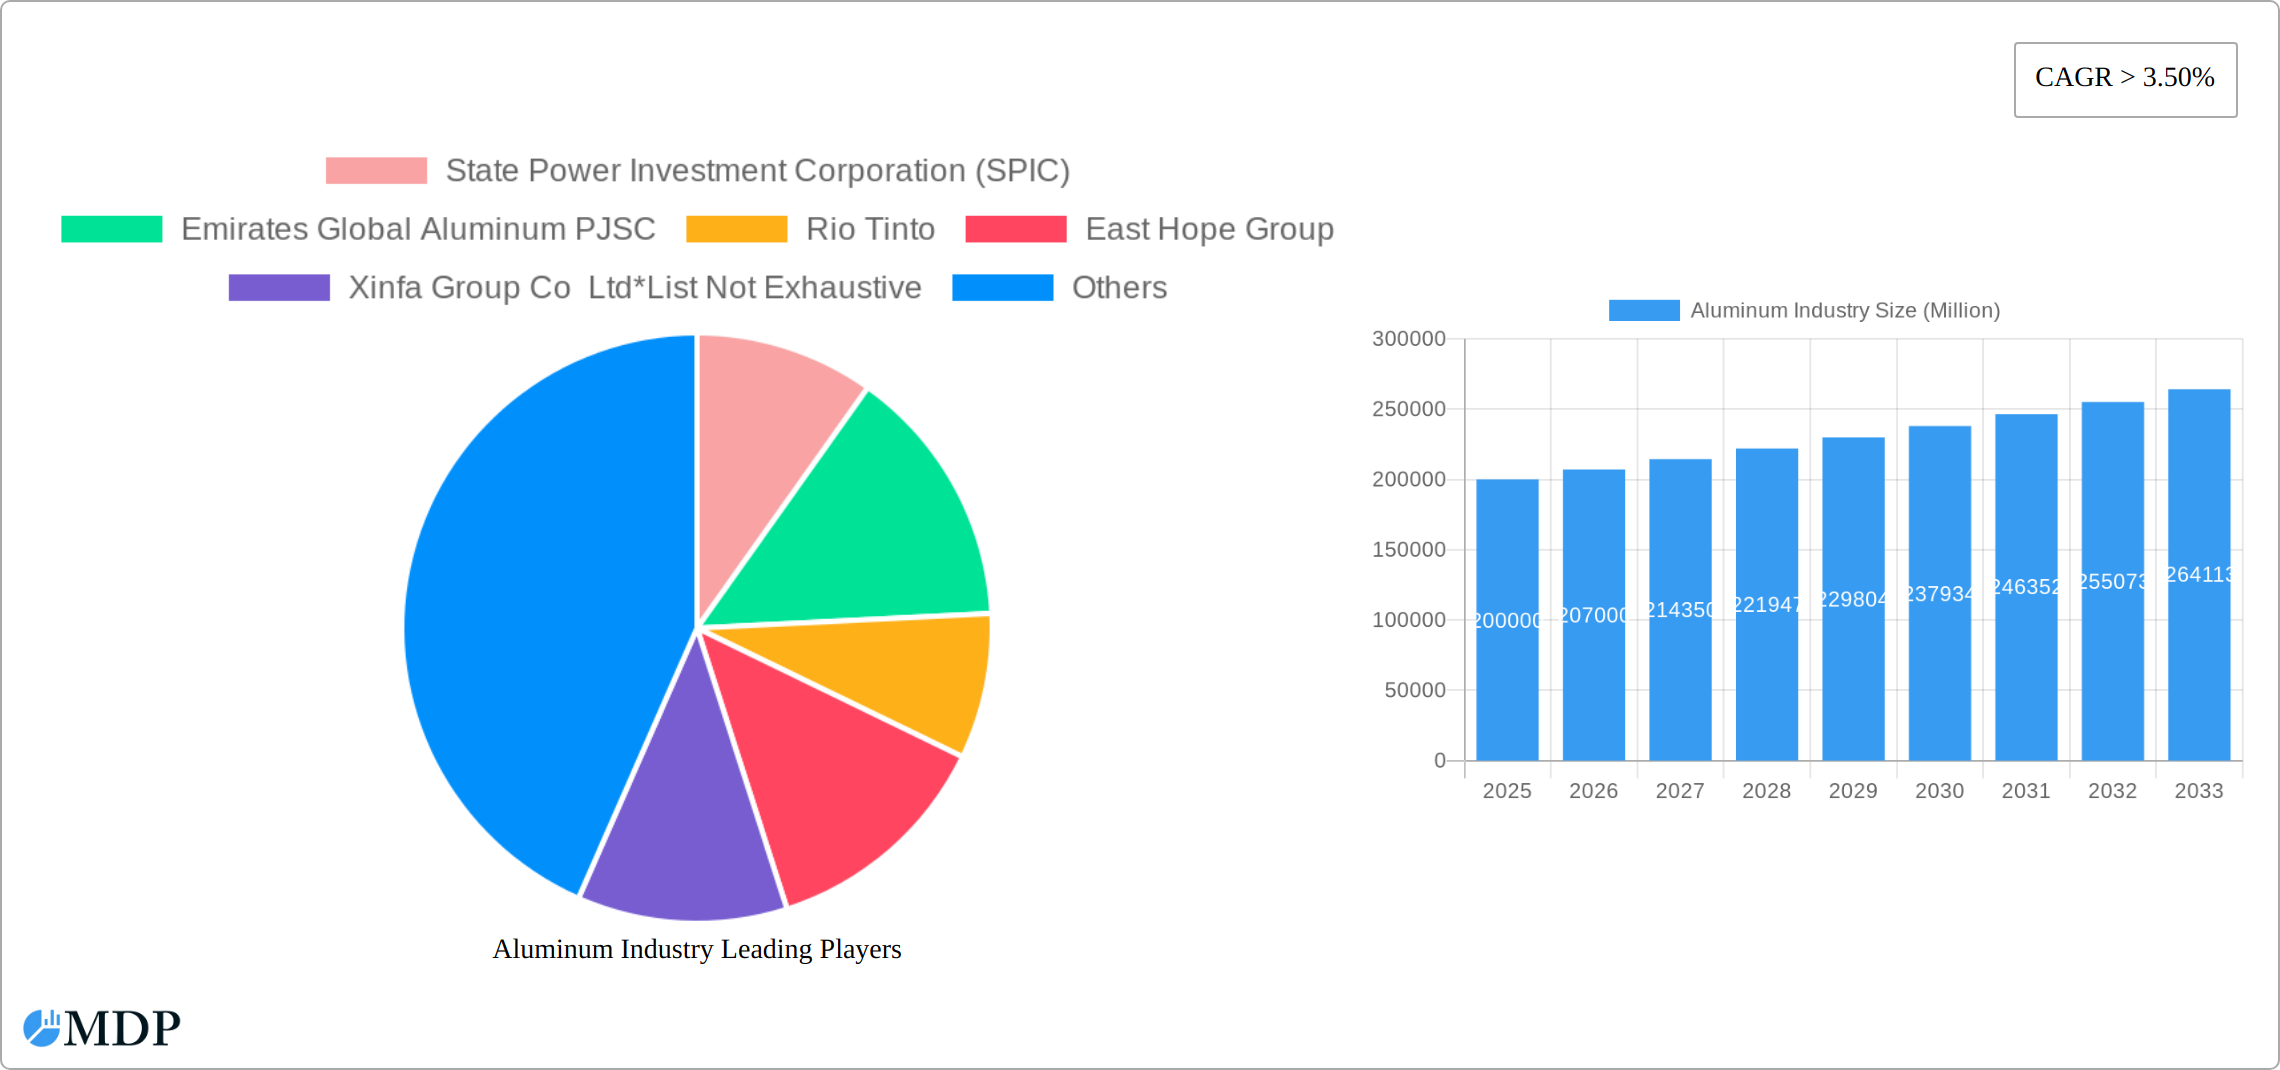
Aluminum Industry Company Market Share
Intense competition characterizes the aluminum market, with key players including State Power Investment Corporation (SPIC), Emirates Global Aluminum PJSC, and Rio Tinto. Future growth hinges on global economic trends, technological innovation, and sustainable manufacturing practices. Addressing environmental impact through responsible sourcing and recycling is crucial for long-term viability. Diversification across end-use sectors and regions will enable market players to mitigate risks associated with price volatility and demand fluctuations. Continued research into aluminum alloys and composites will unlock new applications and further stimulate market growth.
This comprehensive report analyzes global aluminum market dynamics, key players, and future growth prospects from 2019-2033, with a base year of 2025 and a forecast period of 2025-2033. Gain actionable insights into market trends, technological advancements, and critical challenges shaping this vital sector.
Aluminum Industry Market Dynamics & Concentration
The global aluminum market is characterized by a moderately concentrated landscape, with a few major players holding significant market share. While exact figures fluctuate, the top ten producers likely account for over 60% of global production. Market concentration is influenced by factors such as economies of scale, access to raw materials (bauxite), and technological advancements. Innovation drives competition, with companies continuously striving for cost efficiencies and improved product quality. Stringent environmental regulations, particularly regarding carbon emissions, are reshaping the industry, pushing for greener production methods and recycling initiatives. Aluminum's versatility has led to its substitution in various applications, creating both opportunities and challenges for producers. Ongoing mergers and acquisitions (M&A) activity reflect strategic maneuvering by major players to expand their market reach and consolidate their positions. Over the period 2019-2024, we estimate approximately xx M&A deals were finalized in the aluminum sector, significantly influencing market share dynamics.
- Market Share: Top 5 players control approximately xx% of the market.
- M&A Activity: An average of xx major M&A deals per year were observed from 2019-2024.
- Innovation Drivers: Focus on lightweighting, improved recyclability, and sustainable production methods.
- Regulatory Frameworks: Increasingly stringent environmental regulations are driving changes in production processes.
- Product Substitutes: Competition from other materials, such as steel and plastics, particularly in specific applications, needs careful consideration.
- End-User Trends: The shift towards sustainable practices is creating demand for recycled aluminum and aluminum produced with lower carbon footprints.
Aluminum Industry Industry Trends & Analysis
The aluminum industry is experiencing a period of significant and sustained growth, propelled by escalating demand across a diverse range of end-use sectors. Projections indicate a robust Compound Annual Growth Rate (CAGR) of XX% during the forecast period (2025-2033). This upward trajectory is primarily attributed to substantial investments in infrastructure development, particularly within rapidly expanding emerging economies, and the automotive sector's intensified focus on lightweighting technologies to enhance fuel efficiency and reduce emissions. Furthermore, groundbreaking technological advancements, including continuous improvements in smelting and refining processes, alongside the burgeoning field of additive manufacturing (3D printing), are fundamentally reshaping the industry's capabilities and product offerings. A notable shift in consumer preferences towards environmentally responsible and recyclable materials is also significantly amplifying aluminum's intrinsic appeal as a sustainable choice. However, the industry is not without its challenges; fluctuating raw material prices and the inherent volatility of global economic conditions present potential headwinds that require strategic navigation. Concurrently, the market penetration of recycled aluminum is steadily increasing, driven by both growing environmental consciousness and demonstrable cost advantages associated with its production. The competitive landscape remains highly dynamic, characterized by persistent investments in capacity expansions and ongoing technological upgrades among the key industry players striving for market leadership.
Leading Markets & Segments in Aluminum Industry
The Asia-Pacific region, with China at its forefront, unequivocally dominates the global aluminum market, commanding an impressive share of over XX% in both global production and consumption. This pronounced dominance is a direct consequence of the region's accelerated industrialization, ambitious large-scale infrastructure projects, and a burgeoning automotive sector experiencing exponential growth.
Key Drivers for Asia's Dominance:
- Rapid Industrialization and Urbanization: Extensive infrastructure development and urban expansion are creating an insatiable demand for aluminum in construction, transportation, and various industrial applications.
- Booming Automotive Sector: The widespread adoption of lightweighting strategies in vehicle design to improve fuel efficiency and meet stringent environmental regulations is a significant catalyst for increased aluminum usage in the automotive industry.
- Favorable Government Support and Policies: Proactive government initiatives and supportive policies in many Asian nations are actively promoting aluminum production, consumption, and the development of related industries.
When examining processing types, Flat Rolled Products emerge as the largest and most significant segment, closely followed by Extrusions and Castings. The primary end-use industries driving demand for aluminum are the Automotive sector, the Building & Construction industry, and the rapidly expanding Packaging sector.
- Dominant Region: Asia (particularly China and India)
- Dominant Processing Type: Flat Rolled Products
- Dominant End-Use Industry: Automotive and Building & Construction
Aluminum Industry Product Developments
Recent innovations in aluminum alloys have led to the development of stronger, lighter, and more corrosion-resistant materials, expanding their applications in various sectors. Advances in casting technologies are enhancing the quality and efficiency of aluminum components for automotive and aerospace applications. The increasing adoption of recycled aluminum in manufacturing further contributes to product development and sustainability initiatives. These advancements position aluminum to compete effectively in applications demanding high performance and eco-friendliness.
Key Drivers of Aluminum Industry Growth
The aluminum industry's growth is propelled by several key factors:
- Technological advancements: Improvements in manufacturing processes and alloy development.
- Economic growth in emerging markets: Increased infrastructure investments and industrialization.
- Sustainable initiatives: Growing demand for recycled aluminum and environmentally friendly production methods.
- Lightweighting trends in automotive and aerospace: Aluminum's unique properties make it ideal for reducing vehicle weight and improving fuel efficiency.
Challenges in the Aluminum Industry Market
The aluminum industry faces several challenges:
- Fluctuating raw material prices: Bauxite and energy costs significantly impact production profitability.
- Environmental regulations: Stringent emission standards necessitate costly upgrades to production facilities.
- Competition from substitute materials: Steel, plastics, and composites present competition in certain applications.
- Supply chain disruptions: Geopolitical events and logistical challenges can impact aluminum availability.
Emerging Opportunities in Aluminum Industry
The aluminum industry is ripe with significant and exciting opportunities for forward-thinking producers:
- Expansion into Emerging Markets: Significant untapped potential exists in developing economies across Africa, Latin America, and Southeast Asia, where infrastructure development and industrial growth are on the rise.
- Strategic Partnerships and Collaborations: Forging strategic alliances with cutting-edge technology providers and key end-users will be instrumental in accelerating the development and market introduction of innovative aluminum products and specialized applications.
- Investment in Advanced Recycling Infrastructure: Addressing the escalating demand for sustainable materials, substantial investments in modern and efficient aluminum recycling facilities are crucial to meet the growing need for recycled aluminum content.
- Development of High-Performance Alloys: Continued research and development into advanced aluminum alloys with enhanced properties will unlock new opportunities for specialized applications in high-tech industries such as aerospace, defense, and renewable energy.
Leading Players in the Aluminum Industry Sector
Key Milestones in Aluminum Industry Industry
- July 2022: Rio Tinto made a significant announcement regarding an investment of USD 188 million into its Canadian aluminum operations, aimed at boosting billet production by an additional 202,000 metric tonnes per year.
- February 2022: Emirates Global Aluminum (EGA) unveiled plans for a substantial new aluminum recycling facility in the UAE, designed to have an impressive annual processing capacity of 150,000 tonnes, underscoring a commitment to circular economy principles.
Strategic Outlook for Aluminum Industry Market
The global aluminum industry is strongly positioned for continued and robust growth in the foreseeable future. This optimistic outlook is underpinned by ongoing technological innovations, the continuous expansion of aluminum's application scope across diverse industries, and a global imperative towards more sustainable and environmentally friendly practices. Strategic partnerships, targeted investments in advanced recycling infrastructure, and the persistent development of high-performance aluminum alloys will be paramount for companies seeking to maximize their market share and ensure sustained profitability in the coming years. The enduring focus on lightweighting, particularly within the transportation sector, will remain a pivotal driver, guaranteeing sustained and strong demand for aluminum across a wide spectrum of industries.
Aluminum Industry Segmentation
-
1. Processing Type
- 1.1. Castings
- 1.2. Extrusions
- 1.3. Forgings
- 1.4. Flat Rolled Products
- 1.5. Pigments and Powders
-
2. End-user Industry
- 2.1. Automotive
- 2.2. Aerospace and Defense
- 2.3. Building and Construction
- 2.4. Electrical and Electronics
- 2.5. Packaging
- 2.6. Industrial
- 2.7. Other End-user Industries
Aluminum Industry Segmentation By Geography
-
1. Asia Pacific
- 1.1. China
- 1.2. India
- 1.3. Japan
- 1.4. South Korea
- 1.5. Rest of Asia Pacific
-
2. North America
- 2.1. United States
- 2.2. Canada
- 2.3. Mexico
-
3. Europe
- 3.1. Germany
- 3.2. United Kingdom
- 3.3. France
- 3.4. Italy
- 3.5. Rest of Europe
-
4. South America
- 4.1. Brazil
- 4.2. Argentina
- 4.3. Rest of South America
-
5. Middle East and Africa
- 5.1. Saudi Arabia
- 5.2. South Africa
- 5.3. Rest of Middle East and Africa
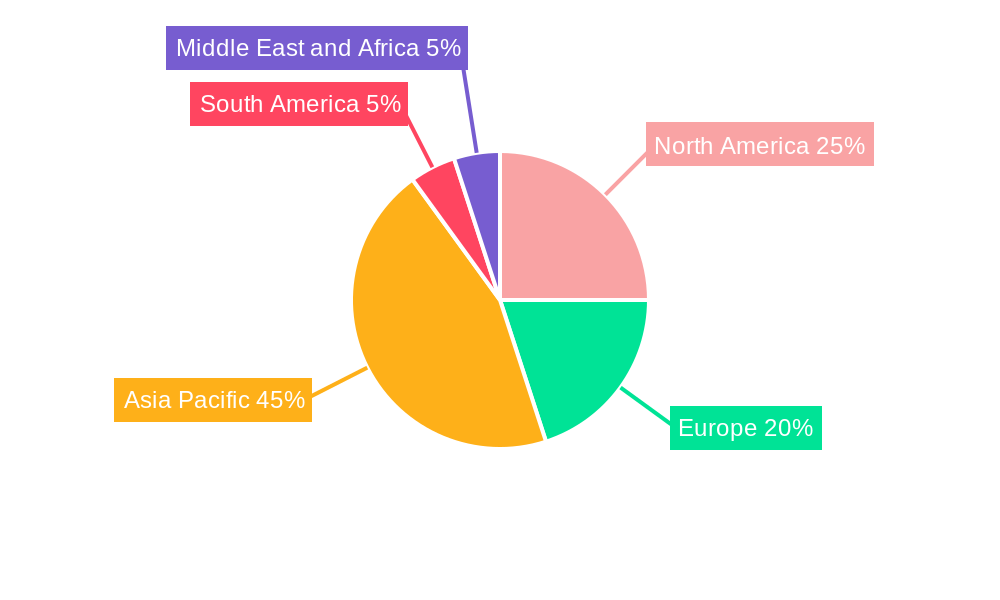
Aluminum Industry Regional Market Share
Geographic Coverage of Aluminum Industry
Aluminum Industry REPORT HIGHLIGHTS
| Aspects | Details |
|---|---|
| Study Period | 2020-2034 |
| Base Year | 2025 |
| Estimated Year | 2026 |
| Forecast Period | 2026-2034 |
| Historical Period | 2020-2025 |
| Growth Rate | CAGR of 6% from 2020-2034 |
| Segmentation |
|
Table of Contents
- 1. Introduction
- 1.1. Research Scope
- 1.2. Market Segmentation
- 1.3. Research Methodology
- 1.4. Definitions and Assumptions
- 2. Executive Summary
- 2.1. Introduction
- 3. Market Dynamics
- 3.1. Introduction
- 3.2. Market Drivers
- 3.2.1. Increasing Construction Activities in the Asia-Pacific Region; Other Drivers
- 3.3. Market Restrains
- 3.3.1. Strict Regulations and Environmental Concerns Related to Aluminum Processing
- 3.4. Market Trends
- 3.4.1. Increasing Demand from the Building and Construction Industry
- 4. Market Factor Analysis
- 4.1. Porters Five Forces
- 4.2. Supply/Value Chain
- 4.3. PESTEL analysis
- 4.4. Market Entropy
- 4.5. Patent/Trademark Analysis
- 5. Global Aluminum Industry Analysis, Insights and Forecast, 2020-2032
- 5.1. Market Analysis, Insights and Forecast - by Processing Type
- 5.1.1. Castings
- 5.1.2. Extrusions
- 5.1.3. Forgings
- 5.1.4. Flat Rolled Products
- 5.1.5. Pigments and Powders
- 5.2. Market Analysis, Insights and Forecast - by End-user Industry
- 5.2.1. Automotive
- 5.2.2. Aerospace and Defense
- 5.2.3. Building and Construction
- 5.2.4. Electrical and Electronics
- 5.2.5. Packaging
- 5.2.6. Industrial
- 5.2.7. Other End-user Industries
- 5.3. Market Analysis, Insights and Forecast - by Region
- 5.3.1. Asia Pacific
- 5.3.2. North America
- 5.3.3. Europe
- 5.3.4. South America
- 5.3.5. Middle East and Africa
- 5.1. Market Analysis, Insights and Forecast - by Processing Type
- 6. Asia Pacific Aluminum Industry Analysis, Insights and Forecast, 2020-2032
- 6.1. Market Analysis, Insights and Forecast - by Processing Type
- 6.1.1. Castings
- 6.1.2. Extrusions
- 6.1.3. Forgings
- 6.1.4. Flat Rolled Products
- 6.1.5. Pigments and Powders
- 6.2. Market Analysis, Insights and Forecast - by End-user Industry
- 6.2.1. Automotive
- 6.2.2. Aerospace and Defense
- 6.2.3. Building and Construction
- 6.2.4. Electrical and Electronics
- 6.2.5. Packaging
- 6.2.6. Industrial
- 6.2.7. Other End-user Industries
- 6.1. Market Analysis, Insights and Forecast - by Processing Type
- 7. North America Aluminum Industry Analysis, Insights and Forecast, 2020-2032
- 7.1. Market Analysis, Insights and Forecast - by Processing Type
- 7.1.1. Castings
- 7.1.2. Extrusions
- 7.1.3. Forgings
- 7.1.4. Flat Rolled Products
- 7.1.5. Pigments and Powders
- 7.2. Market Analysis, Insights and Forecast - by End-user Industry
- 7.2.1. Automotive
- 7.2.2. Aerospace and Defense
- 7.2.3. Building and Construction
- 7.2.4. Electrical and Electronics
- 7.2.5. Packaging
- 7.2.6. Industrial
- 7.2.7. Other End-user Industries
- 7.1. Market Analysis, Insights and Forecast - by Processing Type
- 8. Europe Aluminum Industry Analysis, Insights and Forecast, 2020-2032
- 8.1. Market Analysis, Insights and Forecast - by Processing Type
- 8.1.1. Castings
- 8.1.2. Extrusions
- 8.1.3. Forgings
- 8.1.4. Flat Rolled Products
- 8.1.5. Pigments and Powders
- 8.2. Market Analysis, Insights and Forecast - by End-user Industry
- 8.2.1. Automotive
- 8.2.2. Aerospace and Defense
- 8.2.3. Building and Construction
- 8.2.4. Electrical and Electronics
- 8.2.5. Packaging
- 8.2.6. Industrial
- 8.2.7. Other End-user Industries
- 8.1. Market Analysis, Insights and Forecast - by Processing Type
- 9. South America Aluminum Industry Analysis, Insights and Forecast, 2020-2032
- 9.1. Market Analysis, Insights and Forecast - by Processing Type
- 9.1.1. Castings
- 9.1.2. Extrusions
- 9.1.3. Forgings
- 9.1.4. Flat Rolled Products
- 9.1.5. Pigments and Powders
- 9.2. Market Analysis, Insights and Forecast - by End-user Industry
- 9.2.1. Automotive
- 9.2.2. Aerospace and Defense
- 9.2.3. Building and Construction
- 9.2.4. Electrical and Electronics
- 9.2.5. Packaging
- 9.2.6. Industrial
- 9.2.7. Other End-user Industries
- 9.1. Market Analysis, Insights and Forecast - by Processing Type
- 10. Middle East and Africa Aluminum Industry Analysis, Insights and Forecast, 2020-2032
- 10.1. Market Analysis, Insights and Forecast - by Processing Type
- 10.1.1. Castings
- 10.1.2. Extrusions
- 10.1.3. Forgings
- 10.1.4. Flat Rolled Products
- 10.1.5. Pigments and Powders
- 10.2. Market Analysis, Insights and Forecast - by End-user Industry
- 10.2.1. Automotive
- 10.2.2. Aerospace and Defense
- 10.2.3. Building and Construction
- 10.2.4. Electrical and Electronics
- 10.2.5. Packaging
- 10.2.6. Industrial
- 10.2.7. Other End-user Industries
- 10.1. Market Analysis, Insights and Forecast - by Processing Type
- 11. Competitive Analysis
- 11.1. Global Market Share Analysis 2025
- 11.2. Company Profiles
- 11.2.1 State Power Investment Corporation (SPIC)
- 11.2.1.1. Overview
- 11.2.1.2. Products
- 11.2.1.3. SWOT Analysis
- 11.2.1.4. Recent Developments
- 11.2.1.5. Financials (Based on Availability)
- 11.2.2 Emirates Global Aluminum PJSC
- 11.2.2.1. Overview
- 11.2.2.2. Products
- 11.2.2.3. SWOT Analysis
- 11.2.2.4. Recent Developments
- 11.2.2.5. Financials (Based on Availability)
- 11.2.3 Rio Tinto
- 11.2.3.1. Overview
- 11.2.3.2. Products
- 11.2.3.3. SWOT Analysis
- 11.2.3.4. Recent Developments
- 11.2.3.5. Financials (Based on Availability)
- 11.2.4 East Hope Group
- 11.2.4.1. Overview
- 11.2.4.2. Products
- 11.2.4.3. SWOT Analysis
- 11.2.4.4. Recent Developments
- 11.2.4.5. Financials (Based on Availability)
- 11.2.5 Xinfa Group Co Ltd*List Not Exhaustive
- 11.2.5.1. Overview
- 11.2.5.2. Products
- 11.2.5.3. SWOT Analysis
- 11.2.5.4. Recent Developments
- 11.2.5.5. Financials (Based on Availability)
- 11.2.6 China Hongqiao Group Limited
- 11.2.6.1. Overview
- 11.2.6.2. Products
- 11.2.6.3. SWOT Analysis
- 11.2.6.4. Recent Developments
- 11.2.6.5. Financials (Based on Availability)
- 11.2.7 Novelis Inc
- 11.2.7.1. Overview
- 11.2.7.2. Products
- 11.2.7.3. SWOT Analysis
- 11.2.7.4. Recent Developments
- 11.2.7.5. Financials (Based on Availability)
- 11.2.8 RusAL
- 11.2.8.1. Overview
- 11.2.8.2. Products
- 11.2.8.3. SWOT Analysis
- 11.2.8.4. Recent Developments
- 11.2.8.5. Financials (Based on Availability)
- 11.2.9 Norsk Hydro ASA
- 11.2.9.1. Overview
- 11.2.9.2. Products
- 11.2.9.3. SWOT Analysis
- 11.2.9.4. Recent Developments
- 11.2.9.5. Financials (Based on Availability)
- 11.2.10 Aluminum Corporation of China Limited (CHINALCO)
- 11.2.10.1. Overview
- 11.2.10.2. Products
- 11.2.10.3. SWOT Analysis
- 11.2.10.4. Recent Developments
- 11.2.10.5. Financials (Based on Availability)
- 11.2.11 Alcoa Corporation
- 11.2.11.1. Overview
- 11.2.11.2. Products
- 11.2.11.3. SWOT Analysis
- 11.2.11.4. Recent Developments
- 11.2.11.5. Financials (Based on Availability)
- 11.2.12 Aluminum Bahrain B S C (Alba)
- 11.2.12.1. Overview
- 11.2.12.2. Products
- 11.2.12.3. SWOT Analysis
- 11.2.12.4. Recent Developments
- 11.2.12.5. Financials (Based on Availability)
- 11.2.1 State Power Investment Corporation (SPIC)
List of Figures
- Figure 1: Global Aluminum Industry Revenue Breakdown (billion, %) by Region 2025 & 2033
- Figure 2: Asia Pacific Aluminum Industry Revenue (billion), by Processing Type 2025 & 2033
- Figure 3: Asia Pacific Aluminum Industry Revenue Share (%), by Processing Type 2025 & 2033
- Figure 4: Asia Pacific Aluminum Industry Revenue (billion), by End-user Industry 2025 & 2033
- Figure 5: Asia Pacific Aluminum Industry Revenue Share (%), by End-user Industry 2025 & 2033
- Figure 6: Asia Pacific Aluminum Industry Revenue (billion), by Country 2025 & 2033
- Figure 7: Asia Pacific Aluminum Industry Revenue Share (%), by Country 2025 & 2033
- Figure 8: North America Aluminum Industry Revenue (billion), by Processing Type 2025 & 2033
- Figure 9: North America Aluminum Industry Revenue Share (%), by Processing Type 2025 & 2033
- Figure 10: North America Aluminum Industry Revenue (billion), by End-user Industry 2025 & 2033
- Figure 11: North America Aluminum Industry Revenue Share (%), by End-user Industry 2025 & 2033
- Figure 12: North America Aluminum Industry Revenue (billion), by Country 2025 & 2033
- Figure 13: North America Aluminum Industry Revenue Share (%), by Country 2025 & 2033
- Figure 14: Europe Aluminum Industry Revenue (billion), by Processing Type 2025 & 2033
- Figure 15: Europe Aluminum Industry Revenue Share (%), by Processing Type 2025 & 2033
- Figure 16: Europe Aluminum Industry Revenue (billion), by End-user Industry 2025 & 2033
- Figure 17: Europe Aluminum Industry Revenue Share (%), by End-user Industry 2025 & 2033
- Figure 18: Europe Aluminum Industry Revenue (billion), by Country 2025 & 2033
- Figure 19: Europe Aluminum Industry Revenue Share (%), by Country 2025 & 2033
- Figure 20: South America Aluminum Industry Revenue (billion), by Processing Type 2025 & 2033
- Figure 21: South America Aluminum Industry Revenue Share (%), by Processing Type 2025 & 2033
- Figure 22: South America Aluminum Industry Revenue (billion), by End-user Industry 2025 & 2033
- Figure 23: South America Aluminum Industry Revenue Share (%), by End-user Industry 2025 & 2033
- Figure 24: South America Aluminum Industry Revenue (billion), by Country 2025 & 2033
- Figure 25: South America Aluminum Industry Revenue Share (%), by Country 2025 & 2033
- Figure 26: Middle East and Africa Aluminum Industry Revenue (billion), by Processing Type 2025 & 2033
- Figure 27: Middle East and Africa Aluminum Industry Revenue Share (%), by Processing Type 2025 & 2033
- Figure 28: Middle East and Africa Aluminum Industry Revenue (billion), by End-user Industry 2025 & 2033
- Figure 29: Middle East and Africa Aluminum Industry Revenue Share (%), by End-user Industry 2025 & 2033
- Figure 30: Middle East and Africa Aluminum Industry Revenue (billion), by Country 2025 & 2033
- Figure 31: Middle East and Africa Aluminum Industry Revenue Share (%), by Country 2025 & 2033
List of Tables
- Table 1: Global Aluminum Industry Revenue billion Forecast, by Processing Type 2020 & 2033
- Table 2: Global Aluminum Industry Revenue billion Forecast, by End-user Industry 2020 & 2033
- Table 3: Global Aluminum Industry Revenue billion Forecast, by Region 2020 & 2033
- Table 4: Global Aluminum Industry Revenue billion Forecast, by Processing Type 2020 & 2033
- Table 5: Global Aluminum Industry Revenue billion Forecast, by End-user Industry 2020 & 2033
- Table 6: Global Aluminum Industry Revenue billion Forecast, by Country 2020 & 2033
- Table 7: China Aluminum Industry Revenue (billion) Forecast, by Application 2020 & 2033
- Table 8: India Aluminum Industry Revenue (billion) Forecast, by Application 2020 & 2033
- Table 9: Japan Aluminum Industry Revenue (billion) Forecast, by Application 2020 & 2033
- Table 10: South Korea Aluminum Industry Revenue (billion) Forecast, by Application 2020 & 2033
- Table 11: Rest of Asia Pacific Aluminum Industry Revenue (billion) Forecast, by Application 2020 & 2033
- Table 12: Global Aluminum Industry Revenue billion Forecast, by Processing Type 2020 & 2033
- Table 13: Global Aluminum Industry Revenue billion Forecast, by End-user Industry 2020 & 2033
- Table 14: Global Aluminum Industry Revenue billion Forecast, by Country 2020 & 2033
- Table 15: United States Aluminum Industry Revenue (billion) Forecast, by Application 2020 & 2033
- Table 16: Canada Aluminum Industry Revenue (billion) Forecast, by Application 2020 & 2033
- Table 17: Mexico Aluminum Industry Revenue (billion) Forecast, by Application 2020 & 2033
- Table 18: Global Aluminum Industry Revenue billion Forecast, by Processing Type 2020 & 2033
- Table 19: Global Aluminum Industry Revenue billion Forecast, by End-user Industry 2020 & 2033
- Table 20: Global Aluminum Industry Revenue billion Forecast, by Country 2020 & 2033
- Table 21: Germany Aluminum Industry Revenue (billion) Forecast, by Application 2020 & 2033
- Table 22: United Kingdom Aluminum Industry Revenue (billion) Forecast, by Application 2020 & 2033
- Table 23: France Aluminum Industry Revenue (billion) Forecast, by Application 2020 & 2033
- Table 24: Italy Aluminum Industry Revenue (billion) Forecast, by Application 2020 & 2033
- Table 25: Rest of Europe Aluminum Industry Revenue (billion) Forecast, by Application 2020 & 2033
- Table 26: Global Aluminum Industry Revenue billion Forecast, by Processing Type 2020 & 2033
- Table 27: Global Aluminum Industry Revenue billion Forecast, by End-user Industry 2020 & 2033
- Table 28: Global Aluminum Industry Revenue billion Forecast, by Country 2020 & 2033
- Table 29: Brazil Aluminum Industry Revenue (billion) Forecast, by Application 2020 & 2033
- Table 30: Argentina Aluminum Industry Revenue (billion) Forecast, by Application 2020 & 2033
- Table 31: Rest of South America Aluminum Industry Revenue (billion) Forecast, by Application 2020 & 2033
- Table 32: Global Aluminum Industry Revenue billion Forecast, by Processing Type 2020 & 2033
- Table 33: Global Aluminum Industry Revenue billion Forecast, by End-user Industry 2020 & 2033
- Table 34: Global Aluminum Industry Revenue billion Forecast, by Country 2020 & 2033
- Table 35: Saudi Arabia Aluminum Industry Revenue (billion) Forecast, by Application 2020 & 2033
- Table 36: South Africa Aluminum Industry Revenue (billion) Forecast, by Application 2020 & 2033
- Table 37: Rest of Middle East and Africa Aluminum Industry Revenue (billion) Forecast, by Application 2020 & 2033
Frequently Asked Questions
1. What is the projected Compound Annual Growth Rate (CAGR) of the Aluminum Industry?
The projected CAGR is approximately 6%.
2. Which companies are prominent players in the Aluminum Industry?
Key companies in the market include State Power Investment Corporation (SPIC), Emirates Global Aluminum PJSC, Rio Tinto, East Hope Group, Xinfa Group Co Ltd*List Not Exhaustive, China Hongqiao Group Limited, Novelis Inc, RusAL, Norsk Hydro ASA, Aluminum Corporation of China Limited (CHINALCO), Alcoa Corporation, Aluminum Bahrain B S C (Alba).
3. What are the main segments of the Aluminum Industry?
The market segments include Processing Type, End-user Industry.
4. Can you provide details about the market size?
The market size is estimated to be USD 52.4 billion as of 2022.
5. What are some drivers contributing to market growth?
Increasing Construction Activities in the Asia-Pacific Region; Other Drivers.
6. What are the notable trends driving market growth?
Increasing Demand from the Building and Construction Industry.
7. Are there any restraints impacting market growth?
Strict Regulations and Environmental Concerns Related to Aluminum Processing.
8. Can you provide examples of recent developments in the market?
July 2022: Rio Tinto unveils a USD 188 million aluminum investment plan in Canada. The company is planning to grow aluminum billets production by 202,000 metric tonnes. The firm will expand the capacity of the existing casting center at its Alma plant.
9. What pricing options are available for accessing the report?
Pricing options include single-user, multi-user, and enterprise licenses priced at USD 4750, USD 5250, and USD 8750 respectively.
10. Is the market size provided in terms of value or volume?
The market size is provided in terms of value, measured in billion.
11. Are there any specific market keywords associated with the report?
Yes, the market keyword associated with the report is "Aluminum Industry," which aids in identifying and referencing the specific market segment covered.
12. How do I determine which pricing option suits my needs best?
The pricing options vary based on user requirements and access needs. Individual users may opt for single-user licenses, while businesses requiring broader access may choose multi-user or enterprise licenses for cost-effective access to the report.
13. Are there any additional resources or data provided in the Aluminum Industry report?
While the report offers comprehensive insights, it's advisable to review the specific contents or supplementary materials provided to ascertain if additional resources or data are available.
14. How can I stay updated on further developments or reports in the Aluminum Industry?
To stay informed about further developments, trends, and reports in the Aluminum Industry, consider subscribing to industry newsletters, following relevant companies and organizations, or regularly checking reputable industry news sources and publications.
Methodology
Step 1 - Identification of Relevant Samples Size from Population Database


Step 2 - Approaches for Defining Global Market Size (Value, Volume* & Price*)

Note*: In applicable scenarios
Step 3 - Data Sources
Primary Research
- Web Analytics
- Survey Reports
- Research Institute
- Latest Research Reports
- Opinion Leaders
Secondary Research
- Annual Reports
- White Paper
- Latest Press Release
- Industry Association
- Paid Database
- Investor Presentations

Step 4 - Data Triangulation
Involves using different sources of information in order to increase the validity of a study
These sources are likely to be stakeholders in a program - participants, other researchers, program staff, other community members, and so on.
Then we put all data in single framework & apply various statistical tools to find out the dynamic on the market.
During the analysis stage, feedback from the stakeholder groups would be compared to determine areas of agreement as well as areas of divergence