

Key Insights
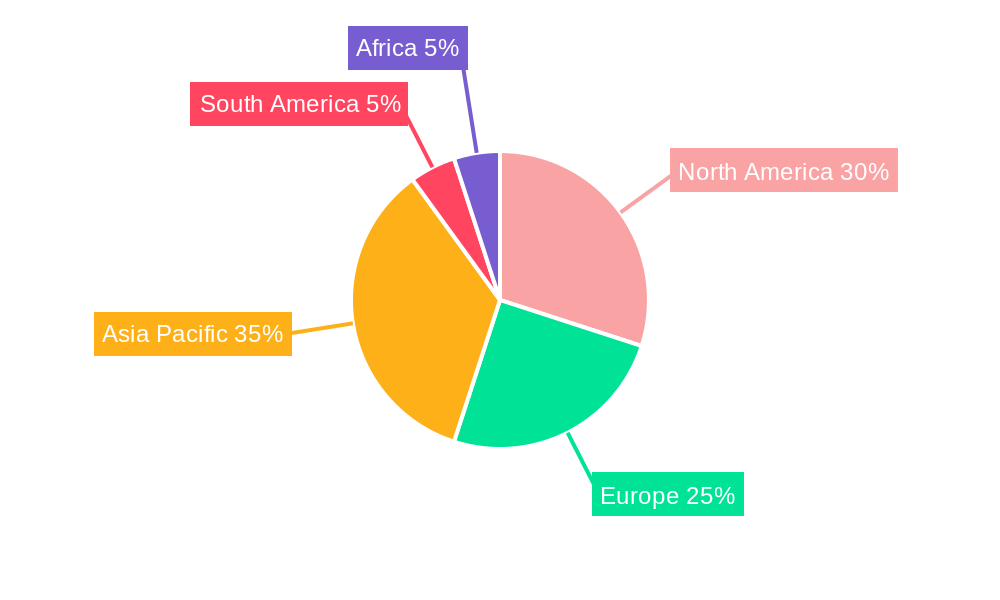
The global agricultural fumigants market, valued at $2.45 billion in 2025, is projected to experience robust growth, exhibiting a compound annual growth rate (CAGR) of 5.60% from 2025 to 2033. This expansion is driven by several key factors. Rising global food demand necessitates increased agricultural output, leading to a higher reliance on fumigants to control soilborne pests and diseases that significantly impact crop yields. Furthermore, advancements in fumigation techniques, including the development of more effective and environmentally friendly formulations, are fueling market growth. The increasing prevalence of pest and disease resistance to traditional methods is another significant driver, prompting farmers to adopt fumigants as a crucial pest management strategy. The market is segmented by type (Methyl Bromide, Chloropicrin, Phosphine, Metam Sodium, 1,3-Dichloropropene, and Other Agricultural Fumigants), method of application (Soil, Warehouse), form (Solid, Liquid, Gas), and crop application (Crop-based, Non-crop-based). The diverse application methods and crop types cater to a wide range of agricultural needs, contributing to the market's broad appeal. However, stringent environmental regulations surrounding the use of certain fumigants, particularly those with high toxicity, pose a significant restraint to market growth. Companies are continuously innovating to develop safer and more sustainable alternatives to mitigate this challenge. The geographical distribution reflects varied agricultural practices and regulatory environments, with North America and Asia Pacific expected to be leading markets due to intensive farming practices and substantial agricultural land.
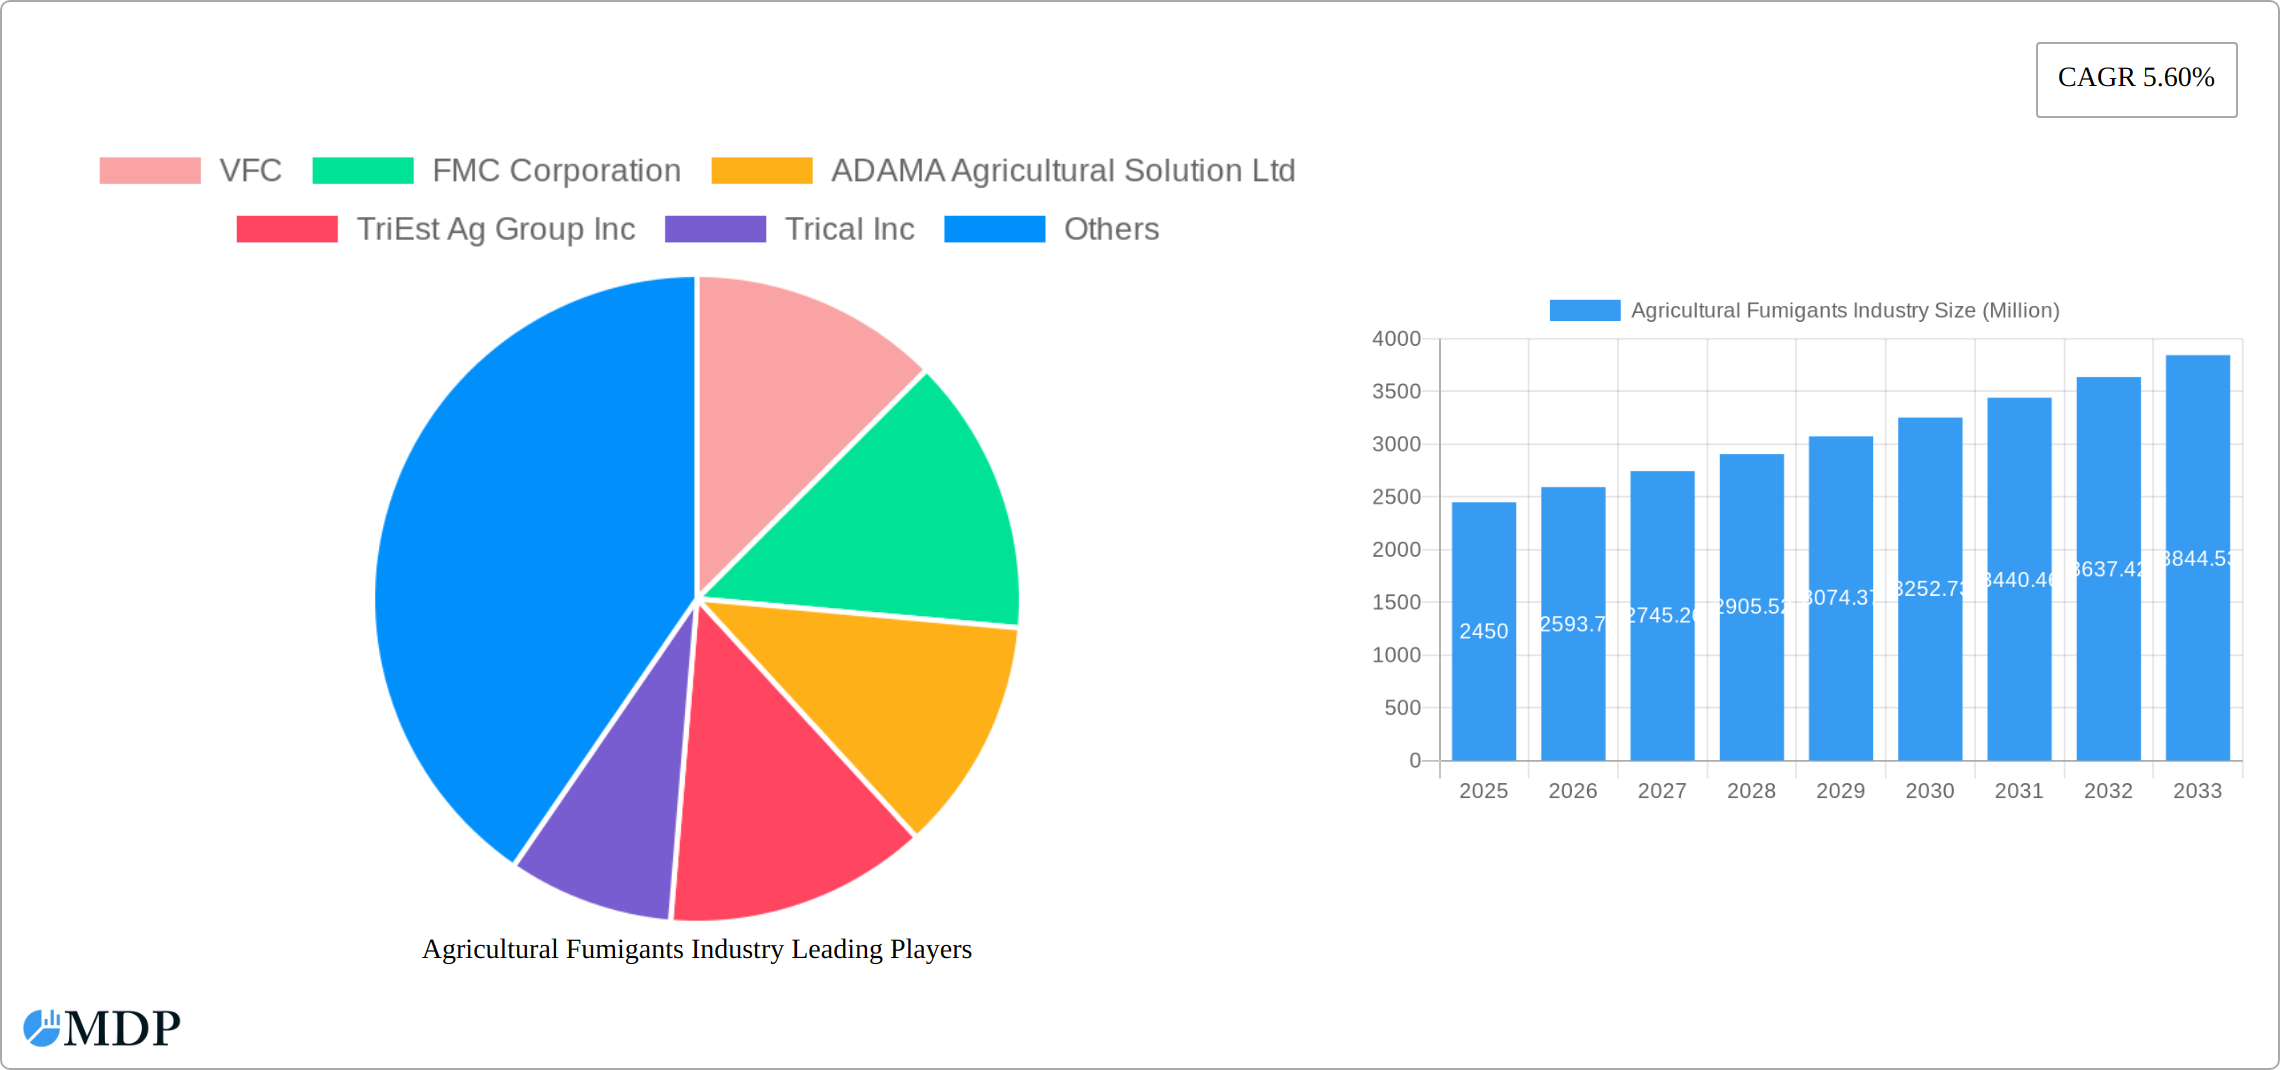
Agricultural Fumigants Industry Market Size (In Billion)
The competitive landscape is characterized by a mix of large multinational corporations and smaller specialized companies. Key players such as VFC, FMC Corporation, Adama Agricultural Solutions Ltd, and others are actively engaged in research and development, product innovation, and strategic acquisitions to maintain their market share. The industry is expected to witness increased consolidation as companies strive for economies of scale and geographical expansion. Future market growth will be significantly influenced by the development and adoption of sustainable and environmentally compliant fumigants, government regulations, and the evolving needs of the agricultural sector. Factors such as climate change, which can exacerbate pest and disease outbreaks, will also play a crucial role in shaping the future trajectory of the agricultural fumigants market. The ongoing efforts to improve the efficacy and safety of fumigants, coupled with the rising demand for food security, position the market for sustained, albeit regulated, expansion in the coming years.
Agricultural Fumigants Industry Company Market Share
Agricultural Fumigants Industry Report: 2019-2033
This comprehensive report provides an in-depth analysis of the Agricultural Fumigants market, projecting a robust growth trajectory from 2025 to 2033. Valued at xx Million in 2025, the market is poised for significant expansion, driven by key factors detailed within. The report covers market dynamics, leading players (including VFC, FMC Corporation, and Syngenta AG), and emerging trends, offering crucial insights for industry stakeholders, investors, and strategic decision-makers. The study period spans 2019-2033, with 2025 serving as the base and estimated year.
Agricultural Fumigants Industry Market Dynamics & Concentration
The Agricultural Fumigants market exhibits a moderately concentrated structure, with a few key players holding significant market share. VFC, FMC Corporation, and Syngenta AG are prominent examples, collectively accounting for an estimated xx% of the global market in 2025. However, several smaller, regional players also contribute significantly, creating a dynamic competitive landscape.
Market innovation is driven by the need for more effective, environmentally friendly fumigants to combat soilborne pests and diseases. Stringent regulatory frameworks, particularly concerning the phase-out of methyl bromide, are shaping the industry’s trajectory. The development of alternative fumigants and improved application methods is a key focus area. Product substitutes, such as biofumigants and biological control agents, are gaining traction, albeit slowly. End-user trends, including increasing demand for high-yield crops and growing awareness of food safety, are driving demand. M&A activity has been moderate in recent years, with xx major deals recorded between 2019 and 2024. This activity is expected to accelerate, particularly among smaller players seeking to enhance their product portfolios and global reach.
- Market Concentration: Moderately concentrated, with top three players holding xx% market share in 2025.
- Innovation Drivers: Demand for eco-friendly alternatives to methyl bromide, increased crop yields.
- Regulatory Frameworks: Stringent regulations driving innovation and market consolidation.
- Product Substitutes: Biofumigants and biological control agents gaining market share.
- End-User Trends: Growing demand for high-yield, safe food products.
- M&A Activity: xx major deals between 2019 and 2024.
Agricultural Fumigants Industry Industry Trends & Analysis
The agricultural fumigants market is poised for significant growth, projected to achieve a CAGR of [Insert Projected CAGR]% during the forecast period (2025-2033). This expansion is primarily driven by several key factors: a burgeoning global population fueling increased food demand, the expansion of cultivated acreage worldwide, and continuous advancements in fumigation technologies and the development of innovative fumigant formulations. While the market penetration of newer, more sustainable fumigants remains relatively low, it is expected to rise considerably due to escalating environmental concerns and stringent regulatory pressures. The growing consumer preference for pesticide-free and organically produced food presents both challenges and opportunities for industry players. The competitive landscape is highly dynamic, with companies prioritizing product differentiation, cost optimization strategies, and expansion into new geographic markets to maintain a competitive edge.
Leading Markets & Segments in Agricultural Fumigants Industry
The Asia-Pacific region currently dominates the agricultural fumigants market, fueled by extensive agricultural land, soaring food demand, and rising disposable incomes. A closer look at market segmentation reveals:
- Type: Methyl bromide remains a significant fumigant despite facing increasing regulatory restrictions. Phosphine and metam sodium also represent substantial market segments, with 1,3-Dichloropropene exhibiting strong growth potential.
- Method of Application: Soil application commands the largest market share, followed closely by warehouse fumigation, reflecting the diverse needs of agricultural practices.
- Form: Liquid and gas formulations continue to dominate the market, catering to various application methods and crop types.
- Crop Application: The majority of fumigant usage is directed towards crop protection, highlighting the crucial role these chemicals play in ensuring crop yields.
Key Drivers for Asia-Pacific Dominance:
- Rapid economic expansion and escalating agricultural production.
- Significant expansion of cultivated land dedicated to high-value crops.
- Increased governmental support for agricultural development initiatives.
Agricultural Fumigants Industry Product Developments
Recent years have witnessed significant advancements in agricultural fumigant technology, focusing on developing more efficient and environmentally friendly solutions. This includes the introduction of novel formulations, improved application methods (e.g., precision application technologies), and the development of biofumigants. These developments aim to improve efficacy while minimizing environmental impact and regulatory hurdles. The focus is increasingly on sustainable and targeted fumigation solutions to mitigate potential negative effects on human health and the ecosystem.
Key Drivers of Agricultural Fumigants Industry Growth
The growth of the agricultural fumigants market is propelled by several factors. Increasing global food demand coupled with expanding agricultural land under cultivation is a primary driver. Technological advancements, including more efficient and targeted application methods, enhance effectiveness and minimize environmental impact. Government regulations and policies aimed at improving agricultural productivity further stimulate market expansion. Finally, the development of novel, less harmful fumigants contributes to market growth by addressing environmental and health concerns.
Challenges in the Agricultural Fumigants Industry Market
The Agricultural Fumigants market faces several challenges. Stringent environmental regulations restrict the use of certain fumigants, impacting market growth. Supply chain disruptions and price volatility of raw materials pose significant operational challenges. Intense competition from substitute products and the high cost of developing and registering new fumigants add pressure to profit margins. These factors collectively influence market dynamics, impacting overall profitability.
Emerging Opportunities in Agricultural Fumigants Industry
The agricultural fumigants market presents substantial long-term growth opportunities. Technological advancements, particularly in biofumigants and precision application technologies, will open new market segments. Strategic partnerships and collaborations among industry players to develop sustainable solutions are expected to drive innovation. Expansion into emerging markets and increasing focus on organic and sustainable agriculture present further growth potential.
Leading Players in the Agricultural Fumigants Industry Sector
- VFC
- FMC Corporation
- ADAMA Agricultural Solution Ltd
- TriEst Ag Group Inc
- Trical Inc
- Fumigation Services
- Ikeda Kogyo Co Ltd
- Detia Degesch GmbH
- Corteva Agriscience (formerly DowDuPont)
- Lanxess
- Isagro SpA
- Syngenta AG
- UPL Group
- Industrial Fumigation Company
- Amvac Chemical Corporation
- Reddick Fumigants LLC
- Cytec Solvay Group
- BASF SE
Key Milestones in Agricultural Fumigants Industry Industry
- 2020: Heightened regulatory scrutiny on specific fumigants prompted formulation adjustments across the industry.
- 2022: A major industry player launched a novel biofumigant, marking a significant step towards more sustainable practices.
- 2023: A large multinational corporation acquired a smaller fumigant producer, signifying ongoing industry consolidation.
- 2024: A leading company introduced precision application technology, enhancing efficiency and reducing environmental impact.
Strategic Outlook for Agricultural Fumigants Industry Market
The agricultural fumigants market is poised for continued robust growth, propelled by technological innovation, evolving regulatory landscapes, and the persistently increasing global demand for food. Companies strategically focused on developing sustainable, environmentally friendly solutions and committing to robust research and development initiatives are optimally positioned for success. Strategic alliances and mergers & acquisitions will continue to reshape the industry landscape, driving market consolidation and fostering innovation. The market presents significant opportunities for companies capable of adapting to the dynamic regulatory environment and evolving consumer preferences.
Agricultural Fumigants Industry Segmentation
- 1. Production Analysis
- 2. Consumption Analysis
- 3. Import Market Analysis (Value & Volume)
- 4. Export Market Analysis (Value & Volume)
- 5. Price Trend Analysis
Agricultural Fumigants Industry Segmentation By Geography
-
1. North America
- 1.1. United States
- 1.2. Canada
- 1.3. Mexico
-
2. South America
- 2.1. Brazil
- 2.2. Argentina
- 2.3. Rest of South America
-
3. Europe
- 3.1. United Kingdom
- 3.2. Germany
- 3.3. France
- 3.4. Italy
- 3.5. Spain
- 3.6. Russia
- 3.7. Benelux
- 3.8. Nordics
- 3.9. Rest of Europe
-
4. Middle East & Africa
- 4.1. Turkey
- 4.2. Israel
- 4.3. GCC
- 4.4. North Africa
- 4.5. South Africa
- 4.6. Rest of Middle East & Africa
-
5. Asia Pacific
- 5.1. China
- 5.2. India
- 5.3. Japan
- 5.4. South Korea
- 5.5. ASEAN
- 5.6. Oceania
- 5.7. Rest of Asia Pacific
Agricultural Fumigants Industry Regional Market Share
Geographic Coverage of Agricultural Fumigants Industry
Agricultural Fumigants Industry REPORT HIGHLIGHTS
| Aspects | Details |
|---|---|
| Study Period | 2020-2034 |
| Base Year | 2025 |
| Estimated Year | 2026 |
| Forecast Period | 2026-2034 |
| Historical Period | 2020-2025 |
| Growth Rate | CAGR of 5.60% from 2020-2034 |
| Segmentation |
|
Table of Contents
- 1. Introduction
- 1.1. Research Scope
- 1.2. Market Segmentation
- 1.3. Research Objective
- 1.4. Definitions and Assumptions
- 2. Executive Summary
- 2.1. Market Snapshot
- 3. Market Dynamics
- 3.1. Market Drivers
- 3.2. Market Restrains
- 3.3. Market Trends
- 3.4. Market Opportunities
- 4. Market Factor Analysis
- 4.1. Porters Five Forces
- 4.1.1. Bargaining Power of Suppliers
- 4.1.2. Bargaining Power of Buyers
- 4.1.3. Threat of New Entrants
- 4.1.4. Threat of Substitutes
- 4.1.5. Competitive Rivalry
- 4.2. PESTEL analysis
- 4.3. BCG Analysis
- 4.3.1. Stars (High Growth, High Market Share)
- 4.3.2. Cash Cows (Low Growth, High Market Share)
- 4.3.3. Question Mark (High Growth, Low Market Share)
- 4.3.4. Dogs (Low Growth, Low Market Share)
- 4.4. Ansoff Matrix Analysis
- 4.5. Supply Chain Analysis
- 4.6. Regulatory Landscape
- 4.7. Current Market Potential and Opportunity Assessment (TAM–SAM–SOM Framework)
- 4.8. MDP Analyst Note
- 4.1. Porters Five Forces
- 5. Market Analysis, Insights and Forecast 2021-2033
- 5.1. Market Analysis, Insights and Forecast - by Production Analysis
- 5.2. Market Analysis, Insights and Forecast - by Consumption Analysis
- 5.3. Market Analysis, Insights and Forecast - by Import Market Analysis (Value & Volume)
- 5.4. Market Analysis, Insights and Forecast - by Export Market Analysis (Value & Volume)
- 5.5. Market Analysis, Insights and Forecast - by Price Trend Analysis
- 5.6. Market Analysis, Insights and Forecast - by Region
- 5.6.1. North America
- 5.6.2. South America
- 5.6.3. Europe
- 5.6.4. Middle East & Africa
- 5.6.5. Asia Pacific
- 6. Global Agricultural Fumigants Industry Analysis, Insights and Forecast, 2021-2033
- 6.1. Market Analysis, Insights and Forecast - by Production Analysis
- 6.2. Market Analysis, Insights and Forecast - by Consumption Analysis
- 6.3. Market Analysis, Insights and Forecast - by Import Market Analysis (Value & Volume)
- 6.4. Market Analysis, Insights and Forecast - by Export Market Analysis (Value & Volume)
- 6.5. Market Analysis, Insights and Forecast - by Price Trend Analysis
- 7. North America Agricultural Fumigants Industry Analysis, Insights and Forecast, 2020-2032
- 7.1. Market Analysis, Insights and Forecast - by Production Analysis
- 7.2. Market Analysis, Insights and Forecast - by Consumption Analysis
- 7.3. Market Analysis, Insights and Forecast - by Import Market Analysis (Value & Volume)
- 7.4. Market Analysis, Insights and Forecast - by Export Market Analysis (Value & Volume)
- 7.5. Market Analysis, Insights and Forecast - by Price Trend Analysis
- 8. South America Agricultural Fumigants Industry Analysis, Insights and Forecast, 2020-2032
- 8.1. Market Analysis, Insights and Forecast - by Production Analysis
- 8.2. Market Analysis, Insights and Forecast - by Consumption Analysis
- 8.3. Market Analysis, Insights and Forecast - by Import Market Analysis (Value & Volume)
- 8.4. Market Analysis, Insights and Forecast - by Export Market Analysis (Value & Volume)
- 8.5. Market Analysis, Insights and Forecast - by Price Trend Analysis
- 9. Europe Agricultural Fumigants Industry Analysis, Insights and Forecast, 2020-2032
- 9.1. Market Analysis, Insights and Forecast - by Production Analysis
- 9.2. Market Analysis, Insights and Forecast - by Consumption Analysis
- 9.3. Market Analysis, Insights and Forecast - by Import Market Analysis (Value & Volume)
- 9.4. Market Analysis, Insights and Forecast - by Export Market Analysis (Value & Volume)
- 9.5. Market Analysis, Insights and Forecast - by Price Trend Analysis
- 10. Middle East & Africa Agricultural Fumigants Industry Analysis, Insights and Forecast, 2020-2032
- 10.1. Market Analysis, Insights and Forecast - by Production Analysis
- 10.2. Market Analysis, Insights and Forecast - by Consumption Analysis
- 10.3. Market Analysis, Insights and Forecast - by Import Market Analysis (Value & Volume)
- 10.4. Market Analysis, Insights and Forecast - by Export Market Analysis (Value & Volume)
- 10.5. Market Analysis, Insights and Forecast - by Price Trend Analysis
- 11. Asia Pacific Agricultural Fumigants Industry Analysis, Insights and Forecast, 2020-2032
- 11.1. Market Analysis, Insights and Forecast - by Production Analysis
- 11.2. Market Analysis, Insights and Forecast - by Consumption Analysis
- 11.3. Market Analysis, Insights and Forecast - by Import Market Analysis (Value & Volume)
- 11.4. Market Analysis, Insights and Forecast - by Export Market Analysis (Value & Volume)
- 11.5. Market Analysis, Insights and Forecast - by Price Trend Analysis
- 12. Competitive Analysis
- 12.1. Company Profiles
- 12.1.1 VFC
- 12.1.1.1. Company Overview
- 12.1.1.2. Products
- 12.1.1.3. Company Financials
- 12.1.1.4. SWOT Analysis
- 12.1.2 FMC Corporation
- 12.1.2.1. Company Overview
- 12.1.2.2. Products
- 12.1.2.3. Company Financials
- 12.1.2.4. SWOT Analysis
- 12.1.3 ADAMA Agricultural Solution Ltd
- 12.1.3.1. Company Overview
- 12.1.3.2. Products
- 12.1.3.3. Company Financials
- 12.1.3.4. SWOT Analysis
- 12.1.4 TriEst Ag Group Inc
- 12.1.4.1. Company Overview
- 12.1.4.2. Products
- 12.1.4.3. Company Financials
- 12.1.4.4. SWOT Analysis
- 12.1.5 Trical Inc
- 12.1.5.1. Company Overview
- 12.1.5.2. Products
- 12.1.5.3. Company Financials
- 12.1.5.4. SWOT Analysis
- 12.1.6 Fumigation Services
- 12.1.6.1. Company Overview
- 12.1.6.2. Products
- 12.1.6.3. Company Financials
- 12.1.6.4. SWOT Analysis
- 12.1.7 Ikeda Kogyo Co Ltd
- 12.1.7.1. Company Overview
- 12.1.7.2. Products
- 12.1.7.3. Company Financials
- 12.1.7.4. SWOT Analysis
- 12.1.8 Detia Degesch GmbH
- 12.1.8.1. Company Overview
- 12.1.8.2. Products
- 12.1.8.3. Company Financials
- 12.1.8.4. SWOT Analysis
- 12.1.9 DowDuPont
- 12.1.9.1. Company Overview
- 12.1.9.2. Products
- 12.1.9.3. Company Financials
- 12.1.9.4. SWOT Analysis
- 12.1.10 Lanxess
- 12.1.10.1. Company Overview
- 12.1.10.2. Products
- 12.1.10.3. Company Financials
- 12.1.10.4. SWOT Analysis
- 12.1.11 Isagro SpA
- 12.1.11.1. Company Overview
- 12.1.11.2. Products
- 12.1.11.3. Company Financials
- 12.1.11.4. SWOT Analysis
- 12.1.12 Syngenta AG
- 12.1.12.1. Company Overview
- 12.1.12.2. Products
- 12.1.12.3. Company Financials
- 12.1.12.4. SWOT Analysis
- 12.1.13 UPL Group
- 12.1.13.1. Company Overview
- 12.1.13.2. Products
- 12.1.13.3. Company Financials
- 12.1.13.4. SWOT Analysis
- 12.1.14 Industrial Fumigation Compan
- 12.1.14.1. Company Overview
- 12.1.14.2. Products
- 12.1.14.3. Company Financials
- 12.1.14.4. SWOT Analysis
- 12.1.15 Industrial Fumigation Company
- 12.1.15.1. Company Overview
- 12.1.15.2. Products
- 12.1.15.3. Company Financials
- 12.1.15.4. SWOT Analysis
- 12.1.16 Amvac Chemical Corporation
- 12.1.16.1. Company Overview
- 12.1.16.2. Products
- 12.1.16.3. Company Financials
- 12.1.16.4. SWOT Analysis
- 12.1.17 Reddick Fumigants LLC
- 12.1.17.1. Company Overview
- 12.1.17.2. Products
- 12.1.17.3. Company Financials
- 12.1.17.4. SWOT Analysis
- 12.1.18 Cytec Solvay Group
- 12.1.18.1. Company Overview
- 12.1.18.2. Products
- 12.1.18.3. Company Financials
- 12.1.18.4. SWOT Analysis
- 12.1.19 BASF SE
- 12.1.19.1. Company Overview
- 12.1.19.2. Products
- 12.1.19.3. Company Financials
- 12.1.19.4. SWOT Analysis
- 12.1.1 VFC
- 12.2. Market Entropy
- 12.2.1 Company's Key Areas Served
- 12.2.2 Recent Developments
- 12.3. Company Market Share Analysis 2025
- 12.3.1 Top 5 Companies Market Share Analysis
- 12.3.2 Top 3 Companies Market Share Analysis
- 12.4. List of Potential Customers
- 13. Research Methodology
List of Figures
- Figure 1: Global Agricultural Fumigants Industry Revenue Breakdown (Million, %) by Region 2025 & 2033
- Figure 2: North America Agricultural Fumigants Industry Revenue (Million), by Production Analysis 2025 & 2033
- Figure 3: North America Agricultural Fumigants Industry Revenue Share (%), by Production Analysis 2025 & 2033
- Figure 4: North America Agricultural Fumigants Industry Revenue (Million), by Consumption Analysis 2025 & 2033
- Figure 5: North America Agricultural Fumigants Industry Revenue Share (%), by Consumption Analysis 2025 & 2033
- Figure 6: North America Agricultural Fumigants Industry Revenue (Million), by Import Market Analysis (Value & Volume) 2025 & 2033
- Figure 7: North America Agricultural Fumigants Industry Revenue Share (%), by Import Market Analysis (Value & Volume) 2025 & 2033
- Figure 8: North America Agricultural Fumigants Industry Revenue (Million), by Export Market Analysis (Value & Volume) 2025 & 2033
- Figure 9: North America Agricultural Fumigants Industry Revenue Share (%), by Export Market Analysis (Value & Volume) 2025 & 2033
- Figure 10: North America Agricultural Fumigants Industry Revenue (Million), by Price Trend Analysis 2025 & 2033
- Figure 11: North America Agricultural Fumigants Industry Revenue Share (%), by Price Trend Analysis 2025 & 2033
- Figure 12: North America Agricultural Fumigants Industry Revenue (Million), by Country 2025 & 2033
- Figure 13: North America Agricultural Fumigants Industry Revenue Share (%), by Country 2025 & 2033
- Figure 14: South America Agricultural Fumigants Industry Revenue (Million), by Production Analysis 2025 & 2033
- Figure 15: South America Agricultural Fumigants Industry Revenue Share (%), by Production Analysis 2025 & 2033
- Figure 16: South America Agricultural Fumigants Industry Revenue (Million), by Consumption Analysis 2025 & 2033
- Figure 17: South America Agricultural Fumigants Industry Revenue Share (%), by Consumption Analysis 2025 & 2033
- Figure 18: South America Agricultural Fumigants Industry Revenue (Million), by Import Market Analysis (Value & Volume) 2025 & 2033
- Figure 19: South America Agricultural Fumigants Industry Revenue Share (%), by Import Market Analysis (Value & Volume) 2025 & 2033
- Figure 20: South America Agricultural Fumigants Industry Revenue (Million), by Export Market Analysis (Value & Volume) 2025 & 2033
- Figure 21: South America Agricultural Fumigants Industry Revenue Share (%), by Export Market Analysis (Value & Volume) 2025 & 2033
- Figure 22: South America Agricultural Fumigants Industry Revenue (Million), by Price Trend Analysis 2025 & 2033
- Figure 23: South America Agricultural Fumigants Industry Revenue Share (%), by Price Trend Analysis 2025 & 2033
- Figure 24: South America Agricultural Fumigants Industry Revenue (Million), by Country 2025 & 2033
- Figure 25: South America Agricultural Fumigants Industry Revenue Share (%), by Country 2025 & 2033
- Figure 26: Europe Agricultural Fumigants Industry Revenue (Million), by Production Analysis 2025 & 2033
- Figure 27: Europe Agricultural Fumigants Industry Revenue Share (%), by Production Analysis 2025 & 2033
- Figure 28: Europe Agricultural Fumigants Industry Revenue (Million), by Consumption Analysis 2025 & 2033
- Figure 29: Europe Agricultural Fumigants Industry Revenue Share (%), by Consumption Analysis 2025 & 2033
- Figure 30: Europe Agricultural Fumigants Industry Revenue (Million), by Import Market Analysis (Value & Volume) 2025 & 2033
- Figure 31: Europe Agricultural Fumigants Industry Revenue Share (%), by Import Market Analysis (Value & Volume) 2025 & 2033
- Figure 32: Europe Agricultural Fumigants Industry Revenue (Million), by Export Market Analysis (Value & Volume) 2025 & 2033
- Figure 33: Europe Agricultural Fumigants Industry Revenue Share (%), by Export Market Analysis (Value & Volume) 2025 & 2033
- Figure 34: Europe Agricultural Fumigants Industry Revenue (Million), by Price Trend Analysis 2025 & 2033
- Figure 35: Europe Agricultural Fumigants Industry Revenue Share (%), by Price Trend Analysis 2025 & 2033
- Figure 36: Europe Agricultural Fumigants Industry Revenue (Million), by Country 2025 & 2033
- Figure 37: Europe Agricultural Fumigants Industry Revenue Share (%), by Country 2025 & 2033
- Figure 38: Middle East & Africa Agricultural Fumigants Industry Revenue (Million), by Production Analysis 2025 & 2033
- Figure 39: Middle East & Africa Agricultural Fumigants Industry Revenue Share (%), by Production Analysis 2025 & 2033
- Figure 40: Middle East & Africa Agricultural Fumigants Industry Revenue (Million), by Consumption Analysis 2025 & 2033
- Figure 41: Middle East & Africa Agricultural Fumigants Industry Revenue Share (%), by Consumption Analysis 2025 & 2033
- Figure 42: Middle East & Africa Agricultural Fumigants Industry Revenue (Million), by Import Market Analysis (Value & Volume) 2025 & 2033
- Figure 43: Middle East & Africa Agricultural Fumigants Industry Revenue Share (%), by Import Market Analysis (Value & Volume) 2025 & 2033
- Figure 44: Middle East & Africa Agricultural Fumigants Industry Revenue (Million), by Export Market Analysis (Value & Volume) 2025 & 2033
- Figure 45: Middle East & Africa Agricultural Fumigants Industry Revenue Share (%), by Export Market Analysis (Value & Volume) 2025 & 2033
- Figure 46: Middle East & Africa Agricultural Fumigants Industry Revenue (Million), by Price Trend Analysis 2025 & 2033
- Figure 47: Middle East & Africa Agricultural Fumigants Industry Revenue Share (%), by Price Trend Analysis 2025 & 2033
- Figure 48: Middle East & Africa Agricultural Fumigants Industry Revenue (Million), by Country 2025 & 2033
- Figure 49: Middle East & Africa Agricultural Fumigants Industry Revenue Share (%), by Country 2025 & 2033
- Figure 50: Asia Pacific Agricultural Fumigants Industry Revenue (Million), by Production Analysis 2025 & 2033
- Figure 51: Asia Pacific Agricultural Fumigants Industry Revenue Share (%), by Production Analysis 2025 & 2033
- Figure 52: Asia Pacific Agricultural Fumigants Industry Revenue (Million), by Consumption Analysis 2025 & 2033
- Figure 53: Asia Pacific Agricultural Fumigants Industry Revenue Share (%), by Consumption Analysis 2025 & 2033
- Figure 54: Asia Pacific Agricultural Fumigants Industry Revenue (Million), by Import Market Analysis (Value & Volume) 2025 & 2033
- Figure 55: Asia Pacific Agricultural Fumigants Industry Revenue Share (%), by Import Market Analysis (Value & Volume) 2025 & 2033
- Figure 56: Asia Pacific Agricultural Fumigants Industry Revenue (Million), by Export Market Analysis (Value & Volume) 2025 & 2033
- Figure 57: Asia Pacific Agricultural Fumigants Industry Revenue Share (%), by Export Market Analysis (Value & Volume) 2025 & 2033
- Figure 58: Asia Pacific Agricultural Fumigants Industry Revenue (Million), by Price Trend Analysis 2025 & 2033
- Figure 59: Asia Pacific Agricultural Fumigants Industry Revenue Share (%), by Price Trend Analysis 2025 & 2033
- Figure 60: Asia Pacific Agricultural Fumigants Industry Revenue (Million), by Country 2025 & 2033
- Figure 61: Asia Pacific Agricultural Fumigants Industry Revenue Share (%), by Country 2025 & 2033
List of Tables
- Table 1: Global Agricultural Fumigants Industry Revenue Million Forecast, by Production Analysis 2020 & 2033
- Table 2: Global Agricultural Fumigants Industry Revenue Million Forecast, by Consumption Analysis 2020 & 2033
- Table 3: Global Agricultural Fumigants Industry Revenue Million Forecast, by Import Market Analysis (Value & Volume) 2020 & 2033
- Table 4: Global Agricultural Fumigants Industry Revenue Million Forecast, by Export Market Analysis (Value & Volume) 2020 & 2033
- Table 5: Global Agricultural Fumigants Industry Revenue Million Forecast, by Price Trend Analysis 2020 & 2033
- Table 6: Global Agricultural Fumigants Industry Revenue Million Forecast, by Region 2020 & 2033
- Table 7: Global Agricultural Fumigants Industry Revenue Million Forecast, by Production Analysis 2020 & 2033
- Table 8: Global Agricultural Fumigants Industry Revenue Million Forecast, by Consumption Analysis 2020 & 2033
- Table 9: Global Agricultural Fumigants Industry Revenue Million Forecast, by Import Market Analysis (Value & Volume) 2020 & 2033
- Table 10: Global Agricultural Fumigants Industry Revenue Million Forecast, by Export Market Analysis (Value & Volume) 2020 & 2033
- Table 11: Global Agricultural Fumigants Industry Revenue Million Forecast, by Price Trend Analysis 2020 & 2033
- Table 12: Global Agricultural Fumigants Industry Revenue Million Forecast, by Country 2020 & 2033
- Table 13: United States Agricultural Fumigants Industry Revenue (Million) Forecast, by Application 2020 & 2033
- Table 14: Canada Agricultural Fumigants Industry Revenue (Million) Forecast, by Application 2020 & 2033
- Table 15: Mexico Agricultural Fumigants Industry Revenue (Million) Forecast, by Application 2020 & 2033
- Table 16: Global Agricultural Fumigants Industry Revenue Million Forecast, by Production Analysis 2020 & 2033
- Table 17: Global Agricultural Fumigants Industry Revenue Million Forecast, by Consumption Analysis 2020 & 2033
- Table 18: Global Agricultural Fumigants Industry Revenue Million Forecast, by Import Market Analysis (Value & Volume) 2020 & 2033
- Table 19: Global Agricultural Fumigants Industry Revenue Million Forecast, by Export Market Analysis (Value & Volume) 2020 & 2033
- Table 20: Global Agricultural Fumigants Industry Revenue Million Forecast, by Price Trend Analysis 2020 & 2033
- Table 21: Global Agricultural Fumigants Industry Revenue Million Forecast, by Country 2020 & 2033
- Table 22: Brazil Agricultural Fumigants Industry Revenue (Million) Forecast, by Application 2020 & 2033
- Table 23: Argentina Agricultural Fumigants Industry Revenue (Million) Forecast, by Application 2020 & 2033
- Table 24: Rest of South America Agricultural Fumigants Industry Revenue (Million) Forecast, by Application 2020 & 2033
- Table 25: Global Agricultural Fumigants Industry Revenue Million Forecast, by Production Analysis 2020 & 2033
- Table 26: Global Agricultural Fumigants Industry Revenue Million Forecast, by Consumption Analysis 2020 & 2033
- Table 27: Global Agricultural Fumigants Industry Revenue Million Forecast, by Import Market Analysis (Value & Volume) 2020 & 2033
- Table 28: Global Agricultural Fumigants Industry Revenue Million Forecast, by Export Market Analysis (Value & Volume) 2020 & 2033
- Table 29: Global Agricultural Fumigants Industry Revenue Million Forecast, by Price Trend Analysis 2020 & 2033
- Table 30: Global Agricultural Fumigants Industry Revenue Million Forecast, by Country 2020 & 2033
- Table 31: United Kingdom Agricultural Fumigants Industry Revenue (Million) Forecast, by Application 2020 & 2033
- Table 32: Germany Agricultural Fumigants Industry Revenue (Million) Forecast, by Application 2020 & 2033
- Table 33: France Agricultural Fumigants Industry Revenue (Million) Forecast, by Application 2020 & 2033
- Table 34: Italy Agricultural Fumigants Industry Revenue (Million) Forecast, by Application 2020 & 2033
- Table 35: Spain Agricultural Fumigants Industry Revenue (Million) Forecast, by Application 2020 & 2033
- Table 36: Russia Agricultural Fumigants Industry Revenue (Million) Forecast, by Application 2020 & 2033
- Table 37: Benelux Agricultural Fumigants Industry Revenue (Million) Forecast, by Application 2020 & 2033
- Table 38: Nordics Agricultural Fumigants Industry Revenue (Million) Forecast, by Application 2020 & 2033
- Table 39: Rest of Europe Agricultural Fumigants Industry Revenue (Million) Forecast, by Application 2020 & 2033
- Table 40: Global Agricultural Fumigants Industry Revenue Million Forecast, by Production Analysis 2020 & 2033
- Table 41: Global Agricultural Fumigants Industry Revenue Million Forecast, by Consumption Analysis 2020 & 2033
- Table 42: Global Agricultural Fumigants Industry Revenue Million Forecast, by Import Market Analysis (Value & Volume) 2020 & 2033
- Table 43: Global Agricultural Fumigants Industry Revenue Million Forecast, by Export Market Analysis (Value & Volume) 2020 & 2033
- Table 44: Global Agricultural Fumigants Industry Revenue Million Forecast, by Price Trend Analysis 2020 & 2033
- Table 45: Global Agricultural Fumigants Industry Revenue Million Forecast, by Country 2020 & 2033
- Table 46: Turkey Agricultural Fumigants Industry Revenue (Million) Forecast, by Application 2020 & 2033
- Table 47: Israel Agricultural Fumigants Industry Revenue (Million) Forecast, by Application 2020 & 2033
- Table 48: GCC Agricultural Fumigants Industry Revenue (Million) Forecast, by Application 2020 & 2033
- Table 49: North Africa Agricultural Fumigants Industry Revenue (Million) Forecast, by Application 2020 & 2033
- Table 50: South Africa Agricultural Fumigants Industry Revenue (Million) Forecast, by Application 2020 & 2033
- Table 51: Rest of Middle East & Africa Agricultural Fumigants Industry Revenue (Million) Forecast, by Application 2020 & 2033
- Table 52: Global Agricultural Fumigants Industry Revenue Million Forecast, by Production Analysis 2020 & 2033
- Table 53: Global Agricultural Fumigants Industry Revenue Million Forecast, by Consumption Analysis 2020 & 2033
- Table 54: Global Agricultural Fumigants Industry Revenue Million Forecast, by Import Market Analysis (Value & Volume) 2020 & 2033
- Table 55: Global Agricultural Fumigants Industry Revenue Million Forecast, by Export Market Analysis (Value & Volume) 2020 & 2033
- Table 56: Global Agricultural Fumigants Industry Revenue Million Forecast, by Price Trend Analysis 2020 & 2033
- Table 57: Global Agricultural Fumigants Industry Revenue Million Forecast, by Country 2020 & 2033
- Table 58: China Agricultural Fumigants Industry Revenue (Million) Forecast, by Application 2020 & 2033
- Table 59: India Agricultural Fumigants Industry Revenue (Million) Forecast, by Application 2020 & 2033
- Table 60: Japan Agricultural Fumigants Industry Revenue (Million) Forecast, by Application 2020 & 2033
- Table 61: South Korea Agricultural Fumigants Industry Revenue (Million) Forecast, by Application 2020 & 2033
- Table 62: ASEAN Agricultural Fumigants Industry Revenue (Million) Forecast, by Application 2020 & 2033
- Table 63: Oceania Agricultural Fumigants Industry Revenue (Million) Forecast, by Application 2020 & 2033
- Table 64: Rest of Asia Pacific Agricultural Fumigants Industry Revenue (Million) Forecast, by Application 2020 & 2033
Frequently Asked Questions
1. What is the projected Compound Annual Growth Rate (CAGR) of the Agricultural Fumigants Industry?
The projected CAGR is approximately 5.60%.
2. Which companies are prominent players in the Agricultural Fumigants Industry?
Key companies in the market include VFC, FMC Corporation, ADAMA Agricultural Solution Ltd, TriEst Ag Group Inc, Trical Inc, Fumigation Services, Ikeda Kogyo Co Ltd, Detia Degesch GmbH, DowDuPont, Lanxess, Isagro SpA, Syngenta AG, UPL Group, Industrial Fumigation Compan, Industrial Fumigation Company, Amvac Chemical Corporation, Reddick Fumigants LLC, Cytec Solvay Group, BASF SE.
3. What are the main segments of the Agricultural Fumigants Industry?
The market segments include Production Analysis, Consumption Analysis, Import Market Analysis (Value & Volume), Export Market Analysis (Value & Volume), Price Trend Analysis.
4. Can you provide details about the market size?
The market size is estimated to be USD 2.45 Million as of 2022.
5. What are some drivers contributing to market growth?
Low Availability of Skilled Labor; Technological Advancements.
6. What are the notable trends driving market growth?
Growing Agricultural Production.
7. Are there any restraints impacting market growth?
Increasing Farm Expenditure; Security Concerns in Modern Farming Machinery.
8. Can you provide examples of recent developments in the market?
N/A
9. What pricing options are available for accessing the report?
Pricing options include single-user, multi-user, and enterprise licenses priced at USD 4750, USD 5250, and USD 8750 respectively.
10. Is the market size provided in terms of value or volume?
The market size is provided in terms of value, measured in Million.
11. Are there any specific market keywords associated with the report?
Yes, the market keyword associated with the report is "Agricultural Fumigants Industry," which aids in identifying and referencing the specific market segment covered.
12. How do I determine which pricing option suits my needs best?
The pricing options vary based on user requirements and access needs. Individual users may opt for single-user licenses, while businesses requiring broader access may choose multi-user or enterprise licenses for cost-effective access to the report.
13. Are there any additional resources or data provided in the Agricultural Fumigants Industry report?
While the report offers comprehensive insights, it's advisable to review the specific contents or supplementary materials provided to ascertain if additional resources or data are available.
14. How can I stay updated on further developments or reports in the Agricultural Fumigants Industry?
To stay informed about further developments, trends, and reports in the Agricultural Fumigants Industry, consider subscribing to industry newsletters, following relevant companies and organizations, or regularly checking reputable industry news sources and publications.
Methodology
Step 1 - Identification of Relevant Samples Size from Population Database


Step 2 - Approaches for Defining Global Market Size (Value, Volume* & Price*)

Note*: In applicable scenarios
Step 3 - Data Sources
Primary Research
- Web Analytics
- Survey Reports
- Research Institute
- Latest Research Reports
- Opinion Leaders
Secondary Research
- Annual Reports
- White Paper
- Latest Press Release
- Industry Association
- Paid Database
- Investor Presentations

Step 4 - Data Triangulation
Involves using different sources of information in order to increase the validity of a study
These sources are likely to be stakeholders in a program - participants, other researchers, program staff, other community members, and so on.
Then we put all data in single framework & apply various statistical tools to find out the dynamic on the market.
During the analysis stage, feedback from the stakeholder groups would be compared to determine areas of agreement as well as areas of divergence