

Key Insights
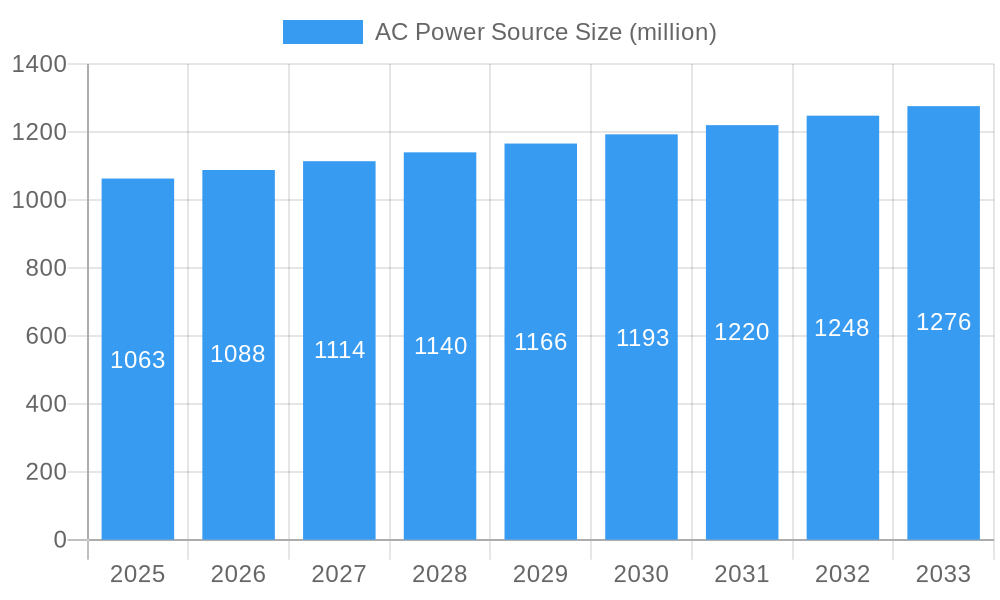
The global AC Power Source market is poised for steady growth, projected to reach an estimated market size of approximately USD 1063 million by 2025. This expansion is driven by the increasing demand for reliable and precise power solutions across a diverse range of industries. A key contributor to this growth is the escalating adoption of advanced manufacturing processes, particularly in sectors like automotive and electronics, where sophisticated testing and simulation are critical. Furthermore, the burgeoning aerospace industry's stringent requirements for high-performance and dependable power supplies are fueling demand. The energy sector, with its growing focus on renewable energy integration and grid modernization, also presents significant opportunities for AC power source manufacturers. The communication sector, constantly evolving with new technologies like 5G, requires robust and adaptable power infrastructure, further bolstering market expansion.
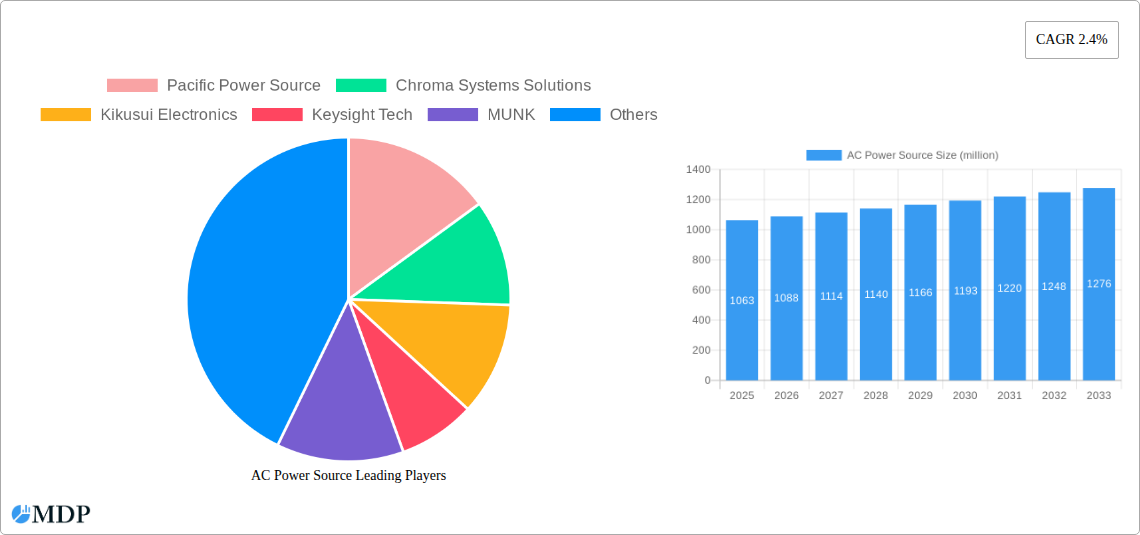
AC Power Source Market Size (In Billion)
The AC Power Source market is segmented into Linear AC Power Sources and PWM AC Power Sources, with applications spanning Manufacture Test, Aerospace, Energy, Communication, and Others. While Linear AC power sources offer high precision and low noise, essential for sensitive applications, the increasing demand for efficiency and compact designs is driving the adoption of PWM AC power sources. Geographically, North America and Europe are anticipated to remain dominant regions, owing to the presence of established industries and significant R&D investments. However, the Asia Pacific region is expected to exhibit the highest growth rate, propelled by rapid industrialization, increasing manufacturing capabilities in countries like China and India, and the expanding electronics and communication industries. Emerging trends include the development of smart and programmable AC power sources with enhanced connectivity and data logging capabilities, as well as a focus on energy-efficient solutions to meet environmental regulations and reduce operational costs.
AC Power Source Company Market Share
AC Power Source Market: Comprehensive Analysis and Future Outlook (2019-2033)
This in-depth report provides a comprehensive analysis of the global AC Power Source market, a critical component for various industrial and commercial applications. Spanning the historical period of 2019-2024, the base year of 2025, and a robust forecast period extending to 2033, this study offers unparalleled insights into market dynamics, technological advancements, and strategic opportunities. We examine the intricate interplay of demand drivers, emerging trends, and competitive landscapes to equip industry stakeholders with actionable intelligence. The report leverages high-traffic keywords such as "AC power supply," "programmable AC power," "laboratory power supply," "electronic load," "power testing," and "manufacturing automation" to ensure maximum search visibility for critical industry players and decision-makers.
AC Power Source Market Dynamics & Concentration
The AC Power Source market exhibits a moderate concentration, characterized by the presence of established global players alongside a growing number of specialized regional manufacturers. Innovation is primarily driven by the increasing demand for high-precision, energy-efficient, and compact AC power solutions across diverse applications. Regulatory frameworks, particularly those focused on safety, electromagnetic compatibility (EMC), and energy standards, play a significant role in shaping product development and market entry. Product substitutes are limited, given the inherent need for reliable AC power generation in testing and simulation environments. End-user trends indicate a strong preference for intelligent, software-controlled systems that facilitate automated testing and data acquisition. Mergers and acquisitions (M&A) activity is present, with larger entities acquiring smaller, innovative companies to expand their product portfolios and technological capabilities. For instance, the market share distribution sees key players holding significant portions, with an estimated xx M&A deals observed over the historical period, indicating consolidation and strategic expansion.
- Market Concentration: Moderate, with a mix of large multinational corporations and niche manufacturers.
- Innovation Drivers: Demand for precision, efficiency, automation, and miniaturization.
- Regulatory Frameworks: Emphasis on safety, EMC, and energy efficiency standards.
- Product Substitutes: Limited due to the specialized nature of AC power source applications.
- End-User Trends: Growing adoption of intelligent, software-driven testing solutions.
- M&A Activities: Present, focusing on acquiring technological expertise and market share, with an estimated xx M&A deals in recent years.
AC Power Source Industry Trends & Analysis
The AC Power Source industry is poised for significant growth, driven by the relentless pace of technological evolution and expanding application footprints. The Compound Annual Growth Rate (CAGR) is projected to be robust, estimated at an average of xx% over the forecast period (2025-2033). This growth is fueled by several key factors. Firstly, the ever-increasing complexity of electronic devices and systems necessitates sophisticated testing and validation, directly translating to a higher demand for advanced AC power sources. The proliferation of the Internet of Things (IoT) and the expansion of 5G infrastructure are creating new frontiers for AC power source utilization in manufacturing test and R&D. Furthermore, the aerospace and defense sectors continue to be major consumers, demanding highly reliable and ruggedized power solutions for critical applications. The energy sector, with its growing focus on renewable energy integration and grid modernization, also presents a substantial opportunity, requiring power sources for grid simulation and testing of energy storage systems.
Technological disruptions are continuously reshaping the market. The shift from traditional linear AC power sources to more efficient and compact Pulse Width Modulation (PWM) AC power sources is a prominent trend. PWM technology offers better power density, reduced heat generation, and enhanced control capabilities, making them increasingly attractive for various applications. Advancements in digital signal processing (DSP) and embedded control systems are enabling AC power sources to offer more intelligent features, including advanced waveform generation, real-time monitoring, and remote control capabilities. Consumer preferences are evolving towards integrated testing solutions that combine AC power sources with other test equipment, streamlining workflows and reducing overall testing time and cost. This trend is driving innovation in modular and scalable AC power source designs. The competitive dynamics within the industry are intensifying, with companies focusing on product differentiation through superior performance, enhanced feature sets, and robust customer support. Market penetration of advanced AC power solutions is expected to deepen across established and emerging economies as awareness and adoption of these technologies increase. The global market is estimated to reach a valuation of xx million by 2033, a testament to its sustained growth trajectory.
Leading Markets & Segments in AC Power Source
The global AC Power Source market is characterized by regional dominance and specific segment leadership, driven by a confluence of economic policies, technological adoption rates, and industry-specific demands.
Dominant Region and Country Analysis
The North America region, particularly the United States, currently holds a commanding position in the AC Power Source market. This dominance is attributed to a mature and innovation-driven industrial landscape, a strong presence of key end-user industries like aerospace, defense, and advanced manufacturing, and significant investments in research and development. Government initiatives supporting technological advancement and a robust ecosystem of testing and validation facilities further bolster its leadership.
- Key Drivers for North America's Dominance:
- Aerospace and Defense Sector: High demand for mission-critical, highly reliable AC power solutions.
- Advanced Manufacturing: Adoption of automated testing and quality control processes.
- R&D Investment: Significant funding for technological innovation and product development.
- Government Support: Policies encouraging technological advancement and industry growth.
While North America leads, the Asia-Pacific region is emerging as the fastest-growing market, propelled by the booming manufacturing sector in countries like China, South Korea, and Japan, coupled with increasing investments in communication infrastructure and renewable energy. The growing demand for sophisticated testing equipment in the consumer electronics, automotive, and telecommunications industries is a significant catalyst.
Application Segment Dominance
The Manufacture Test segment is the largest and most influential application for AC Power Sources. This is due to the indispensable role these devices play in the quality assurance, performance validation, and reliability testing of a vast array of electronic components, devices, and systems before they enter the market. The increasing complexity of manufactured goods, coupled with stringent quality control standards across industries, directly fuels the demand for precise and versatile AC power testing solutions.
- Key Drivers for Manufacture Test Dominance:
- Quality Control and Assurance: Essential for validating product performance and reliability.
- Product Development Cycles: Crucial for iterative testing and design refinement.
- Automation Integration: Increasingly integrated into automated test equipment (ATE) systems.
- Global Manufacturing Hubs: Concentration of manufacturing activities worldwide.
Other significant application segments include Aerospace, where the need for highly reliable and fault-tolerant power sources for avionics and control systems is paramount, and Energy, driven by the testing of renewable energy inverters, grid simulation, and energy storage solutions. The Communication sector also contributes significantly, particularly with the rollout of 5G and the expansion of data centers.
Type Segment Dominance
Within the types of AC Power Sources, PWM AC Power Sources are gaining considerable traction and are projected to dominate the market. Their inherent advantages in terms of efficiency, power density, smaller footprint, and superior control capabilities make them more appealing than traditional linear AC power sources, especially for modern, compact electronic designs and high-power applications.
- Key Drivers for PWM AC Power Source Dominance:
- Higher Efficiency: Reduced energy consumption and heat dissipation.
- Improved Power Density: Smaller form factors for space-constrained applications.
- Advanced Control Features: Precise waveform generation and dynamic response.
- Cost-Effectiveness: Lower operational costs over their lifespan.
While PWM sources lead, Linear AC Power Sources continue to hold a strong position in niche applications where absolute waveform purity and extremely low noise are critical, such as in certain scientific research and high-fidelity audio testing scenarios.
AC Power Source Product Developments
Recent product developments in the AC Power Source market highlight a strong emphasis on enhanced intelligence, increased power density, and greater flexibility. Manufacturers are integrating advanced digital control technologies, enabling sophisticated waveform generation, faster transient response, and comprehensive data logging capabilities for detailed analysis. Innovations in modular design are allowing users to scale power output by paralleling units, offering cost-effective solutions for evolving testing needs. Furthermore, the integration of advanced software interfaces and communication protocols is facilitating seamless integration into automated test systems, improving workflow efficiency and reducing test times. These advancements are driven by the demand for more precise, reliable, and user-friendly power testing solutions across a wide spectrum of industries, including aerospace, automotive, and renewable energy.
Key Drivers of AC Power Source Growth
The growth of the AC Power Source market is propelled by a robust set of drivers. Technological advancements are paramount, with the continuous evolution of electronic devices and systems demanding increasingly sophisticated and precise power testing capabilities. The burgeoning demand for automation in manufacturing processes across diverse sectors, including automotive, aerospace, and consumer electronics, directly translates into a higher need for reliable AC power sources for testing and validation. Economic factors, such as increasing global manufacturing output and infrastructure development, particularly in emerging economies, further stimulate market expansion. Regulatory mandates for product safety, quality, and energy efficiency also play a crucial role, compelling manufacturers to invest in advanced testing equipment.
- Technological Advancements: Development of complex electronic systems requiring precise power testing.
- Manufacturing Automation: Integration of AC power sources into automated test equipment (ATE).
- Economic Growth: Expansion of global manufacturing and infrastructure projects.
- Regulatory Compliance: Stricter standards for product safety and energy efficiency.
Challenges in the AC Power Source Market
Despite robust growth, the AC Power Source market faces several challenges. The high cost of advanced, high-precision AC power sources can be a significant barrier to entry for smaller enterprises, limiting market penetration in cost-sensitive regions or applications. Intense competition among established players and emerging manufacturers leads to price pressures, potentially impacting profit margins. Furthermore, the complexity of integrating these sophisticated power sources into existing test infrastructures can require specialized expertise, posing a challenge for some end-users. Supply chain disruptions, particularly for specialized electronic components, can also impact production lead times and availability, affecting market responsiveness.
- High Initial Investment Cost: Limiting adoption for smaller businesses.
- Intense Market Competition: Leading to price erosion.
- Integration Complexity: Requiring specialized technical expertise.
- Supply Chain Vulnerabilities: Potential for component shortages and production delays.
Emerging Opportunities in AC Power Source
The AC Power Source market is ripe with emerging opportunities, driven by key technological breakthroughs and expanding market frontiers. The rapid growth of the electric vehicle (EV) market presents a significant opportunity, demanding robust AC power sources for testing EV powertrains, battery management systems, and charging infrastructure. The ongoing expansion of 5G networks and the proliferation of IoT devices are creating a substantial demand for testing solutions in the telecommunications sector. Furthermore, the increasing focus on renewable energy integration and smart grid technologies necessitates advanced AC power sources for grid simulation, inverter testing, and energy storage system validation. Strategic partnerships between AC power source manufacturers and ATE providers are also emerging as a key opportunity, fostering the development of comprehensive, end-to-end testing solutions.
Leading Players in the AC Power Source Sector
- Pacific Power Source
- Chroma Systems Solutions
- Kikusui Electronics
- Keysight Technologies
- MUNK
- Preen (AC Power Corp.)
- B&K Precision Corp
- AMETEK Programmable Power
- Matsusada Precision
- Ainuo Instrument
- Behlman Electronics
- Jingtong Regulator
- NF Holdings Corp
- ITECH
Key Milestones in AC Power Source Industry
- 2019: Introduction of highly energy-efficient PWM AC power sources with improved power density.
- 2020: Increased integration of AI and machine learning for predictive maintenance and optimized testing in AC power sources.
- 2021: Significant advancements in modular AC power source designs enabling scalable power solutions.
- 2022: Growing adoption of cloud-based control and data management for AC power testing platforms.
- 2023: Enhanced focus on cybersecurity features within AC power source software interfaces.
- 2024: Emergence of compact and portable AC power sources for field testing applications.
Strategic Outlook for AC Power Source Market
The strategic outlook for the AC Power Source market is highly optimistic, with continued strong growth anticipated. Key growth accelerators include the ongoing digital transformation across industries, driving demand for sophisticated automated testing solutions. The expanding electric vehicle (EV) and renewable energy sectors will continue to be major demand drivers, requiring specialized power testing capabilities. Strategic opportunities lie in developing intelligent, software-defined AC power sources that offer greater flexibility, remote accessibility, and seamless integration into Industry 4.0 environments. Furthermore, focusing on high-power density, energy-efficient solutions, and catering to niche application requirements in aerospace and defense will be crucial for sustained market leadership. Collaboration and partnerships with end-users and ATE providers will be essential to deliver comprehensive testing ecosystems.
AC Power Source Segmentation
-
1. Application
- 1.1. Manufacture Test
- 1.2. Aerospace
- 1.3. Energy
- 1.4. Communication
- 1.5. Others
-
2. Types
- 2.1. Linear AC Power Sources
- 2.2. PWM AC Power Sources
AC Power Source Segmentation By Geography
-
1. North America
- 1.1. United States
- 1.2. Canada
- 1.3. Mexico
-
2. South America
- 2.1. Brazil
- 2.2. Argentina
- 2.3. Rest of South America
-
3. Europe
- 3.1. United Kingdom
- 3.2. Germany
- 3.3. France
- 3.4. Italy
- 3.5. Spain
- 3.6. Russia
- 3.7. Benelux
- 3.8. Nordics
- 3.9. Rest of Europe
-
4. Middle East & Africa
- 4.1. Turkey
- 4.2. Israel
- 4.3. GCC
- 4.4. North Africa
- 4.5. South Africa
- 4.6. Rest of Middle East & Africa
-
5. Asia Pacific
- 5.1. China
- 5.2. India
- 5.3. Japan
- 5.4. South Korea
- 5.5. ASEAN
- 5.6. Oceania
- 5.7. Rest of Asia Pacific
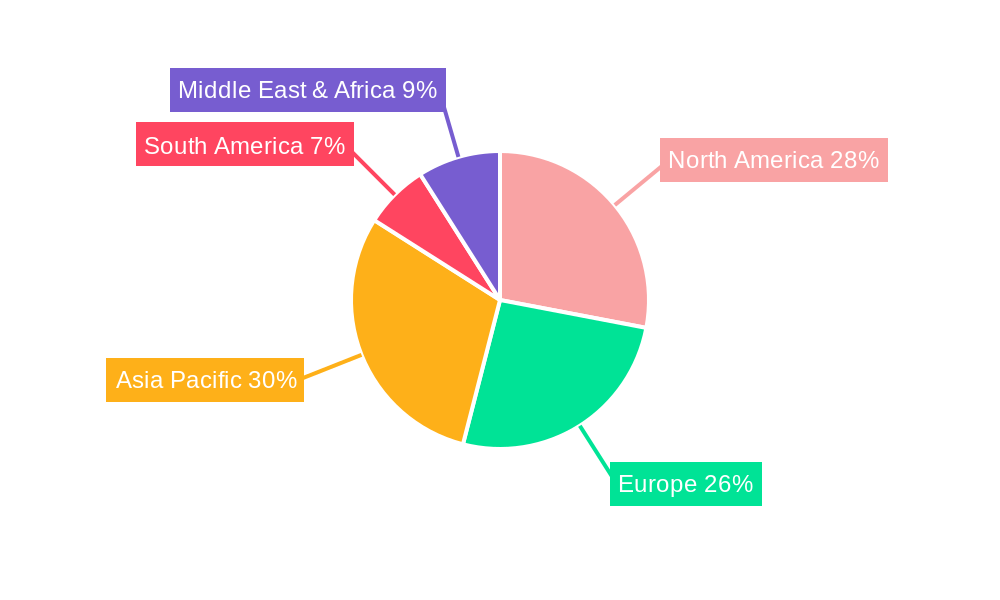
AC Power Source Regional Market Share
Geographic Coverage of AC Power Source
AC Power Source REPORT HIGHLIGHTS
| Aspects | Details |
|---|---|
| Study Period | 2020-2034 |
| Base Year | 2025 |
| Estimated Year | 2026 |
| Forecast Period | 2026-2034 |
| Historical Period | 2020-2025 |
| Growth Rate | CAGR of 2.4% from 2020-2034 |
| Segmentation |
|
Table of Contents
- 1. Introduction
- 1.1. Research Scope
- 1.2. Market Segmentation
- 1.3. Research Objective
- 1.4. Definitions and Assumptions
- 2. Executive Summary
- 2.1. Market Snapshot
- 3. Market Dynamics
- 3.1. Market Drivers
- 3.2. Market Restrains
- 3.3. Market Trends
- 3.4. Market Opportunities
- 4. Market Factor Analysis
- 4.1. Porters Five Forces
- 4.1.1. Bargaining Power of Suppliers
- 4.1.2. Bargaining Power of Buyers
- 4.1.3. Threat of New Entrants
- 4.1.4. Threat of Substitutes
- 4.1.5. Competitive Rivalry
- 4.2. PESTEL analysis
- 4.3. BCG Analysis
- 4.3.1. Stars (High Growth, High Market Share)
- 4.3.2. Cash Cows (Low Growth, High Market Share)
- 4.3.3. Question Mark (High Growth, Low Market Share)
- 4.3.4. Dogs (Low Growth, Low Market Share)
- 4.4. Ansoff Matrix Analysis
- 4.5. Supply Chain Analysis
- 4.6. Regulatory Landscape
- 4.7. Current Market Potential and Opportunity Assessment (TAM–SAM–SOM Framework)
- 4.8. MDP Analyst Note
- 4.1. Porters Five Forces
- 5. Market Analysis, Insights and Forecast 2021-2033
- 5.1. Market Analysis, Insights and Forecast - by Application
- 5.1.1. Manufacture Test
- 5.1.2. Aerospace
- 5.1.3. Energy
- 5.1.4. Communication
- 5.1.5. Others
- 5.2. Market Analysis, Insights and Forecast - by Types
- 5.2.1. Linear AC Power Sources
- 5.2.2. PWM AC Power Sources
- 5.3. Market Analysis, Insights and Forecast - by Region
- 5.3.1. North America
- 5.3.2. South America
- 5.3.3. Europe
- 5.3.4. Middle East & Africa
- 5.3.5. Asia Pacific
- 5.1. Market Analysis, Insights and Forecast - by Application
- 6. Global AC Power Source Analysis, Insights and Forecast, 2021-2033
- 6.1. Market Analysis, Insights and Forecast - by Application
- 6.1.1. Manufacture Test
- 6.1.2. Aerospace
- 6.1.3. Energy
- 6.1.4. Communication
- 6.1.5. Others
- 6.2. Market Analysis, Insights and Forecast - by Types
- 6.2.1. Linear AC Power Sources
- 6.2.2. PWM AC Power Sources
- 6.1. Market Analysis, Insights and Forecast - by Application
- 7. North America AC Power Source Analysis, Insights and Forecast, 2020-2032
- 7.1. Market Analysis, Insights and Forecast - by Application
- 7.1.1. Manufacture Test
- 7.1.2. Aerospace
- 7.1.3. Energy
- 7.1.4. Communication
- 7.1.5. Others
- 7.2. Market Analysis, Insights and Forecast - by Types
- 7.2.1. Linear AC Power Sources
- 7.2.2. PWM AC Power Sources
- 7.1. Market Analysis, Insights and Forecast - by Application
- 8. South America AC Power Source Analysis, Insights and Forecast, 2020-2032
- 8.1. Market Analysis, Insights and Forecast - by Application
- 8.1.1. Manufacture Test
- 8.1.2. Aerospace
- 8.1.3. Energy
- 8.1.4. Communication
- 8.1.5. Others
- 8.2. Market Analysis, Insights and Forecast - by Types
- 8.2.1. Linear AC Power Sources
- 8.2.2. PWM AC Power Sources
- 8.1. Market Analysis, Insights and Forecast - by Application
- 9. Europe AC Power Source Analysis, Insights and Forecast, 2020-2032
- 9.1. Market Analysis, Insights and Forecast - by Application
- 9.1.1. Manufacture Test
- 9.1.2. Aerospace
- 9.1.3. Energy
- 9.1.4. Communication
- 9.1.5. Others
- 9.2. Market Analysis, Insights and Forecast - by Types
- 9.2.1. Linear AC Power Sources
- 9.2.2. PWM AC Power Sources
- 9.1. Market Analysis, Insights and Forecast - by Application
- 10. Middle East & Africa AC Power Source Analysis, Insights and Forecast, 2020-2032
- 10.1. Market Analysis, Insights and Forecast - by Application
- 10.1.1. Manufacture Test
- 10.1.2. Aerospace
- 10.1.3. Energy
- 10.1.4. Communication
- 10.1.5. Others
- 10.2. Market Analysis, Insights and Forecast - by Types
- 10.2.1. Linear AC Power Sources
- 10.2.2. PWM AC Power Sources
- 10.1. Market Analysis, Insights and Forecast - by Application
- 11. Asia Pacific AC Power Source Analysis, Insights and Forecast, 2020-2032
- 11.1. Market Analysis, Insights and Forecast - by Application
- 11.1.1. Manufacture Test
- 11.1.2. Aerospace
- 11.1.3. Energy
- 11.1.4. Communication
- 11.1.5. Others
- 11.2. Market Analysis, Insights and Forecast - by Types
- 11.2.1. Linear AC Power Sources
- 11.2.2. PWM AC Power Sources
- 11.1. Market Analysis, Insights and Forecast - by Application
- 12. Competitive Analysis
- 12.1. Company Profiles
- 12.1.1 Pacific Power Source
- 12.1.1.1. Company Overview
- 12.1.1.2. Products
- 12.1.1.3. Company Financials
- 12.1.1.4. SWOT Analysis
- 12.1.2 Chroma Systems Solutions
- 12.1.2.1. Company Overview
- 12.1.2.2. Products
- 12.1.2.3. Company Financials
- 12.1.2.4. SWOT Analysis
- 12.1.3 Kikusui Electronics
- 12.1.3.1. Company Overview
- 12.1.3.2. Products
- 12.1.3.3. Company Financials
- 12.1.3.4. SWOT Analysis
- 12.1.4 Keysight Tech
- 12.1.4.1. Company Overview
- 12.1.4.2. Products
- 12.1.4.3. Company Financials
- 12.1.4.4. SWOT Analysis
- 12.1.5 MUNK
- 12.1.5.1. Company Overview
- 12.1.5.2. Products
- 12.1.5.3. Company Financials
- 12.1.5.4. SWOT Analysis
- 12.1.6 Preen (AC Power Corp.)
- 12.1.6.1. Company Overview
- 12.1.6.2. Products
- 12.1.6.3. Company Financials
- 12.1.6.4. SWOT Analysis
- 12.1.7 B&K Precision Corp
- 12.1.7.1. Company Overview
- 12.1.7.2. Products
- 12.1.7.3. Company Financials
- 12.1.7.4. SWOT Analysis
- 12.1.8 AMETEK Programmable Power
- 12.1.8.1. Company Overview
- 12.1.8.2. Products
- 12.1.8.3. Company Financials
- 12.1.8.4. SWOT Analysis
- 12.1.9 Matsusada Precision
- 12.1.9.1. Company Overview
- 12.1.9.2. Products
- 12.1.9.3. Company Financials
- 12.1.9.4. SWOT Analysis
- 12.1.10 Ainuo Instrument
- 12.1.10.1. Company Overview
- 12.1.10.2. Products
- 12.1.10.3. Company Financials
- 12.1.10.4. SWOT Analysis
- 12.1.11 Behlman Electronics
- 12.1.11.1. Company Overview
- 12.1.11.2. Products
- 12.1.11.3. Company Financials
- 12.1.11.4. SWOT Analysis
- 12.1.12 Jingtong Regulator
- 12.1.12.1. Company Overview
- 12.1.12.2. Products
- 12.1.12.3. Company Financials
- 12.1.12.4. SWOT Analysis
- 12.1.13 NF Holdings Corp
- 12.1.13.1. Company Overview
- 12.1.13.2. Products
- 12.1.13.3. Company Financials
- 12.1.13.4. SWOT Analysis
- 12.1.14 ITECH
- 12.1.14.1. Company Overview
- 12.1.14.2. Products
- 12.1.14.3. Company Financials
- 12.1.14.4. SWOT Analysis
- 12.1.1 Pacific Power Source
- 12.2. Market Entropy
- 12.2.1 Company's Key Areas Served
- 12.2.2 Recent Developments
- 12.3. Company Market Share Analysis 2025
- 12.3.1 Top 5 Companies Market Share Analysis
- 12.3.2 Top 3 Companies Market Share Analysis
- 12.4. List of Potential Customers
- 13. Research Methodology
List of Figures
- Figure 1: Global AC Power Source Revenue Breakdown (million, %) by Region 2025 & 2033
- Figure 2: North America AC Power Source Revenue (million), by Application 2025 & 2033
- Figure 3: North America AC Power Source Revenue Share (%), by Application 2025 & 2033
- Figure 4: North America AC Power Source Revenue (million), by Types 2025 & 2033
- Figure 5: North America AC Power Source Revenue Share (%), by Types 2025 & 2033
- Figure 6: North America AC Power Source Revenue (million), by Country 2025 & 2033
- Figure 7: North America AC Power Source Revenue Share (%), by Country 2025 & 2033
- Figure 8: South America AC Power Source Revenue (million), by Application 2025 & 2033
- Figure 9: South America AC Power Source Revenue Share (%), by Application 2025 & 2033
- Figure 10: South America AC Power Source Revenue (million), by Types 2025 & 2033
- Figure 11: South America AC Power Source Revenue Share (%), by Types 2025 & 2033
- Figure 12: South America AC Power Source Revenue (million), by Country 2025 & 2033
- Figure 13: South America AC Power Source Revenue Share (%), by Country 2025 & 2033
- Figure 14: Europe AC Power Source Revenue (million), by Application 2025 & 2033
- Figure 15: Europe AC Power Source Revenue Share (%), by Application 2025 & 2033
- Figure 16: Europe AC Power Source Revenue (million), by Types 2025 & 2033
- Figure 17: Europe AC Power Source Revenue Share (%), by Types 2025 & 2033
- Figure 18: Europe AC Power Source Revenue (million), by Country 2025 & 2033
- Figure 19: Europe AC Power Source Revenue Share (%), by Country 2025 & 2033
- Figure 20: Middle East & Africa AC Power Source Revenue (million), by Application 2025 & 2033
- Figure 21: Middle East & Africa AC Power Source Revenue Share (%), by Application 2025 & 2033
- Figure 22: Middle East & Africa AC Power Source Revenue (million), by Types 2025 & 2033
- Figure 23: Middle East & Africa AC Power Source Revenue Share (%), by Types 2025 & 2033
- Figure 24: Middle East & Africa AC Power Source Revenue (million), by Country 2025 & 2033
- Figure 25: Middle East & Africa AC Power Source Revenue Share (%), by Country 2025 & 2033
- Figure 26: Asia Pacific AC Power Source Revenue (million), by Application 2025 & 2033
- Figure 27: Asia Pacific AC Power Source Revenue Share (%), by Application 2025 & 2033
- Figure 28: Asia Pacific AC Power Source Revenue (million), by Types 2025 & 2033
- Figure 29: Asia Pacific AC Power Source Revenue Share (%), by Types 2025 & 2033
- Figure 30: Asia Pacific AC Power Source Revenue (million), by Country 2025 & 2033
- Figure 31: Asia Pacific AC Power Source Revenue Share (%), by Country 2025 & 2033
List of Tables
- Table 1: Global AC Power Source Revenue million Forecast, by Application 2020 & 2033
- Table 2: Global AC Power Source Revenue million Forecast, by Types 2020 & 2033
- Table 3: Global AC Power Source Revenue million Forecast, by Region 2020 & 2033
- Table 4: Global AC Power Source Revenue million Forecast, by Application 2020 & 2033
- Table 5: Global AC Power Source Revenue million Forecast, by Types 2020 & 2033
- Table 6: Global AC Power Source Revenue million Forecast, by Country 2020 & 2033
- Table 7: United States AC Power Source Revenue (million) Forecast, by Application 2020 & 2033
- Table 8: Canada AC Power Source Revenue (million) Forecast, by Application 2020 & 2033
- Table 9: Mexico AC Power Source Revenue (million) Forecast, by Application 2020 & 2033
- Table 10: Global AC Power Source Revenue million Forecast, by Application 2020 & 2033
- Table 11: Global AC Power Source Revenue million Forecast, by Types 2020 & 2033
- Table 12: Global AC Power Source Revenue million Forecast, by Country 2020 & 2033
- Table 13: Brazil AC Power Source Revenue (million) Forecast, by Application 2020 & 2033
- Table 14: Argentina AC Power Source Revenue (million) Forecast, by Application 2020 & 2033
- Table 15: Rest of South America AC Power Source Revenue (million) Forecast, by Application 2020 & 2033
- Table 16: Global AC Power Source Revenue million Forecast, by Application 2020 & 2033
- Table 17: Global AC Power Source Revenue million Forecast, by Types 2020 & 2033
- Table 18: Global AC Power Source Revenue million Forecast, by Country 2020 & 2033
- Table 19: United Kingdom AC Power Source Revenue (million) Forecast, by Application 2020 & 2033
- Table 20: Germany AC Power Source Revenue (million) Forecast, by Application 2020 & 2033
- Table 21: France AC Power Source Revenue (million) Forecast, by Application 2020 & 2033
- Table 22: Italy AC Power Source Revenue (million) Forecast, by Application 2020 & 2033
- Table 23: Spain AC Power Source Revenue (million) Forecast, by Application 2020 & 2033
- Table 24: Russia AC Power Source Revenue (million) Forecast, by Application 2020 & 2033
- Table 25: Benelux AC Power Source Revenue (million) Forecast, by Application 2020 & 2033
- Table 26: Nordics AC Power Source Revenue (million) Forecast, by Application 2020 & 2033
- Table 27: Rest of Europe AC Power Source Revenue (million) Forecast, by Application 2020 & 2033
- Table 28: Global AC Power Source Revenue million Forecast, by Application 2020 & 2033
- Table 29: Global AC Power Source Revenue million Forecast, by Types 2020 & 2033
- Table 30: Global AC Power Source Revenue million Forecast, by Country 2020 & 2033
- Table 31: Turkey AC Power Source Revenue (million) Forecast, by Application 2020 & 2033
- Table 32: Israel AC Power Source Revenue (million) Forecast, by Application 2020 & 2033
- Table 33: GCC AC Power Source Revenue (million) Forecast, by Application 2020 & 2033
- Table 34: North Africa AC Power Source Revenue (million) Forecast, by Application 2020 & 2033
- Table 35: South Africa AC Power Source Revenue (million) Forecast, by Application 2020 & 2033
- Table 36: Rest of Middle East & Africa AC Power Source Revenue (million) Forecast, by Application 2020 & 2033
- Table 37: Global AC Power Source Revenue million Forecast, by Application 2020 & 2033
- Table 38: Global AC Power Source Revenue million Forecast, by Types 2020 & 2033
- Table 39: Global AC Power Source Revenue million Forecast, by Country 2020 & 2033
- Table 40: China AC Power Source Revenue (million) Forecast, by Application 2020 & 2033
- Table 41: India AC Power Source Revenue (million) Forecast, by Application 2020 & 2033
- Table 42: Japan AC Power Source Revenue (million) Forecast, by Application 2020 & 2033
- Table 43: South Korea AC Power Source Revenue (million) Forecast, by Application 2020 & 2033
- Table 44: ASEAN AC Power Source Revenue (million) Forecast, by Application 2020 & 2033
- Table 45: Oceania AC Power Source Revenue (million) Forecast, by Application 2020 & 2033
- Table 46: Rest of Asia Pacific AC Power Source Revenue (million) Forecast, by Application 2020 & 2033
Frequently Asked Questions
1. What is the projected Compound Annual Growth Rate (CAGR) of the AC Power Source?
The projected CAGR is approximately 2.4%.
2. Which companies are prominent players in the AC Power Source?
Key companies in the market include Pacific Power Source, Chroma Systems Solutions, Kikusui Electronics, Keysight Tech, MUNK, Preen (AC Power Corp.), B&K Precision Corp, AMETEK Programmable Power, Matsusada Precision, Ainuo Instrument, Behlman Electronics, Jingtong Regulator, NF Holdings Corp, ITECH.
3. What are the main segments of the AC Power Source?
The market segments include Application, Types.
4. Can you provide details about the market size?
The market size is estimated to be USD 1063 million as of 2022.
5. What are some drivers contributing to market growth?
N/A
6. What are the notable trends driving market growth?
N/A
7. Are there any restraints impacting market growth?
N/A
8. Can you provide examples of recent developments in the market?
N/A
9. What pricing options are available for accessing the report?
Pricing options include single-user, multi-user, and enterprise licenses priced at USD 2900.00, USD 4350.00, and USD 5800.00 respectively.
10. Is the market size provided in terms of value or volume?
The market size is provided in terms of value, measured in million.
11. Are there any specific market keywords associated with the report?
Yes, the market keyword associated with the report is "AC Power Source," which aids in identifying and referencing the specific market segment covered.
12. How do I determine which pricing option suits my needs best?
The pricing options vary based on user requirements and access needs. Individual users may opt for single-user licenses, while businesses requiring broader access may choose multi-user or enterprise licenses for cost-effective access to the report.
13. Are there any additional resources or data provided in the AC Power Source report?
While the report offers comprehensive insights, it's advisable to review the specific contents or supplementary materials provided to ascertain if additional resources or data are available.
14. How can I stay updated on further developments or reports in the AC Power Source?
To stay informed about further developments, trends, and reports in the AC Power Source, consider subscribing to industry newsletters, following relevant companies and organizations, or regularly checking reputable industry news sources and publications.
Methodology
Step 1 - Identification of Relevant Samples Size from Population Database


Step 2 - Approaches for Defining Global Market Size (Value, Volume* & Price*)

Note*: In applicable scenarios
Step 3 - Data Sources
Primary Research
- Web Analytics
- Survey Reports
- Research Institute
- Latest Research Reports
- Opinion Leaders
Secondary Research
- Annual Reports
- White Paper
- Latest Press Release
- Industry Association
- Paid Database
- Investor Presentations

Step 4 - Data Triangulation
Involves using different sources of information in order to increase the validity of a study
These sources are likely to be stakeholders in a program - participants, other researchers, program staff, other community members, and so on.
Then we put all data in single framework & apply various statistical tools to find out the dynamic on the market.
During the analysis stage, feedback from the stakeholder groups would be compared to determine areas of agreement as well as areas of divergence