

Key Insights
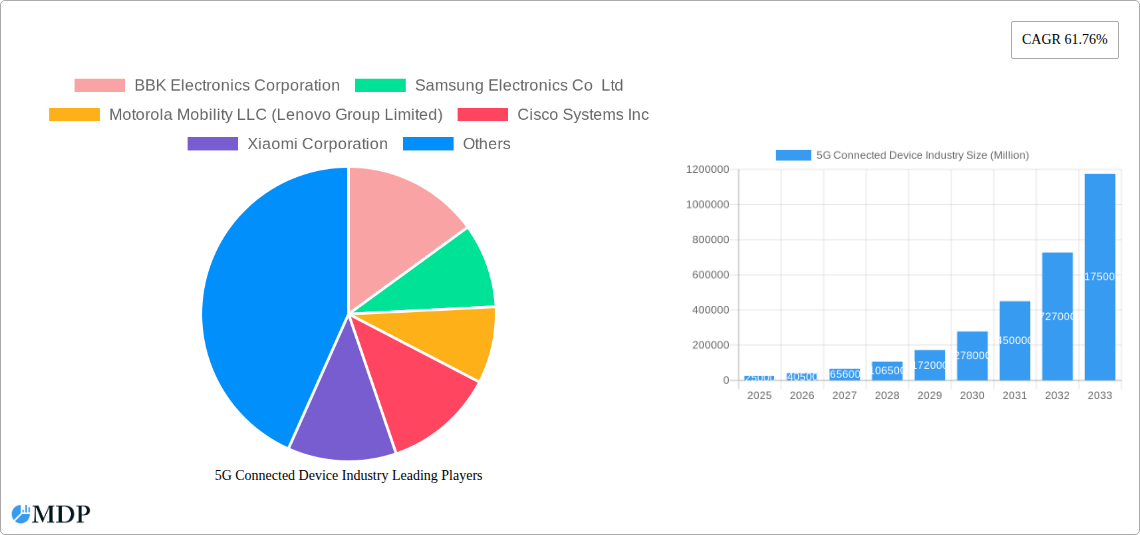
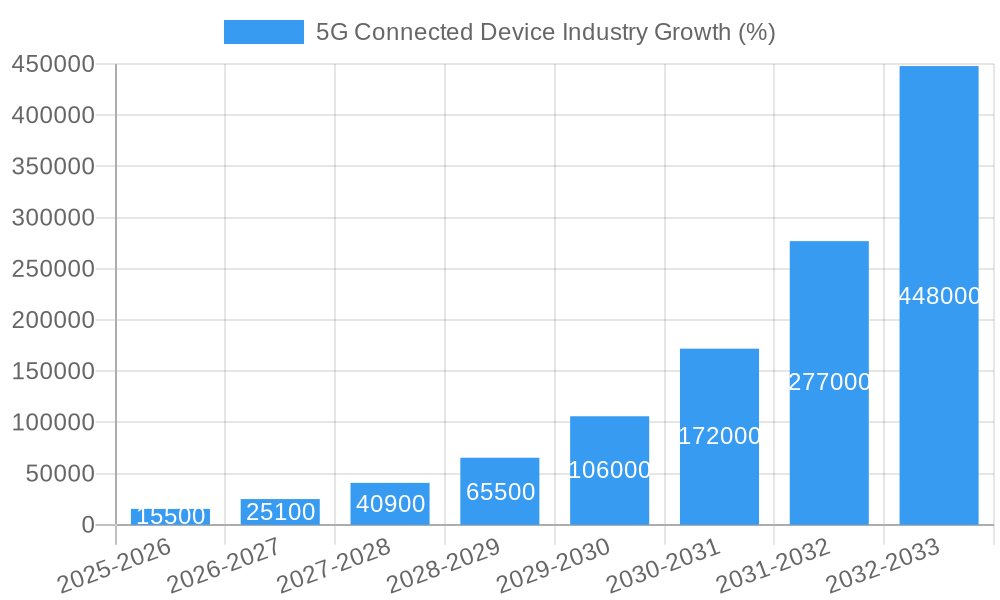
The 5G connected device market is experiencing explosive growth, driven by increasing smartphone adoption, the proliferation of IoT devices, and the expanding availability of 5G networks globally. The market's Compound Annual Growth Rate (CAGR) of 61.76% from 2019-2024 suggests a rapid expansion, and while this rate may moderate slightly in the coming years due to market saturation effects, significant growth is expected to continue throughout the forecast period (2025-2033). Key growth drivers include the increasing demand for high-bandwidth applications like augmented reality (AR), virtual reality (VR), and cloud gaming, along with the development of innovative applications in sectors such as healthcare, manufacturing, and autonomous vehicles. The diverse range of form factors, including smartphones, CPE devices, modules, and industrial-grade routers, further fuels market expansion. Sub-6 GHz remains the dominant spectrum band currently, but mmWave technology is expected to gain traction as infrastructure matures and device costs decline. Competition among major players like Samsung, BBK Electronics, and Huawei is fierce, leading to continuous innovation and price reductions, thereby accelerating market penetration.
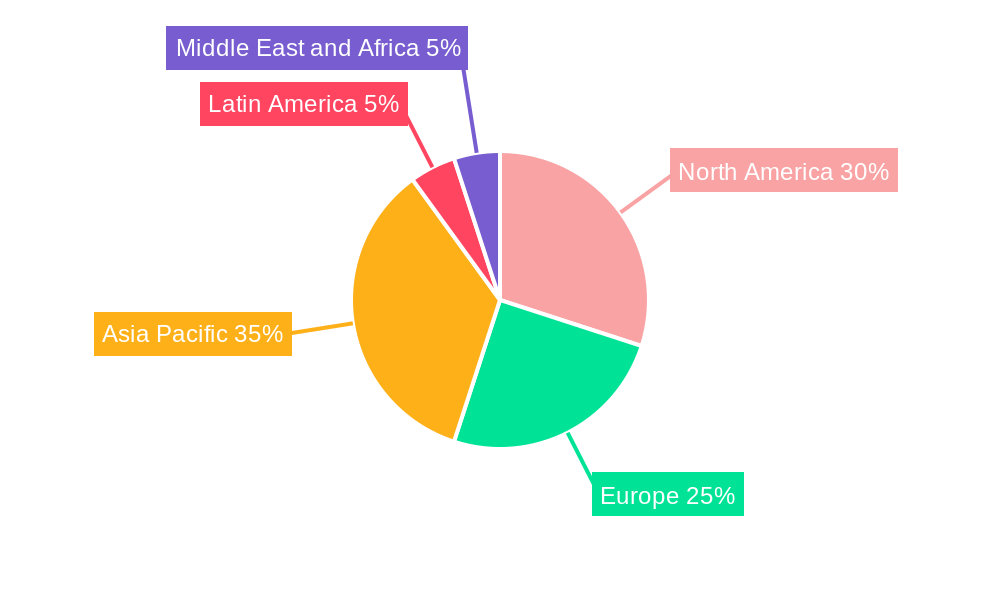
Market segmentation reveals substantial opportunities across different regions. North America and Asia Pacific are currently leading the market, largely driven by early 5G deployments and high consumer adoption rates. However, Europe and other regions are rapidly catching up, indicating significant future potential. While the initial high CAGR is likely to decelerate, the market's substantial size in 2025, combined with the continued expansion into new applications and geographical markets, promises a consistently strong trajectory through 2033. Challenges such as infrastructure investment costs and the need for interoperability standards remain, but the overall outlook for the 5G connected device market remains incredibly positive.
5G Connected Device Industry Market Report: 2019-2033
This comprehensive report provides an in-depth analysis of the 5G Connected Device industry, offering invaluable insights for stakeholders, investors, and industry professionals. With a focus on market dynamics, leading players, technological advancements, and future growth projections (2019-2033), this report is an essential resource for navigating this rapidly evolving landscape. The report covers key segments, including smartphones, CPEs, modules, and more, across diverse spectrum bands, offering a granular view of the market's structure and future trajectory. The market is expected to reach xx Million by 2033, exhibiting a CAGR of xx% during the forecast period (2025-2033).
5G Connected Device Industry Market Dynamics & Concentration
The 5G connected device market is characterized by intense competition and significant consolidation. Key players like Samsung Electronics Co Ltd, BBK Electronics Corporation, Xiaomi Corporation, Huawei Technologies Co Ltd, and ZTE Corporation hold substantial market share, driving innovation and shaping market trends. The market concentration is moderately high, with a few dominant players alongside numerous smaller niche players. Innovation is a key driver, fueled by advancements in chip technology, antenna design, and software capabilities. Regulatory frameworks, varying across geographies, influence deployment strategies and market access. Product substitutes, such as improved 4G LTE solutions, pose a challenge, but the superior speed and capacity of 5G are driving adoption. End-user trends, particularly the increasing demand for high-bandwidth applications (e.g., streaming, gaming), are bolstering market growth. The industry has witnessed a significant number of M&A activities (xx deals in the past 5 years), reflecting the pursuit of scale and technological capabilities. Market share data (2024): Samsung (xx%), BBK (xx%), Xiaomi (xx%), Huawei (xx%), ZTE (xx%), Others (xx%).
5G Connected Device Industry Industry Trends & Analysis
The 5G connected device market is experiencing robust growth, driven by several key factors. The increasing penetration of 5G networks globally is a major catalyst, expanding the addressable market significantly. Technological disruptions, such as the development of more power-efficient chips and advanced antenna technologies, are making 5G devices more affordable and accessible. Consumer preferences are shifting towards higher-bandwidth, low-latency applications, fueling demand for 5G-enabled devices. The competitive dynamics are shaped by fierce competition among established players and the emergence of new entrants, leading to continuous product innovation and price reductions. The market's Compound Annual Growth Rate (CAGR) during the historical period (2019-2024) was xx%, and is projected to be xx% during the forecast period (2025-2033). Market penetration of 5G devices in key regions is expected to reach xx% by 2033.
Leading Markets & Segments in 5G Connected Device Industry
The Asia-Pacific region currently holds the dominant position in the 5G connected device market, fueled by a large and rapidly growing consumer base and significant government investment in 5G infrastructure. China and India are particularly important markets within this region. The smartphone segment accounts for the largest share of the market, driven by high consumer demand and widespread adoption.
Key Drivers:
- Asia-Pacific: Strong economic growth, rising disposable incomes, and large population base.
- China & India: Government initiatives promoting 5G infrastructure development and digitalization.
- Smartphone Segment: High consumer demand for advanced features and multimedia capabilities.
Dominance Analysis: The dominance of Asia-Pacific is projected to continue throughout the forecast period, albeit with increasing contributions from other regions like North America and Europe as 5G network deployments mature. The smartphone segment will remain the largest, though other segments like CPE and industrial-grade devices will experience significant growth due to the expansion of 5G into various sectors.
Spectrum Support: The "Both Spectrum Bands" segment is gaining traction, offering a balance between coverage and speed.
5G Connected Device Industry Product Developments
The 5G connected device market witnesses continuous product innovation. Developments focus on improving energy efficiency, integrating advanced features (AI, IoT), and enhancing user experiences. New form factors, such as foldable smartphones and ultra-thin laptops, are emerging, catering to diverse consumer preferences. Competitive advantages are primarily derived from superior performance, longer battery life, enhanced security features, and innovative designs. The market is witnessing a shift towards more integrated and modular designs, facilitating quicker product development and customization.
Key Drivers of 5G Connected Device Industry Growth
Several factors are driving the growth of the 5G connected device market. Advancements in chip technology are making 5G devices more power-efficient and affordable. Government policies supporting 5G infrastructure development are creating a favorable environment for market expansion. The increasing demand for high-bandwidth applications (e.g., AR/VR, cloud gaming) fuels the adoption of 5G devices. Economic growth and rising disposable incomes in emerging economies are also contributing to market expansion.
Challenges in the 5G Connected Device Industry Market
The 5G connected device market faces several challenges. Regulatory hurdles in some regions create delays in network deployments and device approvals. Supply chain disruptions can impact the availability and pricing of components. The intense competition among manufacturers puts downward pressure on profit margins. These challenges are estimated to reduce the market size by approximately xx Million in 2025.
Emerging Opportunities in 5G Connected Device Industry
The 5G connected device market presents exciting opportunities. Technological breakthroughs, such as the development of more advanced mmWave antennas, will expand the potential of 5G networks. Strategic partnerships between device manufacturers, network operators, and application providers can drive the development of innovative services. Market expansion into new sectors, such as industrial automation and healthcare, presents significant growth potential.
Leading Players in the 5G Connected Device Industry Sector
- BBK Electronics Corporation
- Samsung Electronics Co Ltd
- Motorola Mobility LLC (Lenovo Group Limited)
- Cisco Systems Inc
- Xiaomi Corporation
- Keysight Technologies Inc
- Huawei Technologies Co Ltd
- ZTE Corporation
- Nokia Corporation
Key Milestones in 5G Connected Device Industry Industry
- September 2022: Nokia and Telia Finland launched one of the first commercial 5G standalone (SA) networks with network slicing for Fixed Wireless Access (FWA) services. This marked a significant step towards broader 5G SA adoption.
- September 2022: ZTE Corporation and China Mobile launched a trial of a 5G industrial emulator and analyzer, demonstrating the potential of 5G in industrial digital transformation.
- July 2022: Samsung launched the Galaxy M13 5G, an affordable 5G smartphone expanding 5G accessibility in India. This underscores the growing demand for budget-friendly 5G devices.
Strategic Outlook for 5G Connected Device Industry Market
The 5G connected device market is poised for significant growth in the coming years. The expansion of 5G networks, the development of new applications, and the increasing affordability of 5G devices will drive market expansion. Strategic partnerships and collaborations will be crucial for players to capture market share and accelerate innovation. The market's future potential is substantial, with opportunities for growth across various segments and geographies.
5G Connected Device Industry Segmentation
-
1. Form Factor
- 1.1. Modules
- 1.2. CPE (Indoor/Outdoor)
- 1.3. Smartphone
- 1.4. Hotspots
- 1.5. Laptops
- 1.6. Industrial Grade CPE/Router/Gateway
- 1.7. Other Form Factors
-
2. Spectrum Support
- 2.1. Sub-6 GHz
- 2.2. mmWave
- 2.3. Both Spectrum Bands
5G Connected Device Industry Segmentation By Geography
-
1. North America
- 1.1. United States
- 1.2. Canada
-
2. Europe
- 2.1. Germany
- 2.2. UK
- 2.3. France
- 2.4. Spain
- 2.5. Rest of Europe
-
3. Asia Pacific
- 3.1. China
- 3.2. Japan
- 3.3. India
- 3.4. Australia
- 3.5. Rest of Asia Pacific
-
4. Latin America
- 4.1. Brazil
- 4.2. Mexico
- 4.3. Argentina
- 4.4. Rest of Latin America
-
5. Middle East and Africa
- 5.1. UAE
- 5.2. Saudi Arabia
- 5.3. South Africa
- 5.4. Rest of Middle East and Africa
5G Connected Device Industry REPORT HIGHLIGHTS
| Aspects | Details |
|---|---|
| Study Period | 2019-2033 |
| Base Year | 2024 |
| Estimated Year | 2025 |
| Forecast Period | 2025-2033 |
| Historical Period | 2019-2024 |
| Growth Rate | CAGR of 61.76% from 2019-2033 |
| Segmentation |
|
Table of Contents
- 1. Introduction
- 1.1. Research Scope
- 1.2. Market Segmentation
- 1.3. Research Methodology
- 1.4. Definitions and Assumptions
- 2. Executive Summary
- 2.1. Introduction
- 3. Market Dynamics
- 3.1. Introduction
- 3.2. Market Drivers
- 3.2.1. Sustained Increase in Number of Devices and Endpoints Worldwide; Technological Innovations at a Component and Device Level to Aid Adoption; Increasing use of Smart Phones and rising Technological advancement in the smart phones is expected to drive market.
- 3.3. Market Restrains
- 3.3.1. Regulatory and Standardization Delays; Design and Operational Challenges
- 3.4. Market Trends
- 3.4.1. Smartphone Segment is Expected to Witness the Highest Growth
- 4. Market Factor Analysis
- 4.1. Porters Five Forces
- 4.2. Supply/Value Chain
- 4.3. PESTEL analysis
- 4.4. Market Entropy
- 4.5. Patent/Trademark Analysis
- 5. Global 5G Connected Device Industry Analysis, Insights and Forecast, 2019-2031
- 5.1. Market Analysis, Insights and Forecast - by Form Factor
- 5.1.1. Modules
- 5.1.2. CPE (Indoor/Outdoor)
- 5.1.3. Smartphone
- 5.1.4. Hotspots
- 5.1.5. Laptops
- 5.1.6. Industrial Grade CPE/Router/Gateway
- 5.1.7. Other Form Factors
- 5.2. Market Analysis, Insights and Forecast - by Spectrum Support
- 5.2.1. Sub-6 GHz
- 5.2.2. mmWave
- 5.2.3. Both Spectrum Bands
- 5.3. Market Analysis, Insights and Forecast - by Region
- 5.3.1. North America
- 5.3.2. Europe
- 5.3.3. Asia Pacific
- 5.3.4. Latin America
- 5.3.5. Middle East and Africa
- 5.1. Market Analysis, Insights and Forecast - by Form Factor
- 6. North America 5G Connected Device Industry Analysis, Insights and Forecast, 2019-2031
- 6.1. Market Analysis, Insights and Forecast - by Form Factor
- 6.1.1. Modules
- 6.1.2. CPE (Indoor/Outdoor)
- 6.1.3. Smartphone
- 6.1.4. Hotspots
- 6.1.5. Laptops
- 6.1.6. Industrial Grade CPE/Router/Gateway
- 6.1.7. Other Form Factors
- 6.2. Market Analysis, Insights and Forecast - by Spectrum Support
- 6.2.1. Sub-6 GHz
- 6.2.2. mmWave
- 6.2.3. Both Spectrum Bands
- 6.1. Market Analysis, Insights and Forecast - by Form Factor
- 7. Europe 5G Connected Device Industry Analysis, Insights and Forecast, 2019-2031
- 7.1. Market Analysis, Insights and Forecast - by Form Factor
- 7.1.1. Modules
- 7.1.2. CPE (Indoor/Outdoor)
- 7.1.3. Smartphone
- 7.1.4. Hotspots
- 7.1.5. Laptops
- 7.1.6. Industrial Grade CPE/Router/Gateway
- 7.1.7. Other Form Factors
- 7.2. Market Analysis, Insights and Forecast - by Spectrum Support
- 7.2.1. Sub-6 GHz
- 7.2.2. mmWave
- 7.2.3. Both Spectrum Bands
- 7.1. Market Analysis, Insights and Forecast - by Form Factor
- 8. Asia Pacific 5G Connected Device Industry Analysis, Insights and Forecast, 2019-2031
- 8.1. Market Analysis, Insights and Forecast - by Form Factor
- 8.1.1. Modules
- 8.1.2. CPE (Indoor/Outdoor)
- 8.1.3. Smartphone
- 8.1.4. Hotspots
- 8.1.5. Laptops
- 8.1.6. Industrial Grade CPE/Router/Gateway
- 8.1.7. Other Form Factors
- 8.2. Market Analysis, Insights and Forecast - by Spectrum Support
- 8.2.1. Sub-6 GHz
- 8.2.2. mmWave
- 8.2.3. Both Spectrum Bands
- 8.1. Market Analysis, Insights and Forecast - by Form Factor
- 9. Latin America 5G Connected Device Industry Analysis, Insights and Forecast, 2019-2031
- 9.1. Market Analysis, Insights and Forecast - by Form Factor
- 9.1.1. Modules
- 9.1.2. CPE (Indoor/Outdoor)
- 9.1.3. Smartphone
- 9.1.4. Hotspots
- 9.1.5. Laptops
- 9.1.6. Industrial Grade CPE/Router/Gateway
- 9.1.7. Other Form Factors
- 9.2. Market Analysis, Insights and Forecast - by Spectrum Support
- 9.2.1. Sub-6 GHz
- 9.2.2. mmWave
- 9.2.3. Both Spectrum Bands
- 9.1. Market Analysis, Insights and Forecast - by Form Factor
- 10. Middle East and Africa 5G Connected Device Industry Analysis, Insights and Forecast, 2019-2031
- 10.1. Market Analysis, Insights and Forecast - by Form Factor
- 10.1.1. Modules
- 10.1.2. CPE (Indoor/Outdoor)
- 10.1.3. Smartphone
- 10.1.4. Hotspots
- 10.1.5. Laptops
- 10.1.6. Industrial Grade CPE/Router/Gateway
- 10.1.7. Other Form Factors
- 10.2. Market Analysis, Insights and Forecast - by Spectrum Support
- 10.2.1. Sub-6 GHz
- 10.2.2. mmWave
- 10.2.3. Both Spectrum Bands
- 10.1. Market Analysis, Insights and Forecast - by Form Factor
- 11. North America 5G Connected Device Industry Analysis, Insights and Forecast, 2019-2031
- 11.1. Market Analysis, Insights and Forecast - By Country/Sub-region
- 11.1.1 United States
- 11.1.2 Canada
- 12. Europe 5G Connected Device Industry Analysis, Insights and Forecast, 2019-2031
- 12.1. Market Analysis, Insights and Forecast - By Country/Sub-region
- 12.1.1 Germany
- 12.1.2 UK
- 12.1.3 France
- 12.1.4 Spain
- 12.1.5 Rest of Europe
- 13. Asia Pacific 5G Connected Device Industry Analysis, Insights and Forecast, 2019-2031
- 13.1. Market Analysis, Insights and Forecast - By Country/Sub-region
- 13.1.1 China
- 13.1.2 Japan
- 13.1.3 India
- 13.1.4 Australia
- 13.1.5 Rest of Asia Pacific
- 14. Latin America 5G Connected Device Industry Analysis, Insights and Forecast, 2019-2031
- 14.1. Market Analysis, Insights and Forecast - By Country/Sub-region
- 14.1.1 Brazil
- 14.1.2 Mexico
- 14.1.3 Argentina
- 14.1.4 Rest of Latin America
- 15. Middle East and Africa 5G Connected Device Industry Analysis, Insights and Forecast, 2019-2031
- 15.1. Market Analysis, Insights and Forecast - By Country/Sub-region
- 15.1.1 UAE
- 15.1.2 Saudi Arabia
- 15.1.3 South Africa
- 15.1.4 Rest of Middle East and Africa
- 16. Competitive Analysis
- 16.1. Global Market Share Analysis 2024
- 16.2. Company Profiles
- 16.2.1 BBK Electronics Corporation
- 16.2.1.1. Overview
- 16.2.1.2. Products
- 16.2.1.3. SWOT Analysis
- 16.2.1.4. Recent Developments
- 16.2.1.5. Financials (Based on Availability)
- 16.2.2 Samsung Electronics Co Ltd
- 16.2.2.1. Overview
- 16.2.2.2. Products
- 16.2.2.3. SWOT Analysis
- 16.2.2.4. Recent Developments
- 16.2.2.5. Financials (Based on Availability)
- 16.2.3 Motorola Mobility LLC (Lenovo Group Limited)
- 16.2.3.1. Overview
- 16.2.3.2. Products
- 16.2.3.3. SWOT Analysis
- 16.2.3.4. Recent Developments
- 16.2.3.5. Financials (Based on Availability)
- 16.2.4 Cisco Systems Inc
- 16.2.4.1. Overview
- 16.2.4.2. Products
- 16.2.4.3. SWOT Analysis
- 16.2.4.4. Recent Developments
- 16.2.4.5. Financials (Based on Availability)
- 16.2.5 Xiaomi Corporation
- 16.2.5.1. Overview
- 16.2.5.2. Products
- 16.2.5.3. SWOT Analysis
- 16.2.5.4. Recent Developments
- 16.2.5.5. Financials (Based on Availability)
- 16.2.6 Keysight Technologies Inc *List Not Exhaustive
- 16.2.6.1. Overview
- 16.2.6.2. Products
- 16.2.6.3. SWOT Analysis
- 16.2.6.4. Recent Developments
- 16.2.6.5. Financials (Based on Availability)
- 16.2.7 Huawei Technologies Co Ltd
- 16.2.7.1. Overview
- 16.2.7.2. Products
- 16.2.7.3. SWOT Analysis
- 16.2.7.4. Recent Developments
- 16.2.7.5. Financials (Based on Availability)
- 16.2.8 ZTE Corporation
- 16.2.8.1. Overview
- 16.2.8.2. Products
- 16.2.8.3. SWOT Analysis
- 16.2.8.4. Recent Developments
- 16.2.8.5. Financials (Based on Availability)
- 16.2.9 Nokia Corporation
- 16.2.9.1. Overview
- 16.2.9.2. Products
- 16.2.9.3. SWOT Analysis
- 16.2.9.4. Recent Developments
- 16.2.9.5. Financials (Based on Availability)
- 16.2.1 BBK Electronics Corporation
List of Figures
- Figure 1: Global 5G Connected Device Industry Revenue Breakdown (Million, %) by Region 2024 & 2032
- Figure 2: Global 5G Connected Device Industry Volume Breakdown (Billion, %) by Region 2024 & 2032
- Figure 3: North America 5G Connected Device Industry Revenue (Million), by Country 2024 & 2032
- Figure 4: North America 5G Connected Device Industry Volume (Billion), by Country 2024 & 2032
- Figure 5: North America 5G Connected Device Industry Revenue Share (%), by Country 2024 & 2032
- Figure 6: North America 5G Connected Device Industry Volume Share (%), by Country 2024 & 2032
- Figure 7: Europe 5G Connected Device Industry Revenue (Million), by Country 2024 & 2032
- Figure 8: Europe 5G Connected Device Industry Volume (Billion), by Country 2024 & 2032
- Figure 9: Europe 5G Connected Device Industry Revenue Share (%), by Country 2024 & 2032
- Figure 10: Europe 5G Connected Device Industry Volume Share (%), by Country 2024 & 2032
- Figure 11: Asia Pacific 5G Connected Device Industry Revenue (Million), by Country 2024 & 2032
- Figure 12: Asia Pacific 5G Connected Device Industry Volume (Billion), by Country 2024 & 2032
- Figure 13: Asia Pacific 5G Connected Device Industry Revenue Share (%), by Country 2024 & 2032
- Figure 14: Asia Pacific 5G Connected Device Industry Volume Share (%), by Country 2024 & 2032
- Figure 15: Latin America 5G Connected Device Industry Revenue (Million), by Country 2024 & 2032
- Figure 16: Latin America 5G Connected Device Industry Volume (Billion), by Country 2024 & 2032
- Figure 17: Latin America 5G Connected Device Industry Revenue Share (%), by Country 2024 & 2032
- Figure 18: Latin America 5G Connected Device Industry Volume Share (%), by Country 2024 & 2032
- Figure 19: Middle East and Africa 5G Connected Device Industry Revenue (Million), by Country 2024 & 2032
- Figure 20: Middle East and Africa 5G Connected Device Industry Volume (Billion), by Country 2024 & 2032
- Figure 21: Middle East and Africa 5G Connected Device Industry Revenue Share (%), by Country 2024 & 2032
- Figure 22: Middle East and Africa 5G Connected Device Industry Volume Share (%), by Country 2024 & 2032
- Figure 23: North America 5G Connected Device Industry Revenue (Million), by Form Factor 2024 & 2032
- Figure 24: North America 5G Connected Device Industry Volume (Billion), by Form Factor 2024 & 2032
- Figure 25: North America 5G Connected Device Industry Revenue Share (%), by Form Factor 2024 & 2032
- Figure 26: North America 5G Connected Device Industry Volume Share (%), by Form Factor 2024 & 2032
- Figure 27: North America 5G Connected Device Industry Revenue (Million), by Spectrum Support 2024 & 2032
- Figure 28: North America 5G Connected Device Industry Volume (Billion), by Spectrum Support 2024 & 2032
- Figure 29: North America 5G Connected Device Industry Revenue Share (%), by Spectrum Support 2024 & 2032
- Figure 30: North America 5G Connected Device Industry Volume Share (%), by Spectrum Support 2024 & 2032
- Figure 31: North America 5G Connected Device Industry Revenue (Million), by Country 2024 & 2032
- Figure 32: North America 5G Connected Device Industry Volume (Billion), by Country 2024 & 2032
- Figure 33: North America 5G Connected Device Industry Revenue Share (%), by Country 2024 & 2032
- Figure 34: North America 5G Connected Device Industry Volume Share (%), by Country 2024 & 2032
- Figure 35: Europe 5G Connected Device Industry Revenue (Million), by Form Factor 2024 & 2032
- Figure 36: Europe 5G Connected Device Industry Volume (Billion), by Form Factor 2024 & 2032
- Figure 37: Europe 5G Connected Device Industry Revenue Share (%), by Form Factor 2024 & 2032
- Figure 38: Europe 5G Connected Device Industry Volume Share (%), by Form Factor 2024 & 2032
- Figure 39: Europe 5G Connected Device Industry Revenue (Million), by Spectrum Support 2024 & 2032
- Figure 40: Europe 5G Connected Device Industry Volume (Billion), by Spectrum Support 2024 & 2032
- Figure 41: Europe 5G Connected Device Industry Revenue Share (%), by Spectrum Support 2024 & 2032
- Figure 42: Europe 5G Connected Device Industry Volume Share (%), by Spectrum Support 2024 & 2032
- Figure 43: Europe 5G Connected Device Industry Revenue (Million), by Country 2024 & 2032
- Figure 44: Europe 5G Connected Device Industry Volume (Billion), by Country 2024 & 2032
- Figure 45: Europe 5G Connected Device Industry Revenue Share (%), by Country 2024 & 2032
- Figure 46: Europe 5G Connected Device Industry Volume Share (%), by Country 2024 & 2032
- Figure 47: Asia Pacific 5G Connected Device Industry Revenue (Million), by Form Factor 2024 & 2032
- Figure 48: Asia Pacific 5G Connected Device Industry Volume (Billion), by Form Factor 2024 & 2032
- Figure 49: Asia Pacific 5G Connected Device Industry Revenue Share (%), by Form Factor 2024 & 2032
- Figure 50: Asia Pacific 5G Connected Device Industry Volume Share (%), by Form Factor 2024 & 2032
- Figure 51: Asia Pacific 5G Connected Device Industry Revenue (Million), by Spectrum Support 2024 & 2032
- Figure 52: Asia Pacific 5G Connected Device Industry Volume (Billion), by Spectrum Support 2024 & 2032
- Figure 53: Asia Pacific 5G Connected Device Industry Revenue Share (%), by Spectrum Support 2024 & 2032
- Figure 54: Asia Pacific 5G Connected Device Industry Volume Share (%), by Spectrum Support 2024 & 2032
- Figure 55: Asia Pacific 5G Connected Device Industry Revenue (Million), by Country 2024 & 2032
- Figure 56: Asia Pacific 5G Connected Device Industry Volume (Billion), by Country 2024 & 2032
- Figure 57: Asia Pacific 5G Connected Device Industry Revenue Share (%), by Country 2024 & 2032
- Figure 58: Asia Pacific 5G Connected Device Industry Volume Share (%), by Country 2024 & 2032
- Figure 59: Latin America 5G Connected Device Industry Revenue (Million), by Form Factor 2024 & 2032
- Figure 60: Latin America 5G Connected Device Industry Volume (Billion), by Form Factor 2024 & 2032
- Figure 61: Latin America 5G Connected Device Industry Revenue Share (%), by Form Factor 2024 & 2032
- Figure 62: Latin America 5G Connected Device Industry Volume Share (%), by Form Factor 2024 & 2032
- Figure 63: Latin America 5G Connected Device Industry Revenue (Million), by Spectrum Support 2024 & 2032
- Figure 64: Latin America 5G Connected Device Industry Volume (Billion), by Spectrum Support 2024 & 2032
- Figure 65: Latin America 5G Connected Device Industry Revenue Share (%), by Spectrum Support 2024 & 2032
- Figure 66: Latin America 5G Connected Device Industry Volume Share (%), by Spectrum Support 2024 & 2032
- Figure 67: Latin America 5G Connected Device Industry Revenue (Million), by Country 2024 & 2032
- Figure 68: Latin America 5G Connected Device Industry Volume (Billion), by Country 2024 & 2032
- Figure 69: Latin America 5G Connected Device Industry Revenue Share (%), by Country 2024 & 2032
- Figure 70: Latin America 5G Connected Device Industry Volume Share (%), by Country 2024 & 2032
- Figure 71: Middle East and Africa 5G Connected Device Industry Revenue (Million), by Form Factor 2024 & 2032
- Figure 72: Middle East and Africa 5G Connected Device Industry Volume (Billion), by Form Factor 2024 & 2032
- Figure 73: Middle East and Africa 5G Connected Device Industry Revenue Share (%), by Form Factor 2024 & 2032
- Figure 74: Middle East and Africa 5G Connected Device Industry Volume Share (%), by Form Factor 2024 & 2032
- Figure 75: Middle East and Africa 5G Connected Device Industry Revenue (Million), by Spectrum Support 2024 & 2032
- Figure 76: Middle East and Africa 5G Connected Device Industry Volume (Billion), by Spectrum Support 2024 & 2032
- Figure 77: Middle East and Africa 5G Connected Device Industry Revenue Share (%), by Spectrum Support 2024 & 2032
- Figure 78: Middle East and Africa 5G Connected Device Industry Volume Share (%), by Spectrum Support 2024 & 2032
- Figure 79: Middle East and Africa 5G Connected Device Industry Revenue (Million), by Country 2024 & 2032
- Figure 80: Middle East and Africa 5G Connected Device Industry Volume (Billion), by Country 2024 & 2032
- Figure 81: Middle East and Africa 5G Connected Device Industry Revenue Share (%), by Country 2024 & 2032
- Figure 82: Middle East and Africa 5G Connected Device Industry Volume Share (%), by Country 2024 & 2032
List of Tables
- Table 1: Global 5G Connected Device Industry Revenue Million Forecast, by Region 2019 & 2032
- Table 2: Global 5G Connected Device Industry Volume Billion Forecast, by Region 2019 & 2032
- Table 3: Global 5G Connected Device Industry Revenue Million Forecast, by Form Factor 2019 & 2032
- Table 4: Global 5G Connected Device Industry Volume Billion Forecast, by Form Factor 2019 & 2032
- Table 5: Global 5G Connected Device Industry Revenue Million Forecast, by Spectrum Support 2019 & 2032
- Table 6: Global 5G Connected Device Industry Volume Billion Forecast, by Spectrum Support 2019 & 2032
- Table 7: Global 5G Connected Device Industry Revenue Million Forecast, by Region 2019 & 2032
- Table 8: Global 5G Connected Device Industry Volume Billion Forecast, by Region 2019 & 2032
- Table 9: Global 5G Connected Device Industry Revenue Million Forecast, by Country 2019 & 2032
- Table 10: Global 5G Connected Device Industry Volume Billion Forecast, by Country 2019 & 2032
- Table 11: United States 5G Connected Device Industry Revenue (Million) Forecast, by Application 2019 & 2032
- Table 12: United States 5G Connected Device Industry Volume (Billion) Forecast, by Application 2019 & 2032
- Table 13: Canada 5G Connected Device Industry Revenue (Million) Forecast, by Application 2019 & 2032
- Table 14: Canada 5G Connected Device Industry Volume (Billion) Forecast, by Application 2019 & 2032
- Table 15: Global 5G Connected Device Industry Revenue Million Forecast, by Country 2019 & 2032
- Table 16: Global 5G Connected Device Industry Volume Billion Forecast, by Country 2019 & 2032
- Table 17: Germany 5G Connected Device Industry Revenue (Million) Forecast, by Application 2019 & 2032
- Table 18: Germany 5G Connected Device Industry Volume (Billion) Forecast, by Application 2019 & 2032
- Table 19: UK 5G Connected Device Industry Revenue (Million) Forecast, by Application 2019 & 2032
- Table 20: UK 5G Connected Device Industry Volume (Billion) Forecast, by Application 2019 & 2032
- Table 21: France 5G Connected Device Industry Revenue (Million) Forecast, by Application 2019 & 2032
- Table 22: France 5G Connected Device Industry Volume (Billion) Forecast, by Application 2019 & 2032
- Table 23: Spain 5G Connected Device Industry Revenue (Million) Forecast, by Application 2019 & 2032
- Table 24: Spain 5G Connected Device Industry Volume (Billion) Forecast, by Application 2019 & 2032
- Table 25: Rest of Europe 5G Connected Device Industry Revenue (Million) Forecast, by Application 2019 & 2032
- Table 26: Rest of Europe 5G Connected Device Industry Volume (Billion) Forecast, by Application 2019 & 2032
- Table 27: Global 5G Connected Device Industry Revenue Million Forecast, by Country 2019 & 2032
- Table 28: Global 5G Connected Device Industry Volume Billion Forecast, by Country 2019 & 2032
- Table 29: China 5G Connected Device Industry Revenue (Million) Forecast, by Application 2019 & 2032
- Table 30: China 5G Connected Device Industry Volume (Billion) Forecast, by Application 2019 & 2032
- Table 31: Japan 5G Connected Device Industry Revenue (Million) Forecast, by Application 2019 & 2032
- Table 32: Japan 5G Connected Device Industry Volume (Billion) Forecast, by Application 2019 & 2032
- Table 33: India 5G Connected Device Industry Revenue (Million) Forecast, by Application 2019 & 2032
- Table 34: India 5G Connected Device Industry Volume (Billion) Forecast, by Application 2019 & 2032
- Table 35: Australia 5G Connected Device Industry Revenue (Million) Forecast, by Application 2019 & 2032
- Table 36: Australia 5G Connected Device Industry Volume (Billion) Forecast, by Application 2019 & 2032
- Table 37: Rest of Asia Pacific 5G Connected Device Industry Revenue (Million) Forecast, by Application 2019 & 2032
- Table 38: Rest of Asia Pacific 5G Connected Device Industry Volume (Billion) Forecast, by Application 2019 & 2032
- Table 39: Global 5G Connected Device Industry Revenue Million Forecast, by Country 2019 & 2032
- Table 40: Global 5G Connected Device Industry Volume Billion Forecast, by Country 2019 & 2032
- Table 41: Brazil 5G Connected Device Industry Revenue (Million) Forecast, by Application 2019 & 2032
- Table 42: Brazil 5G Connected Device Industry Volume (Billion) Forecast, by Application 2019 & 2032
- Table 43: Mexico 5G Connected Device Industry Revenue (Million) Forecast, by Application 2019 & 2032
- Table 44: Mexico 5G Connected Device Industry Volume (Billion) Forecast, by Application 2019 & 2032
- Table 45: Argentina 5G Connected Device Industry Revenue (Million) Forecast, by Application 2019 & 2032
- Table 46: Argentina 5G Connected Device Industry Volume (Billion) Forecast, by Application 2019 & 2032
- Table 47: Rest of Latin America 5G Connected Device Industry Revenue (Million) Forecast, by Application 2019 & 2032
- Table 48: Rest of Latin America 5G Connected Device Industry Volume (Billion) Forecast, by Application 2019 & 2032
- Table 49: Global 5G Connected Device Industry Revenue Million Forecast, by Country 2019 & 2032
- Table 50: Global 5G Connected Device Industry Volume Billion Forecast, by Country 2019 & 2032
- Table 51: UAE 5G Connected Device Industry Revenue (Million) Forecast, by Application 2019 & 2032
- Table 52: UAE 5G Connected Device Industry Volume (Billion) Forecast, by Application 2019 & 2032
- Table 53: Saudi Arabia 5G Connected Device Industry Revenue (Million) Forecast, by Application 2019 & 2032
- Table 54: Saudi Arabia 5G Connected Device Industry Volume (Billion) Forecast, by Application 2019 & 2032
- Table 55: South Africa 5G Connected Device Industry Revenue (Million) Forecast, by Application 2019 & 2032
- Table 56: South Africa 5G Connected Device Industry Volume (Billion) Forecast, by Application 2019 & 2032
- Table 57: Rest of Middle East and Africa 5G Connected Device Industry Revenue (Million) Forecast, by Application 2019 & 2032
- Table 58: Rest of Middle East and Africa 5G Connected Device Industry Volume (Billion) Forecast, by Application 2019 & 2032
- Table 59: Global 5G Connected Device Industry Revenue Million Forecast, by Form Factor 2019 & 2032
- Table 60: Global 5G Connected Device Industry Volume Billion Forecast, by Form Factor 2019 & 2032
- Table 61: Global 5G Connected Device Industry Revenue Million Forecast, by Spectrum Support 2019 & 2032
- Table 62: Global 5G Connected Device Industry Volume Billion Forecast, by Spectrum Support 2019 & 2032
- Table 63: Global 5G Connected Device Industry Revenue Million Forecast, by Country 2019 & 2032
- Table 64: Global 5G Connected Device Industry Volume Billion Forecast, by Country 2019 & 2032
- Table 65: United States 5G Connected Device Industry Revenue (Million) Forecast, by Application 2019 & 2032
- Table 66: United States 5G Connected Device Industry Volume (Billion) Forecast, by Application 2019 & 2032
- Table 67: Canada 5G Connected Device Industry Revenue (Million) Forecast, by Application 2019 & 2032
- Table 68: Canada 5G Connected Device Industry Volume (Billion) Forecast, by Application 2019 & 2032
- Table 69: Global 5G Connected Device Industry Revenue Million Forecast, by Form Factor 2019 & 2032
- Table 70: Global 5G Connected Device Industry Volume Billion Forecast, by Form Factor 2019 & 2032
- Table 71: Global 5G Connected Device Industry Revenue Million Forecast, by Spectrum Support 2019 & 2032
- Table 72: Global 5G Connected Device Industry Volume Billion Forecast, by Spectrum Support 2019 & 2032
- Table 73: Global 5G Connected Device Industry Revenue Million Forecast, by Country 2019 & 2032
- Table 74: Global 5G Connected Device Industry Volume Billion Forecast, by Country 2019 & 2032
- Table 75: Germany 5G Connected Device Industry Revenue (Million) Forecast, by Application 2019 & 2032
- Table 76: Germany 5G Connected Device Industry Volume (Billion) Forecast, by Application 2019 & 2032
- Table 77: UK 5G Connected Device Industry Revenue (Million) Forecast, by Application 2019 & 2032
- Table 78: UK 5G Connected Device Industry Volume (Billion) Forecast, by Application 2019 & 2032
- Table 79: France 5G Connected Device Industry Revenue (Million) Forecast, by Application 2019 & 2032
- Table 80: France 5G Connected Device Industry Volume (Billion) Forecast, by Application 2019 & 2032
- Table 81: Spain 5G Connected Device Industry Revenue (Million) Forecast, by Application 2019 & 2032
- Table 82: Spain 5G Connected Device Industry Volume (Billion) Forecast, by Application 2019 & 2032
- Table 83: Rest of Europe 5G Connected Device Industry Revenue (Million) Forecast, by Application 2019 & 2032
- Table 84: Rest of Europe 5G Connected Device Industry Volume (Billion) Forecast, by Application 2019 & 2032
- Table 85: Global 5G Connected Device Industry Revenue Million Forecast, by Form Factor 2019 & 2032
- Table 86: Global 5G Connected Device Industry Volume Billion Forecast, by Form Factor 2019 & 2032
- Table 87: Global 5G Connected Device Industry Revenue Million Forecast, by Spectrum Support 2019 & 2032
- Table 88: Global 5G Connected Device Industry Volume Billion Forecast, by Spectrum Support 2019 & 2032
- Table 89: Global 5G Connected Device Industry Revenue Million Forecast, by Country 2019 & 2032
- Table 90: Global 5G Connected Device Industry Volume Billion Forecast, by Country 2019 & 2032
- Table 91: China 5G Connected Device Industry Revenue (Million) Forecast, by Application 2019 & 2032
- Table 92: China 5G Connected Device Industry Volume (Billion) Forecast, by Application 2019 & 2032
- Table 93: Japan 5G Connected Device Industry Revenue (Million) Forecast, by Application 2019 & 2032
- Table 94: Japan 5G Connected Device Industry Volume (Billion) Forecast, by Application 2019 & 2032
- Table 95: India 5G Connected Device Industry Revenue (Million) Forecast, by Application 2019 & 2032
- Table 96: India 5G Connected Device Industry Volume (Billion) Forecast, by Application 2019 & 2032
- Table 97: Australia 5G Connected Device Industry Revenue (Million) Forecast, by Application 2019 & 2032
- Table 98: Australia 5G Connected Device Industry Volume (Billion) Forecast, by Application 2019 & 2032
- Table 99: Rest of Asia Pacific 5G Connected Device Industry Revenue (Million) Forecast, by Application 2019 & 2032
- Table 100: Rest of Asia Pacific 5G Connected Device Industry Volume (Billion) Forecast, by Application 2019 & 2032
- Table 101: Global 5G Connected Device Industry Revenue Million Forecast, by Form Factor 2019 & 2032
- Table 102: Global 5G Connected Device Industry Volume Billion Forecast, by Form Factor 2019 & 2032
- Table 103: Global 5G Connected Device Industry Revenue Million Forecast, by Spectrum Support 2019 & 2032
- Table 104: Global 5G Connected Device Industry Volume Billion Forecast, by Spectrum Support 2019 & 2032
- Table 105: Global 5G Connected Device Industry Revenue Million Forecast, by Country 2019 & 2032
- Table 106: Global 5G Connected Device Industry Volume Billion Forecast, by Country 2019 & 2032
- Table 107: Brazil 5G Connected Device Industry Revenue (Million) Forecast, by Application 2019 & 2032
- Table 108: Brazil 5G Connected Device Industry Volume (Billion) Forecast, by Application 2019 & 2032
- Table 109: Mexico 5G Connected Device Industry Revenue (Million) Forecast, by Application 2019 & 2032
- Table 110: Mexico 5G Connected Device Industry Volume (Billion) Forecast, by Application 2019 & 2032
- Table 111: Argentina 5G Connected Device Industry Revenue (Million) Forecast, by Application 2019 & 2032
- Table 112: Argentina 5G Connected Device Industry Volume (Billion) Forecast, by Application 2019 & 2032
- Table 113: Rest of Latin America 5G Connected Device Industry Revenue (Million) Forecast, by Application 2019 & 2032
- Table 114: Rest of Latin America 5G Connected Device Industry Volume (Billion) Forecast, by Application 2019 & 2032
- Table 115: Global 5G Connected Device Industry Revenue Million Forecast, by Form Factor 2019 & 2032
- Table 116: Global 5G Connected Device Industry Volume Billion Forecast, by Form Factor 2019 & 2032
- Table 117: Global 5G Connected Device Industry Revenue Million Forecast, by Spectrum Support 2019 & 2032
- Table 118: Global 5G Connected Device Industry Volume Billion Forecast, by Spectrum Support 2019 & 2032
- Table 119: Global 5G Connected Device Industry Revenue Million Forecast, by Country 2019 & 2032
- Table 120: Global 5G Connected Device Industry Volume Billion Forecast, by Country 2019 & 2032
- Table 121: UAE 5G Connected Device Industry Revenue (Million) Forecast, by Application 2019 & 2032
- Table 122: UAE 5G Connected Device Industry Volume (Billion) Forecast, by Application 2019 & 2032
- Table 123: Saudi Arabia 5G Connected Device Industry Revenue (Million) Forecast, by Application 2019 & 2032
- Table 124: Saudi Arabia 5G Connected Device Industry Volume (Billion) Forecast, by Application 2019 & 2032
- Table 125: South Africa 5G Connected Device Industry Revenue (Million) Forecast, by Application 2019 & 2032
- Table 126: South Africa 5G Connected Device Industry Volume (Billion) Forecast, by Application 2019 & 2032
- Table 127: Rest of Middle East and Africa 5G Connected Device Industry Revenue (Million) Forecast, by Application 2019 & 2032
- Table 128: Rest of Middle East and Africa 5G Connected Device Industry Volume (Billion) Forecast, by Application 2019 & 2032
Frequently Asked Questions
1. What is the projected Compound Annual Growth Rate (CAGR) of the 5G Connected Device Industry?
The projected CAGR is approximately 61.76%.
2. Which companies are prominent players in the 5G Connected Device Industry?
Key companies in the market include BBK Electronics Corporation, Samsung Electronics Co Ltd, Motorola Mobility LLC (Lenovo Group Limited), Cisco Systems Inc, Xiaomi Corporation, Keysight Technologies Inc *List Not Exhaustive, Huawei Technologies Co Ltd, ZTE Corporation, Nokia Corporation.
3. What are the main segments of the 5G Connected Device Industry?
The market segments include Form Factor, Spectrum Support.
4. Can you provide details about the market size?
The market size is estimated to be USD XX Million as of 2022.
5. What are some drivers contributing to market growth?
Sustained Increase in Number of Devices and Endpoints Worldwide; Technological Innovations at a Component and Device Level to Aid Adoption; Increasing use of Smart Phones and rising Technological advancement in the smart phones is expected to drive market..
6. What are the notable trends driving market growth?
Smartphone Segment is Expected to Witness the Highest Growth.
7. Are there any restraints impacting market growth?
Regulatory and Standardization Delays; Design and Operational Challenges.
8. Can you provide examples of recent developments in the market?
September 2022 - Nokia and Telia Finland launched one of the first commercial 5G standalone (SA) networks with network slicing for Fixed Wireless Access (FWA) services. Telia would introduce 5G SA to its 5G Fixed Wireless Access (FWA) home broadband services and be able to start offering a range of broadband deals with guaranteed service levels to its customers in Finland. The solutions would enable Telia to build on its existing position, delivering enhanced connectivity and capacity benefits to its customers through ongoing deployment.
9. What pricing options are available for accessing the report?
Pricing options include single-user, multi-user, and enterprise licenses priced at USD 4750, USD 5250, and USD 8750 respectively.
10. Is the market size provided in terms of value or volume?
The market size is provided in terms of value, measured in Million and volume, measured in Billion.
11. Are there any specific market keywords associated with the report?
Yes, the market keyword associated with the report is "5G Connected Device Industry," which aids in identifying and referencing the specific market segment covered.
12. How do I determine which pricing option suits my needs best?
The pricing options vary based on user requirements and access needs. Individual users may opt for single-user licenses, while businesses requiring broader access may choose multi-user or enterprise licenses for cost-effective access to the report.
13. Are there any additional resources or data provided in the 5G Connected Device Industry report?
While the report offers comprehensive insights, it's advisable to review the specific contents or supplementary materials provided to ascertain if additional resources or data are available.
14. How can I stay updated on further developments or reports in the 5G Connected Device Industry?
To stay informed about further developments, trends, and reports in the 5G Connected Device Industry, consider subscribing to industry newsletters, following relevant companies and organizations, or regularly checking reputable industry news sources and publications.
Methodology
Step 1 - Identification of Relevant Samples Size from Population Database


Step 2 - Approaches for Defining Global Market Size (Value, Volume* & Price*)

Note*: In applicable scenarios
Step 3 - Data Sources
Primary Research
- Web Analytics
- Survey Reports
- Research Institute
- Latest Research Reports
- Opinion Leaders
Secondary Research
- Annual Reports
- White Paper
- Latest Press Release
- Industry Association
- Paid Database
- Investor Presentations

Step 4 - Data Triangulation
Involves using different sources of information in order to increase the validity of a study
These sources are likely to be stakeholders in a program - participants, other researchers, program staff, other community members, and so on.
Then we put all data in single framework & apply various statistical tools to find out the dynamic on the market.
During the analysis stage, feedback from the stakeholder groups would be compared to determine areas of agreement as well as areas of divergence
