

Key Insights
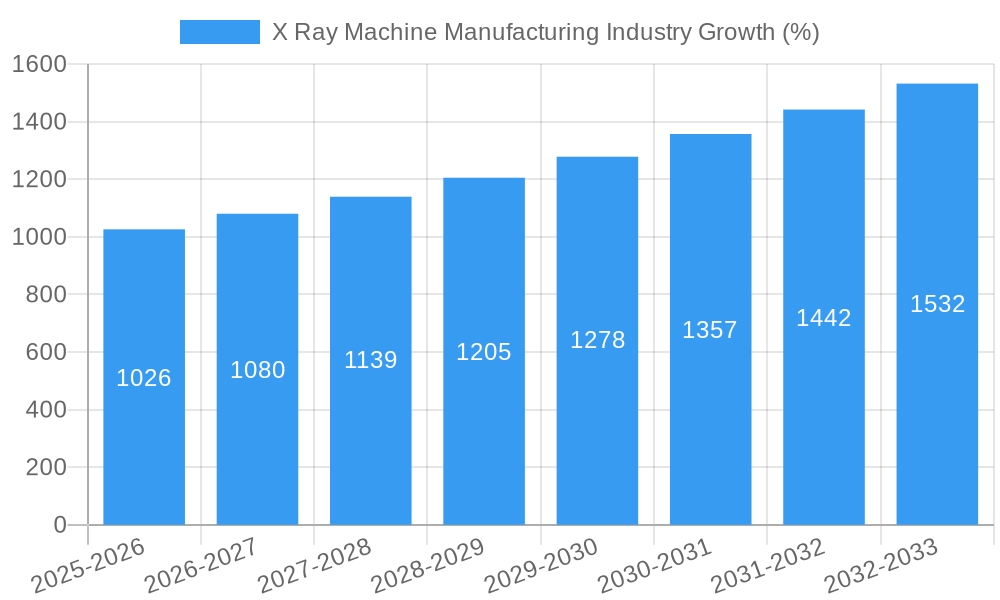
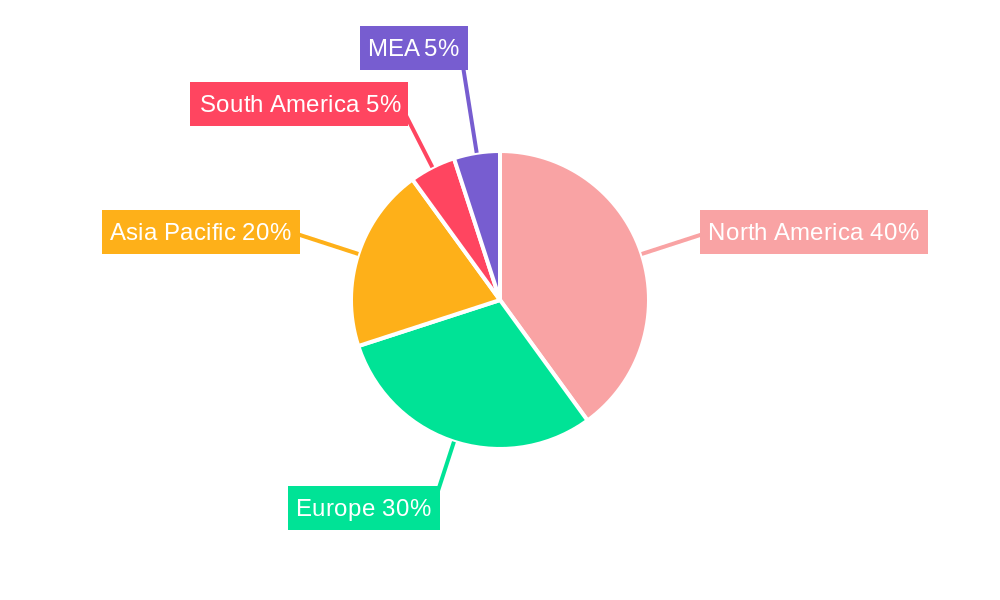
The X-ray machine manufacturing industry, valued at $17.70 billion in 2025, is projected to experience robust growth, with a compound annual growth rate (CAGR) of 5.69% from 2025 to 2033. This expansion is driven by several key factors. Increasing prevalence of chronic diseases necessitating frequent diagnostic imaging fuels demand in the healthcare sector. The rising adoption of advanced imaging technologies, particularly digital X-ray systems offering superior image quality and reduced radiation exposure, is a significant trend. Furthermore, the expanding global healthcare infrastructure, particularly in developing economies, is creating lucrative opportunities for manufacturers. Technological advancements like AI-powered image analysis and portable X-ray systems are enhancing efficiency and accessibility. However, the market faces challenges such as stringent regulatory approvals, high initial investment costs for advanced equipment, and potential cybersecurity risks associated with digital systems. The segmentation of the market reveals strong performance across various end-users, with healthcare dominating, followed by transportation and logistics (due to security screening needs), and government (for public health initiatives). Product type segmentation shows a preference towards portable systems for their flexibility. The digital technology segment is expected to outpace analog systems due to improved capabilities and cost-effectiveness in the long run. North America and Europe currently hold significant market shares, but rapid growth is anticipated in the Asia-Pacific region due to increasing healthcare investments and a growing population.
The competitive landscape is marked by the presence of established players like Canon, Hologic, GE Healthcare, Siemens, and Philips, alongside emerging regional companies. These companies are focusing on strategic partnerships, technological innovation, and expanding their product portfolios to maintain a competitive edge. The forecast period (2025-2033) is expected to witness increased consolidation and strategic acquisitions within the industry as companies aim to capture a larger market share. Factors like the ongoing development of miniaturized, more energy-efficient X-ray sources and integration of X-ray technology with other imaging modalities will further influence market trajectories. The industry's continued growth will be shaped by the balance between technological advancement, regulatory frameworks, and the overall healthcare spending patterns globally.

X-Ray Machine Manufacturing Industry Market Report: 2019-2033
This comprehensive report provides an in-depth analysis of the X-ray machine manufacturing industry, encompassing market dynamics, trends, leading players, and future prospects. With a study period spanning 2019-2033, a base year of 2025, and a forecast period of 2025-2033, this report offers invaluable insights for industry stakeholders, investors, and strategic decision-makers. The global market is projected to reach xx Million by 2033, showcasing significant growth opportunities.
X-Ray Machine Manufacturing Industry Market Dynamics & Concentration
The global X-ray machine manufacturing market is characterized by a moderately concentrated landscape, with key players holding significant market share. Canon Inc, Hologic Inc, GE Healthcare, Siemens AG, and Philips Healthcare are among the dominant players, collectively accounting for an estimated xx% of the market in 2024. Market concentration is influenced by factors such as high capital expenditure requirements for R&D, stringent regulatory approvals, and the need for specialized expertise in manufacturing and distribution.
Innovation Drivers: Continuous advancements in digital X-ray technology, including AI-powered image processing and portable systems, are major drivers of market growth. The development of sophisticated detectors and software solutions improves image clarity, reduces radiation exposure, and enhances diagnostic accuracy.
Regulatory Frameworks: Stringent regulatory approvals and compliance standards (e.g., FDA, CE marking) impact market entry and expansion. These regulations influence product design, safety features, and performance standards, driving innovation and quality improvements.
Product Substitutes: While X-ray machines are widely used for various medical and industrial applications, alternative imaging technologies like ultrasound and MRI pose some level of competition, particularly in specific niche applications. However, the cost-effectiveness and widespread availability of X-ray systems continue to sustain market demand.
End-User Trends: The healthcare sector remains the dominant end-user, accounting for approximately xx% of the market in 2024. Increasing prevalence of chronic diseases and the growing demand for advanced diagnostic tools are key drivers. Transportation and logistics and government sectors also contribute significantly to market demand, especially for specialized X-ray systems used for security and inspection.
M&A Activities: The X-ray machine manufacturing industry has witnessed a moderate number of mergers and acquisitions in recent years. The total deal count from 2019 to 2024 is estimated to be xx. Consolidation activities are driven by the need for companies to expand their product portfolios, enhance technological capabilities, and increase their market presence. These activities are expected to continue to shape the industry landscape.
X-Ray Machine Manufacturing Industry Trends & Analysis
The X-ray machine manufacturing market exhibits robust growth, driven by several key factors. Technological advancements, such as the integration of AI and improved image processing capabilities, significantly enhance diagnostic accuracy and workflow efficiency. The rising prevalence of chronic diseases globally is a major driver, increasing the demand for diagnostic imaging solutions. Furthermore, the growing adoption of digital X-ray systems, replacing traditional analog systems, is another significant trend. This shift is fueled by the advantages of digital technology, including superior image quality, easier storage and retrieval, and enhanced workflow efficiency. The market has shown a compound annual growth rate (CAGR) of xx% during the historical period (2019-2024) and is projected to maintain a CAGR of xx% during the forecast period (2025-2033). Market penetration of digital X-ray systems is estimated at xx% in 2024 and is expected to reach xx% by 2033. Competitive dynamics are intense, with leading players focusing on product innovation, strategic partnerships, and market expansion to maintain their market share. Consumer preferences are shifting towards portable and easy-to-use systems, especially in settings outside of traditional healthcare facilities.
Leading Markets & Segments in X Ray Machine Manufacturing Industry
The healthcare segment dominates the X-ray machine market by end-user, followed by transportation and logistics. Geographically, North America and Europe are leading markets due to advanced healthcare infrastructure and high adoption rates of digital X-ray technology.
By End-User:
- Healthcare: This segment accounts for the largest market share, driven by the rising prevalence of chronic diseases and an aging population requiring increased diagnostic imaging.
- Transportation and Logistics: This segment's growth is fueled by stringent security regulations and the need for efficient cargo inspection.
- Government: Government investment in healthcare infrastructure and public safety contributes to market growth in this segment.
- Other End-Users: This includes industrial and research applications which show moderate but consistent growth.
By Product Type:
- Stationary: Stationary X-ray systems remain dominant due to their higher image quality and advanced features, preferred in hospitals and large medical facilities.
- Portable: Portable X-ray machines are gaining traction owing to their mobility and suitability for various settings, including point-of-care diagnostics.
By Technology:
- Digital: Digital X-ray systems are rapidly replacing analog systems, fueled by their enhanced image quality, efficient workflow, and cost-effectiveness in the long run.
- Analog: Although declining, analog systems remain present in some developing regions or niche applications due to their lower initial investment costs.
Key Drivers by Region:
- North America: High healthcare expenditure, advanced medical infrastructure, and the adoption of new technologies.
- Europe: Similar to North America, strong healthcare infrastructure, significant government funding, and regulatory support drives growth.
- Asia-Pacific: Rapid economic growth, increasing healthcare spending, and a growing middle class are significant factors, with particular growth seen in India and China.
X-Ray Machine Manufacturing Industry Product Developments
Recent product developments highlight a trend towards improved image quality, portability, and AI integration. Innovations like Konica Minolta's groundbreaking digital radiography (DR) technologies and GE Healthcare's Definium 656 HD, with its intelligent workflow suite and AI-driven image processing, exemplify this. These advancements deliver superior diagnostic capabilities, enhance workflow efficiency, and cater to the diverse needs of various healthcare settings. The focus is on creating user-friendly systems that reduce operational costs and improve the patient experience.
Key Drivers of X Ray Machine Manufacturing Industry Growth
Technological advancements, particularly in digital radiography and AI-driven image processing, are major growth drivers. The rise in chronic diseases globally increases the demand for diagnostic imaging. Favorable government policies supporting healthcare infrastructure and technological advancements also contribute to market growth. Increasing adoption of digital systems and expanding applications beyond traditional healthcare settings further contribute to the expansion of the X-ray machine manufacturing market.
Challenges in the X Ray Machine Manufacturing Industry Market
Stringent regulatory requirements and the need for extensive certification processes pose significant barriers to market entry. Supply chain disruptions and fluctuations in the prices of raw materials impact manufacturing costs and profitability. Intense competition among established players necessitates continuous innovation and investment in R&D to maintain market share. The high cost of advanced systems and limited access to technology in developing economies represent additional challenges.
Emerging Opportunities in X Ray Machine Manufacturing Industry
The integration of artificial intelligence (AI) and machine learning (ML) in X-ray imaging opens up new avenues for improved diagnostic accuracy and efficiency. The development of portable and mobile X-ray systems creates opportunities to expand access to diagnostic services in remote areas and underserved populations. Strategic partnerships and collaborations among manufacturers, healthcare providers, and technology companies are expected to enhance the growth of the X-ray machine manufacturing market.
Leading Players in the X Ray Machine Manufacturing Industry Sector
- Canon Inc
- Hologic Inc
- GE Healthcare
- Siemens AG
- Philips Healthcare
- Hindrays
- Hitachi Medical Corporation
- Vision Medicaid Equipment Private Limited
- Shimadzu Corporation
- Fujifilm Holdings Corporation
Key Milestones in X Ray Machine Manufacturing Industry Industry
- November 2022: Konica Minolta Healthcare Americas, Inc. introduced groundbreaking digital radiography (DR) technologies, revolutionizing X-ray clinical utility. This significantly improved image quality and diagnostic capabilities.
- August 2022: GE Healthcare launched the Definium 656 HD fixed X-ray equipment, acting as a "personal assistant" for radiology departments, boosting workflow efficiency and reducing technologist workload. This highlights a major trend toward AI-powered automation in the industry.
Strategic Outlook for X Ray Machine Manufacturing Industry Market
The X-ray machine manufacturing industry is poised for sustained growth, driven by technological advancements, increasing healthcare spending, and the rising prevalence of chronic diseases. Strategic partnerships, focused R&D, and expansion into emerging markets are key strategic avenues for future growth. The continued integration of AI and the development of more portable and user-friendly systems will shape the market's evolution.
X Ray Machine Manufacturing Industry Segmentation
-
1. Product Type
- 1.1. Stationary
- 1.2. Portable
-
2. Technology
- 2.1. Analog
- 2.2. Digital
-
3. End-user
- 3.1. Healthcare
- 3.2. Transportation and Logistics
- 3.3. Government
- 3.4. Other End-users
X Ray Machine Manufacturing Industry Segmentation By Geography
-
1. North America
- 1.1. United States
- 1.2. Canada
-
2. Europe
- 2.1. United Kingdom
- 2.2. Germany
- 2.3. France
-
3. Asia
- 3.1. China
- 3.2. Japan
- 3.3. India
- 3.4. South Korea
- 4. Latin America
- 5. Middle East and Africa
X Ray Machine Manufacturing Industry REPORT HIGHLIGHTS
| Aspects | Details |
|---|---|
| Study Period | 2019-2033 |
| Base Year | 2024 |
| Estimated Year | 2025 |
| Forecast Period | 2025-2033 |
| Historical Period | 2019-2024 |
| Growth Rate | CAGR of 5.69% from 2019-2033 |
| Segmentation |
|
Table of Contents
- 1. Introduction
- 1.1. Research Scope
- 1.2. Market Segmentation
- 1.3. Research Methodology
- 1.4. Definitions and Assumptions
- 2. Executive Summary
- 2.1. Introduction
- 3. Market Dynamics
- 3.1. Introduction
- 3.2. Market Drivers
- 3.2.1. Rise in Adoption of Digital X-ray Systems; Government Regulations and Investments to Improve Infrastructure
- 3.3. Market Restrains
- 3.3.1. High Cost of the Equipment
- 3.4. Market Trends
- 3.4.1. Healthcare Sector is Expected to Hold a Significant Market Share
- 4. Market Factor Analysis
- 4.1. Porters Five Forces
- 4.2. Supply/Value Chain
- 4.3. PESTEL analysis
- 4.4. Market Entropy
- 4.5. Patent/Trademark Analysis
- 5. Global X Ray Machine Manufacturing Industry Analysis, Insights and Forecast, 2019-2031
- 5.1. Market Analysis, Insights and Forecast - by Product Type
- 5.1.1. Stationary
- 5.1.2. Portable
- 5.2. Market Analysis, Insights and Forecast - by Technology
- 5.2.1. Analog
- 5.2.2. Digital
- 5.3. Market Analysis, Insights and Forecast - by End-user
- 5.3.1. Healthcare
- 5.3.2. Transportation and Logistics
- 5.3.3. Government
- 5.3.4. Other End-users
- 5.4. Market Analysis, Insights and Forecast - by Region
- 5.4.1. North America
- 5.4.2. Europe
- 5.4.3. Asia
- 5.4.4. Latin America
- 5.4.5. Middle East and Africa
- 5.1. Market Analysis, Insights and Forecast - by Product Type
- 6. North America X Ray Machine Manufacturing Industry Analysis, Insights and Forecast, 2019-2031
- 6.1. Market Analysis, Insights and Forecast - by Product Type
- 6.1.1. Stationary
- 6.1.2. Portable
- 6.2. Market Analysis, Insights and Forecast - by Technology
- 6.2.1. Analog
- 6.2.2. Digital
- 6.3. Market Analysis, Insights and Forecast - by End-user
- 6.3.1. Healthcare
- 6.3.2. Transportation and Logistics
- 6.3.3. Government
- 6.3.4. Other End-users
- 6.1. Market Analysis, Insights and Forecast - by Product Type
- 7. Europe X Ray Machine Manufacturing Industry Analysis, Insights and Forecast, 2019-2031
- 7.1. Market Analysis, Insights and Forecast - by Product Type
- 7.1.1. Stationary
- 7.1.2. Portable
- 7.2. Market Analysis, Insights and Forecast - by Technology
- 7.2.1. Analog
- 7.2.2. Digital
- 7.3. Market Analysis, Insights and Forecast - by End-user
- 7.3.1. Healthcare
- 7.3.2. Transportation and Logistics
- 7.3.3. Government
- 7.3.4. Other End-users
- 7.1. Market Analysis, Insights and Forecast - by Product Type
- 8. Asia X Ray Machine Manufacturing Industry Analysis, Insights and Forecast, 2019-2031
- 8.1. Market Analysis, Insights and Forecast - by Product Type
- 8.1.1. Stationary
- 8.1.2. Portable
- 8.2. Market Analysis, Insights and Forecast - by Technology
- 8.2.1. Analog
- 8.2.2. Digital
- 8.3. Market Analysis, Insights and Forecast - by End-user
- 8.3.1. Healthcare
- 8.3.2. Transportation and Logistics
- 8.3.3. Government
- 8.3.4. Other End-users
- 8.1. Market Analysis, Insights and Forecast - by Product Type
- 9. Latin America X Ray Machine Manufacturing Industry Analysis, Insights and Forecast, 2019-2031
- 9.1. Market Analysis, Insights and Forecast - by Product Type
- 9.1.1. Stationary
- 9.1.2. Portable
- 9.2. Market Analysis, Insights and Forecast - by Technology
- 9.2.1. Analog
- 9.2.2. Digital
- 9.3. Market Analysis, Insights and Forecast - by End-user
- 9.3.1. Healthcare
- 9.3.2. Transportation and Logistics
- 9.3.3. Government
- 9.3.4. Other End-users
- 9.1. Market Analysis, Insights and Forecast - by Product Type
- 10. Middle East and Africa X Ray Machine Manufacturing Industry Analysis, Insights and Forecast, 2019-2031
- 10.1. Market Analysis, Insights and Forecast - by Product Type
- 10.1.1. Stationary
- 10.1.2. Portable
- 10.2. Market Analysis, Insights and Forecast - by Technology
- 10.2.1. Analog
- 10.2.2. Digital
- 10.3. Market Analysis, Insights and Forecast - by End-user
- 10.3.1. Healthcare
- 10.3.2. Transportation and Logistics
- 10.3.3. Government
- 10.3.4. Other End-users
- 10.1. Market Analysis, Insights and Forecast - by Product Type
- 11. North America X Ray Machine Manufacturing Industry Analysis, Insights and Forecast, 2019-2031
- 11.1. Market Analysis, Insights and Forecast - By Country/Sub-region
- 11.1.1 United States
- 11.1.2 Canada
- 11.1.3 Mexico
- 12. Europe X Ray Machine Manufacturing Industry Analysis, Insights and Forecast, 2019-2031
- 12.1. Market Analysis, Insights and Forecast - By Country/Sub-region
- 12.1.1 Germany
- 12.1.2 United Kingdom
- 12.1.3 France
- 12.1.4 Spain
- 12.1.5 Italy
- 12.1.6 Spain
- 12.1.7 Belgium
- 12.1.8 Netherland
- 12.1.9 Nordics
- 12.1.10 Rest of Europe
- 13. Asia Pacific X Ray Machine Manufacturing Industry Analysis, Insights and Forecast, 2019-2031
- 13.1. Market Analysis, Insights and Forecast - By Country/Sub-region
- 13.1.1 China
- 13.1.2 Japan
- 13.1.3 India
- 13.1.4 South Korea
- 13.1.5 Southeast Asia
- 13.1.6 Australia
- 13.1.7 Indonesia
- 13.1.8 Phillipes
- 13.1.9 Singapore
- 13.1.10 Thailandc
- 13.1.11 Rest of Asia Pacific
- 14. South America X Ray Machine Manufacturing Industry Analysis, Insights and Forecast, 2019-2031
- 14.1. Market Analysis, Insights and Forecast - By Country/Sub-region
- 14.1.1 Brazil
- 14.1.2 Argentina
- 14.1.3 Peru
- 14.1.4 Chile
- 14.1.5 Colombia
- 14.1.6 Ecuador
- 14.1.7 Venezuela
- 14.1.8 Rest of South America
- 15. North America X Ray Machine Manufacturing Industry Analysis, Insights and Forecast, 2019-2031
- 15.1. Market Analysis, Insights and Forecast - By Country/Sub-region
- 15.1.1 United States
- 15.1.2 Canada
- 15.1.3 Mexico
- 16. MEA X Ray Machine Manufacturing Industry Analysis, Insights and Forecast, 2019-2031
- 16.1. Market Analysis, Insights and Forecast - By Country/Sub-region
- 16.1.1 United Arab Emirates
- 16.1.2 Saudi Arabia
- 16.1.3 South Africa
- 16.1.4 Rest of Middle East and Africa
- 17. Competitive Analysis
- 17.1. Global Market Share Analysis 2024
- 17.2. Company Profiles
- 17.2.1 Canon Inc
- 17.2.1.1. Overview
- 17.2.1.2. Products
- 17.2.1.3. SWOT Analysis
- 17.2.1.4. Recent Developments
- 17.2.1.5. Financials (Based on Availability)
- 17.2.2 Hologic Inc
- 17.2.2.1. Overview
- 17.2.2.2. Products
- 17.2.2.3. SWOT Analysis
- 17.2.2.4. Recent Developments
- 17.2.2.5. Financials (Based on Availability)
- 17.2.3 GE Healthcare
- 17.2.3.1. Overview
- 17.2.3.2. Products
- 17.2.3.3. SWOT Analysis
- 17.2.3.4. Recent Developments
- 17.2.3.5. Financials (Based on Availability)
- 17.2.4 Siemens AG
- 17.2.4.1. Overview
- 17.2.4.2. Products
- 17.2.4.3. SWOT Analysis
- 17.2.4.4. Recent Developments
- 17.2.4.5. Financials (Based on Availability)
- 17.2.5 Philips Healthcare
- 17.2.5.1. Overview
- 17.2.5.2. Products
- 17.2.5.3. SWOT Analysis
- 17.2.5.4. Recent Developments
- 17.2.5.5. Financials (Based on Availability)
- 17.2.6 Hindrays
- 17.2.6.1. Overview
- 17.2.6.2. Products
- 17.2.6.3. SWOT Analysis
- 17.2.6.4. Recent Developments
- 17.2.6.5. Financials (Based on Availability)
- 17.2.7 Hitachi Medical Corporation
- 17.2.7.1. Overview
- 17.2.7.2. Products
- 17.2.7.3. SWOT Analysis
- 17.2.7.4. Recent Developments
- 17.2.7.5. Financials (Based on Availability)
- 17.2.8 Vision Medicaid Equipment Private Limited
- 17.2.8.1. Overview
- 17.2.8.2. Products
- 17.2.8.3. SWOT Analysis
- 17.2.8.4. Recent Developments
- 17.2.8.5. Financials (Based on Availability)
- 17.2.9 Shimadzu Corporation
- 17.2.9.1. Overview
- 17.2.9.2. Products
- 17.2.9.3. SWOT Analysis
- 17.2.9.4. Recent Developments
- 17.2.9.5. Financials (Based on Availability)
- 17.2.10 Fujifilm Holdings Corporation
- 17.2.10.1. Overview
- 17.2.10.2. Products
- 17.2.10.3. SWOT Analysis
- 17.2.10.4. Recent Developments
- 17.2.10.5. Financials (Based on Availability)
- 17.2.1 Canon Inc
List of Figures
- Figure 1: Global X Ray Machine Manufacturing Industry Revenue Breakdown (Million, %) by Region 2024 & 2032
- Figure 2: Global X Ray Machine Manufacturing Industry Volume Breakdown (K Unit, %) by Region 2024 & 2032
- Figure 3: North America X Ray Machine Manufacturing Industry Revenue (Million), by Country 2024 & 2032
- Figure 4: North America X Ray Machine Manufacturing Industry Volume (K Unit), by Country 2024 & 2032
- Figure 5: North America X Ray Machine Manufacturing Industry Revenue Share (%), by Country 2024 & 2032
- Figure 6: North America X Ray Machine Manufacturing Industry Volume Share (%), by Country 2024 & 2032
- Figure 7: Europe X Ray Machine Manufacturing Industry Revenue (Million), by Country 2024 & 2032
- Figure 8: Europe X Ray Machine Manufacturing Industry Volume (K Unit), by Country 2024 & 2032
- Figure 9: Europe X Ray Machine Manufacturing Industry Revenue Share (%), by Country 2024 & 2032
- Figure 10: Europe X Ray Machine Manufacturing Industry Volume Share (%), by Country 2024 & 2032
- Figure 11: Asia Pacific X Ray Machine Manufacturing Industry Revenue (Million), by Country 2024 & 2032
- Figure 12: Asia Pacific X Ray Machine Manufacturing Industry Volume (K Unit), by Country 2024 & 2032
- Figure 13: Asia Pacific X Ray Machine Manufacturing Industry Revenue Share (%), by Country 2024 & 2032
- Figure 14: Asia Pacific X Ray Machine Manufacturing Industry Volume Share (%), by Country 2024 & 2032
- Figure 15: South America X Ray Machine Manufacturing Industry Revenue (Million), by Country 2024 & 2032
- Figure 16: South America X Ray Machine Manufacturing Industry Volume (K Unit), by Country 2024 & 2032
- Figure 17: South America X Ray Machine Manufacturing Industry Revenue Share (%), by Country 2024 & 2032
- Figure 18: South America X Ray Machine Manufacturing Industry Volume Share (%), by Country 2024 & 2032
- Figure 19: North America X Ray Machine Manufacturing Industry Revenue (Million), by Country 2024 & 2032
- Figure 20: North America X Ray Machine Manufacturing Industry Volume (K Unit), by Country 2024 & 2032
- Figure 21: North America X Ray Machine Manufacturing Industry Revenue Share (%), by Country 2024 & 2032
- Figure 22: North America X Ray Machine Manufacturing Industry Volume Share (%), by Country 2024 & 2032
- Figure 23: MEA X Ray Machine Manufacturing Industry Revenue (Million), by Country 2024 & 2032
- Figure 24: MEA X Ray Machine Manufacturing Industry Volume (K Unit), by Country 2024 & 2032
- Figure 25: MEA X Ray Machine Manufacturing Industry Revenue Share (%), by Country 2024 & 2032
- Figure 26: MEA X Ray Machine Manufacturing Industry Volume Share (%), by Country 2024 & 2032
- Figure 27: North America X Ray Machine Manufacturing Industry Revenue (Million), by Product Type 2024 & 2032
- Figure 28: North America X Ray Machine Manufacturing Industry Volume (K Unit), by Product Type 2024 & 2032
- Figure 29: North America X Ray Machine Manufacturing Industry Revenue Share (%), by Product Type 2024 & 2032
- Figure 30: North America X Ray Machine Manufacturing Industry Volume Share (%), by Product Type 2024 & 2032
- Figure 31: North America X Ray Machine Manufacturing Industry Revenue (Million), by Technology 2024 & 2032
- Figure 32: North America X Ray Machine Manufacturing Industry Volume (K Unit), by Technology 2024 & 2032
- Figure 33: North America X Ray Machine Manufacturing Industry Revenue Share (%), by Technology 2024 & 2032
- Figure 34: North America X Ray Machine Manufacturing Industry Volume Share (%), by Technology 2024 & 2032
- Figure 35: North America X Ray Machine Manufacturing Industry Revenue (Million), by End-user 2024 & 2032
- Figure 36: North America X Ray Machine Manufacturing Industry Volume (K Unit), by End-user 2024 & 2032
- Figure 37: North America X Ray Machine Manufacturing Industry Revenue Share (%), by End-user 2024 & 2032
- Figure 38: North America X Ray Machine Manufacturing Industry Volume Share (%), by End-user 2024 & 2032
- Figure 39: North America X Ray Machine Manufacturing Industry Revenue (Million), by Country 2024 & 2032
- Figure 40: North America X Ray Machine Manufacturing Industry Volume (K Unit), by Country 2024 & 2032
- Figure 41: North America X Ray Machine Manufacturing Industry Revenue Share (%), by Country 2024 & 2032
- Figure 42: North America X Ray Machine Manufacturing Industry Volume Share (%), by Country 2024 & 2032
- Figure 43: Europe X Ray Machine Manufacturing Industry Revenue (Million), by Product Type 2024 & 2032
- Figure 44: Europe X Ray Machine Manufacturing Industry Volume (K Unit), by Product Type 2024 & 2032
- Figure 45: Europe X Ray Machine Manufacturing Industry Revenue Share (%), by Product Type 2024 & 2032
- Figure 46: Europe X Ray Machine Manufacturing Industry Volume Share (%), by Product Type 2024 & 2032
- Figure 47: Europe X Ray Machine Manufacturing Industry Revenue (Million), by Technology 2024 & 2032
- Figure 48: Europe X Ray Machine Manufacturing Industry Volume (K Unit), by Technology 2024 & 2032
- Figure 49: Europe X Ray Machine Manufacturing Industry Revenue Share (%), by Technology 2024 & 2032
- Figure 50: Europe X Ray Machine Manufacturing Industry Volume Share (%), by Technology 2024 & 2032
- Figure 51: Europe X Ray Machine Manufacturing Industry Revenue (Million), by End-user 2024 & 2032
- Figure 52: Europe X Ray Machine Manufacturing Industry Volume (K Unit), by End-user 2024 & 2032
- Figure 53: Europe X Ray Machine Manufacturing Industry Revenue Share (%), by End-user 2024 & 2032
- Figure 54: Europe X Ray Machine Manufacturing Industry Volume Share (%), by End-user 2024 & 2032
- Figure 55: Europe X Ray Machine Manufacturing Industry Revenue (Million), by Country 2024 & 2032
- Figure 56: Europe X Ray Machine Manufacturing Industry Volume (K Unit), by Country 2024 & 2032
- Figure 57: Europe X Ray Machine Manufacturing Industry Revenue Share (%), by Country 2024 & 2032
- Figure 58: Europe X Ray Machine Manufacturing Industry Volume Share (%), by Country 2024 & 2032
- Figure 59: Asia X Ray Machine Manufacturing Industry Revenue (Million), by Product Type 2024 & 2032
- Figure 60: Asia X Ray Machine Manufacturing Industry Volume (K Unit), by Product Type 2024 & 2032
- Figure 61: Asia X Ray Machine Manufacturing Industry Revenue Share (%), by Product Type 2024 & 2032
- Figure 62: Asia X Ray Machine Manufacturing Industry Volume Share (%), by Product Type 2024 & 2032
- Figure 63: Asia X Ray Machine Manufacturing Industry Revenue (Million), by Technology 2024 & 2032
- Figure 64: Asia X Ray Machine Manufacturing Industry Volume (K Unit), by Technology 2024 & 2032
- Figure 65: Asia X Ray Machine Manufacturing Industry Revenue Share (%), by Technology 2024 & 2032
- Figure 66: Asia X Ray Machine Manufacturing Industry Volume Share (%), by Technology 2024 & 2032
- Figure 67: Asia X Ray Machine Manufacturing Industry Revenue (Million), by End-user 2024 & 2032
- Figure 68: Asia X Ray Machine Manufacturing Industry Volume (K Unit), by End-user 2024 & 2032
- Figure 69: Asia X Ray Machine Manufacturing Industry Revenue Share (%), by End-user 2024 & 2032
- Figure 70: Asia X Ray Machine Manufacturing Industry Volume Share (%), by End-user 2024 & 2032
- Figure 71: Asia X Ray Machine Manufacturing Industry Revenue (Million), by Country 2024 & 2032
- Figure 72: Asia X Ray Machine Manufacturing Industry Volume (K Unit), by Country 2024 & 2032
- Figure 73: Asia X Ray Machine Manufacturing Industry Revenue Share (%), by Country 2024 & 2032
- Figure 74: Asia X Ray Machine Manufacturing Industry Volume Share (%), by Country 2024 & 2032
- Figure 75: Latin America X Ray Machine Manufacturing Industry Revenue (Million), by Product Type 2024 & 2032
- Figure 76: Latin America X Ray Machine Manufacturing Industry Volume (K Unit), by Product Type 2024 & 2032
- Figure 77: Latin America X Ray Machine Manufacturing Industry Revenue Share (%), by Product Type 2024 & 2032
- Figure 78: Latin America X Ray Machine Manufacturing Industry Volume Share (%), by Product Type 2024 & 2032
- Figure 79: Latin America X Ray Machine Manufacturing Industry Revenue (Million), by Technology 2024 & 2032
- Figure 80: Latin America X Ray Machine Manufacturing Industry Volume (K Unit), by Technology 2024 & 2032
- Figure 81: Latin America X Ray Machine Manufacturing Industry Revenue Share (%), by Technology 2024 & 2032
- Figure 82: Latin America X Ray Machine Manufacturing Industry Volume Share (%), by Technology 2024 & 2032
- Figure 83: Latin America X Ray Machine Manufacturing Industry Revenue (Million), by End-user 2024 & 2032
- Figure 84: Latin America X Ray Machine Manufacturing Industry Volume (K Unit), by End-user 2024 & 2032
- Figure 85: Latin America X Ray Machine Manufacturing Industry Revenue Share (%), by End-user 2024 & 2032
- Figure 86: Latin America X Ray Machine Manufacturing Industry Volume Share (%), by End-user 2024 & 2032
- Figure 87: Latin America X Ray Machine Manufacturing Industry Revenue (Million), by Country 2024 & 2032
- Figure 88: Latin America X Ray Machine Manufacturing Industry Volume (K Unit), by Country 2024 & 2032
- Figure 89: Latin America X Ray Machine Manufacturing Industry Revenue Share (%), by Country 2024 & 2032
- Figure 90: Latin America X Ray Machine Manufacturing Industry Volume Share (%), by Country 2024 & 2032
- Figure 91: Middle East and Africa X Ray Machine Manufacturing Industry Revenue (Million), by Product Type 2024 & 2032
- Figure 92: Middle East and Africa X Ray Machine Manufacturing Industry Volume (K Unit), by Product Type 2024 & 2032
- Figure 93: Middle East and Africa X Ray Machine Manufacturing Industry Revenue Share (%), by Product Type 2024 & 2032
- Figure 94: Middle East and Africa X Ray Machine Manufacturing Industry Volume Share (%), by Product Type 2024 & 2032
- Figure 95: Middle East and Africa X Ray Machine Manufacturing Industry Revenue (Million), by Technology 2024 & 2032
- Figure 96: Middle East and Africa X Ray Machine Manufacturing Industry Volume (K Unit), by Technology 2024 & 2032
- Figure 97: Middle East and Africa X Ray Machine Manufacturing Industry Revenue Share (%), by Technology 2024 & 2032
- Figure 98: Middle East and Africa X Ray Machine Manufacturing Industry Volume Share (%), by Technology 2024 & 2032
- Figure 99: Middle East and Africa X Ray Machine Manufacturing Industry Revenue (Million), by End-user 2024 & 2032
- Figure 100: Middle East and Africa X Ray Machine Manufacturing Industry Volume (K Unit), by End-user 2024 & 2032
- Figure 101: Middle East and Africa X Ray Machine Manufacturing Industry Revenue Share (%), by End-user 2024 & 2032
- Figure 102: Middle East and Africa X Ray Machine Manufacturing Industry Volume Share (%), by End-user 2024 & 2032
- Figure 103: Middle East and Africa X Ray Machine Manufacturing Industry Revenue (Million), by Country 2024 & 2032
- Figure 104: Middle East and Africa X Ray Machine Manufacturing Industry Volume (K Unit), by Country 2024 & 2032
- Figure 105: Middle East and Africa X Ray Machine Manufacturing Industry Revenue Share (%), by Country 2024 & 2032
- Figure 106: Middle East and Africa X Ray Machine Manufacturing Industry Volume Share (%), by Country 2024 & 2032
List of Tables
- Table 1: Global X Ray Machine Manufacturing Industry Revenue Million Forecast, by Region 2019 & 2032
- Table 2: Global X Ray Machine Manufacturing Industry Volume K Unit Forecast, by Region 2019 & 2032
- Table 3: Global X Ray Machine Manufacturing Industry Revenue Million Forecast, by Product Type 2019 & 2032
- Table 4: Global X Ray Machine Manufacturing Industry Volume K Unit Forecast, by Product Type 2019 & 2032
- Table 5: Global X Ray Machine Manufacturing Industry Revenue Million Forecast, by Technology 2019 & 2032
- Table 6: Global X Ray Machine Manufacturing Industry Volume K Unit Forecast, by Technology 2019 & 2032
- Table 7: Global X Ray Machine Manufacturing Industry Revenue Million Forecast, by End-user 2019 & 2032
- Table 8: Global X Ray Machine Manufacturing Industry Volume K Unit Forecast, by End-user 2019 & 2032
- Table 9: Global X Ray Machine Manufacturing Industry Revenue Million Forecast, by Region 2019 & 2032
- Table 10: Global X Ray Machine Manufacturing Industry Volume K Unit Forecast, by Region 2019 & 2032
- Table 11: Global X Ray Machine Manufacturing Industry Revenue Million Forecast, by Country 2019 & 2032
- Table 12: Global X Ray Machine Manufacturing Industry Volume K Unit Forecast, by Country 2019 & 2032
- Table 13: United States X Ray Machine Manufacturing Industry Revenue (Million) Forecast, by Application 2019 & 2032
- Table 14: United States X Ray Machine Manufacturing Industry Volume (K Unit) Forecast, by Application 2019 & 2032
- Table 15: Canada X Ray Machine Manufacturing Industry Revenue (Million) Forecast, by Application 2019 & 2032
- Table 16: Canada X Ray Machine Manufacturing Industry Volume (K Unit) Forecast, by Application 2019 & 2032
- Table 17: Mexico X Ray Machine Manufacturing Industry Revenue (Million) Forecast, by Application 2019 & 2032
- Table 18: Mexico X Ray Machine Manufacturing Industry Volume (K Unit) Forecast, by Application 2019 & 2032
- Table 19: Global X Ray Machine Manufacturing Industry Revenue Million Forecast, by Country 2019 & 2032
- Table 20: Global X Ray Machine Manufacturing Industry Volume K Unit Forecast, by Country 2019 & 2032
- Table 21: Germany X Ray Machine Manufacturing Industry Revenue (Million) Forecast, by Application 2019 & 2032
- Table 22: Germany X Ray Machine Manufacturing Industry Volume (K Unit) Forecast, by Application 2019 & 2032
- Table 23: United Kingdom X Ray Machine Manufacturing Industry Revenue (Million) Forecast, by Application 2019 & 2032
- Table 24: United Kingdom X Ray Machine Manufacturing Industry Volume (K Unit) Forecast, by Application 2019 & 2032
- Table 25: France X Ray Machine Manufacturing Industry Revenue (Million) Forecast, by Application 2019 & 2032
- Table 26: France X Ray Machine Manufacturing Industry Volume (K Unit) Forecast, by Application 2019 & 2032
- Table 27: Spain X Ray Machine Manufacturing Industry Revenue (Million) Forecast, by Application 2019 & 2032
- Table 28: Spain X Ray Machine Manufacturing Industry Volume (K Unit) Forecast, by Application 2019 & 2032
- Table 29: Italy X Ray Machine Manufacturing Industry Revenue (Million) Forecast, by Application 2019 & 2032
- Table 30: Italy X Ray Machine Manufacturing Industry Volume (K Unit) Forecast, by Application 2019 & 2032
- Table 31: Spain X Ray Machine Manufacturing Industry Revenue (Million) Forecast, by Application 2019 & 2032
- Table 32: Spain X Ray Machine Manufacturing Industry Volume (K Unit) Forecast, by Application 2019 & 2032
- Table 33: Belgium X Ray Machine Manufacturing Industry Revenue (Million) Forecast, by Application 2019 & 2032
- Table 34: Belgium X Ray Machine Manufacturing Industry Volume (K Unit) Forecast, by Application 2019 & 2032
- Table 35: Netherland X Ray Machine Manufacturing Industry Revenue (Million) Forecast, by Application 2019 & 2032
- Table 36: Netherland X Ray Machine Manufacturing Industry Volume (K Unit) Forecast, by Application 2019 & 2032
- Table 37: Nordics X Ray Machine Manufacturing Industry Revenue (Million) Forecast, by Application 2019 & 2032
- Table 38: Nordics X Ray Machine Manufacturing Industry Volume (K Unit) Forecast, by Application 2019 & 2032
- Table 39: Rest of Europe X Ray Machine Manufacturing Industry Revenue (Million) Forecast, by Application 2019 & 2032
- Table 40: Rest of Europe X Ray Machine Manufacturing Industry Volume (K Unit) Forecast, by Application 2019 & 2032
- Table 41: Global X Ray Machine Manufacturing Industry Revenue Million Forecast, by Country 2019 & 2032
- Table 42: Global X Ray Machine Manufacturing Industry Volume K Unit Forecast, by Country 2019 & 2032
- Table 43: China X Ray Machine Manufacturing Industry Revenue (Million) Forecast, by Application 2019 & 2032
- Table 44: China X Ray Machine Manufacturing Industry Volume (K Unit) Forecast, by Application 2019 & 2032
- Table 45: Japan X Ray Machine Manufacturing Industry Revenue (Million) Forecast, by Application 2019 & 2032
- Table 46: Japan X Ray Machine Manufacturing Industry Volume (K Unit) Forecast, by Application 2019 & 2032
- Table 47: India X Ray Machine Manufacturing Industry Revenue (Million) Forecast, by Application 2019 & 2032
- Table 48: India X Ray Machine Manufacturing Industry Volume (K Unit) Forecast, by Application 2019 & 2032
- Table 49: South Korea X Ray Machine Manufacturing Industry Revenue (Million) Forecast, by Application 2019 & 2032
- Table 50: South Korea X Ray Machine Manufacturing Industry Volume (K Unit) Forecast, by Application 2019 & 2032
- Table 51: Southeast Asia X Ray Machine Manufacturing Industry Revenue (Million) Forecast, by Application 2019 & 2032
- Table 52: Southeast Asia X Ray Machine Manufacturing Industry Volume (K Unit) Forecast, by Application 2019 & 2032
- Table 53: Australia X Ray Machine Manufacturing Industry Revenue (Million) Forecast, by Application 2019 & 2032
- Table 54: Australia X Ray Machine Manufacturing Industry Volume (K Unit) Forecast, by Application 2019 & 2032
- Table 55: Indonesia X Ray Machine Manufacturing Industry Revenue (Million) Forecast, by Application 2019 & 2032
- Table 56: Indonesia X Ray Machine Manufacturing Industry Volume (K Unit) Forecast, by Application 2019 & 2032
- Table 57: Phillipes X Ray Machine Manufacturing Industry Revenue (Million) Forecast, by Application 2019 & 2032
- Table 58: Phillipes X Ray Machine Manufacturing Industry Volume (K Unit) Forecast, by Application 2019 & 2032
- Table 59: Singapore X Ray Machine Manufacturing Industry Revenue (Million) Forecast, by Application 2019 & 2032
- Table 60: Singapore X Ray Machine Manufacturing Industry Volume (K Unit) Forecast, by Application 2019 & 2032
- Table 61: Thailandc X Ray Machine Manufacturing Industry Revenue (Million) Forecast, by Application 2019 & 2032
- Table 62: Thailandc X Ray Machine Manufacturing Industry Volume (K Unit) Forecast, by Application 2019 & 2032
- Table 63: Rest of Asia Pacific X Ray Machine Manufacturing Industry Revenue (Million) Forecast, by Application 2019 & 2032
- Table 64: Rest of Asia Pacific X Ray Machine Manufacturing Industry Volume (K Unit) Forecast, by Application 2019 & 2032
- Table 65: Global X Ray Machine Manufacturing Industry Revenue Million Forecast, by Country 2019 & 2032
- Table 66: Global X Ray Machine Manufacturing Industry Volume K Unit Forecast, by Country 2019 & 2032
- Table 67: Brazil X Ray Machine Manufacturing Industry Revenue (Million) Forecast, by Application 2019 & 2032
- Table 68: Brazil X Ray Machine Manufacturing Industry Volume (K Unit) Forecast, by Application 2019 & 2032
- Table 69: Argentina X Ray Machine Manufacturing Industry Revenue (Million) Forecast, by Application 2019 & 2032
- Table 70: Argentina X Ray Machine Manufacturing Industry Volume (K Unit) Forecast, by Application 2019 & 2032
- Table 71: Peru X Ray Machine Manufacturing Industry Revenue (Million) Forecast, by Application 2019 & 2032
- Table 72: Peru X Ray Machine Manufacturing Industry Volume (K Unit) Forecast, by Application 2019 & 2032
- Table 73: Chile X Ray Machine Manufacturing Industry Revenue (Million) Forecast, by Application 2019 & 2032
- Table 74: Chile X Ray Machine Manufacturing Industry Volume (K Unit) Forecast, by Application 2019 & 2032
- Table 75: Colombia X Ray Machine Manufacturing Industry Revenue (Million) Forecast, by Application 2019 & 2032
- Table 76: Colombia X Ray Machine Manufacturing Industry Volume (K Unit) Forecast, by Application 2019 & 2032
- Table 77: Ecuador X Ray Machine Manufacturing Industry Revenue (Million) Forecast, by Application 2019 & 2032
- Table 78: Ecuador X Ray Machine Manufacturing Industry Volume (K Unit) Forecast, by Application 2019 & 2032
- Table 79: Venezuela X Ray Machine Manufacturing Industry Revenue (Million) Forecast, by Application 2019 & 2032
- Table 80: Venezuela X Ray Machine Manufacturing Industry Volume (K Unit) Forecast, by Application 2019 & 2032
- Table 81: Rest of South America X Ray Machine Manufacturing Industry Revenue (Million) Forecast, by Application 2019 & 2032
- Table 82: Rest of South America X Ray Machine Manufacturing Industry Volume (K Unit) Forecast, by Application 2019 & 2032
- Table 83: Global X Ray Machine Manufacturing Industry Revenue Million Forecast, by Country 2019 & 2032
- Table 84: Global X Ray Machine Manufacturing Industry Volume K Unit Forecast, by Country 2019 & 2032
- Table 85: United States X Ray Machine Manufacturing Industry Revenue (Million) Forecast, by Application 2019 & 2032
- Table 86: United States X Ray Machine Manufacturing Industry Volume (K Unit) Forecast, by Application 2019 & 2032
- Table 87: Canada X Ray Machine Manufacturing Industry Revenue (Million) Forecast, by Application 2019 & 2032
- Table 88: Canada X Ray Machine Manufacturing Industry Volume (K Unit) Forecast, by Application 2019 & 2032
- Table 89: Mexico X Ray Machine Manufacturing Industry Revenue (Million) Forecast, by Application 2019 & 2032
- Table 90: Mexico X Ray Machine Manufacturing Industry Volume (K Unit) Forecast, by Application 2019 & 2032
- Table 91: Global X Ray Machine Manufacturing Industry Revenue Million Forecast, by Country 2019 & 2032
- Table 92: Global X Ray Machine Manufacturing Industry Volume K Unit Forecast, by Country 2019 & 2032
- Table 93: United Arab Emirates X Ray Machine Manufacturing Industry Revenue (Million) Forecast, by Application 2019 & 2032
- Table 94: United Arab Emirates X Ray Machine Manufacturing Industry Volume (K Unit) Forecast, by Application 2019 & 2032
- Table 95: Saudi Arabia X Ray Machine Manufacturing Industry Revenue (Million) Forecast, by Application 2019 & 2032
- Table 96: Saudi Arabia X Ray Machine Manufacturing Industry Volume (K Unit) Forecast, by Application 2019 & 2032
- Table 97: South Africa X Ray Machine Manufacturing Industry Revenue (Million) Forecast, by Application 2019 & 2032
- Table 98: South Africa X Ray Machine Manufacturing Industry Volume (K Unit) Forecast, by Application 2019 & 2032
- Table 99: Rest of Middle East and Africa X Ray Machine Manufacturing Industry Revenue (Million) Forecast, by Application 2019 & 2032
- Table 100: Rest of Middle East and Africa X Ray Machine Manufacturing Industry Volume (K Unit) Forecast, by Application 2019 & 2032
- Table 101: Global X Ray Machine Manufacturing Industry Revenue Million Forecast, by Product Type 2019 & 2032
- Table 102: Global X Ray Machine Manufacturing Industry Volume K Unit Forecast, by Product Type 2019 & 2032
- Table 103: Global X Ray Machine Manufacturing Industry Revenue Million Forecast, by Technology 2019 & 2032
- Table 104: Global X Ray Machine Manufacturing Industry Volume K Unit Forecast, by Technology 2019 & 2032
- Table 105: Global X Ray Machine Manufacturing Industry Revenue Million Forecast, by End-user 2019 & 2032
- Table 106: Global X Ray Machine Manufacturing Industry Volume K Unit Forecast, by End-user 2019 & 2032
- Table 107: Global X Ray Machine Manufacturing Industry Revenue Million Forecast, by Country 2019 & 2032
- Table 108: Global X Ray Machine Manufacturing Industry Volume K Unit Forecast, by Country 2019 & 2032
- Table 109: United States X Ray Machine Manufacturing Industry Revenue (Million) Forecast, by Application 2019 & 2032
- Table 110: United States X Ray Machine Manufacturing Industry Volume (K Unit) Forecast, by Application 2019 & 2032
- Table 111: Canada X Ray Machine Manufacturing Industry Revenue (Million) Forecast, by Application 2019 & 2032
- Table 112: Canada X Ray Machine Manufacturing Industry Volume (K Unit) Forecast, by Application 2019 & 2032
- Table 113: Global X Ray Machine Manufacturing Industry Revenue Million Forecast, by Product Type 2019 & 2032
- Table 114: Global X Ray Machine Manufacturing Industry Volume K Unit Forecast, by Product Type 2019 & 2032
- Table 115: Global X Ray Machine Manufacturing Industry Revenue Million Forecast, by Technology 2019 & 2032
- Table 116: Global X Ray Machine Manufacturing Industry Volume K Unit Forecast, by Technology 2019 & 2032
- Table 117: Global X Ray Machine Manufacturing Industry Revenue Million Forecast, by End-user 2019 & 2032
- Table 118: Global X Ray Machine Manufacturing Industry Volume K Unit Forecast, by End-user 2019 & 2032
- Table 119: Global X Ray Machine Manufacturing Industry Revenue Million Forecast, by Country 2019 & 2032
- Table 120: Global X Ray Machine Manufacturing Industry Volume K Unit Forecast, by Country 2019 & 2032
- Table 121: United Kingdom X Ray Machine Manufacturing Industry Revenue (Million) Forecast, by Application 2019 & 2032
- Table 122: United Kingdom X Ray Machine Manufacturing Industry Volume (K Unit) Forecast, by Application 2019 & 2032
- Table 123: Germany X Ray Machine Manufacturing Industry Revenue (Million) Forecast, by Application 2019 & 2032
- Table 124: Germany X Ray Machine Manufacturing Industry Volume (K Unit) Forecast, by Application 2019 & 2032
- Table 125: France X Ray Machine Manufacturing Industry Revenue (Million) Forecast, by Application 2019 & 2032
- Table 126: France X Ray Machine Manufacturing Industry Volume (K Unit) Forecast, by Application 2019 & 2032
- Table 127: Global X Ray Machine Manufacturing Industry Revenue Million Forecast, by Product Type 2019 & 2032
- Table 128: Global X Ray Machine Manufacturing Industry Volume K Unit Forecast, by Product Type 2019 & 2032
- Table 129: Global X Ray Machine Manufacturing Industry Revenue Million Forecast, by Technology 2019 & 2032
- Table 130: Global X Ray Machine Manufacturing Industry Volume K Unit Forecast, by Technology 2019 & 2032
- Table 131: Global X Ray Machine Manufacturing Industry Revenue Million Forecast, by End-user 2019 & 2032
- Table 132: Global X Ray Machine Manufacturing Industry Volume K Unit Forecast, by End-user 2019 & 2032
- Table 133: Global X Ray Machine Manufacturing Industry Revenue Million Forecast, by Country 2019 & 2032
- Table 134: Global X Ray Machine Manufacturing Industry Volume K Unit Forecast, by Country 2019 & 2032
- Table 135: China X Ray Machine Manufacturing Industry Revenue (Million) Forecast, by Application 2019 & 2032
- Table 136: China X Ray Machine Manufacturing Industry Volume (K Unit) Forecast, by Application 2019 & 2032
- Table 137: Japan X Ray Machine Manufacturing Industry Revenue (Million) Forecast, by Application 2019 & 2032
- Table 138: Japan X Ray Machine Manufacturing Industry Volume (K Unit) Forecast, by Application 2019 & 2032
- Table 139: India X Ray Machine Manufacturing Industry Revenue (Million) Forecast, by Application 2019 & 2032
- Table 140: India X Ray Machine Manufacturing Industry Volume (K Unit) Forecast, by Application 2019 & 2032
- Table 141: South Korea X Ray Machine Manufacturing Industry Revenue (Million) Forecast, by Application 2019 & 2032
- Table 142: South Korea X Ray Machine Manufacturing Industry Volume (K Unit) Forecast, by Application 2019 & 2032
- Table 143: Global X Ray Machine Manufacturing Industry Revenue Million Forecast, by Product Type 2019 & 2032
- Table 144: Global X Ray Machine Manufacturing Industry Volume K Unit Forecast, by Product Type 2019 & 2032
- Table 145: Global X Ray Machine Manufacturing Industry Revenue Million Forecast, by Technology 2019 & 2032
- Table 146: Global X Ray Machine Manufacturing Industry Volume K Unit Forecast, by Technology 2019 & 2032
- Table 147: Global X Ray Machine Manufacturing Industry Revenue Million Forecast, by End-user 2019 & 2032
- Table 148: Global X Ray Machine Manufacturing Industry Volume K Unit Forecast, by End-user 2019 & 2032
- Table 149: Global X Ray Machine Manufacturing Industry Revenue Million Forecast, by Country 2019 & 2032
- Table 150: Global X Ray Machine Manufacturing Industry Volume K Unit Forecast, by Country 2019 & 2032
- Table 151: Global X Ray Machine Manufacturing Industry Revenue Million Forecast, by Product Type 2019 & 2032
- Table 152: Global X Ray Machine Manufacturing Industry Volume K Unit Forecast, by Product Type 2019 & 2032
- Table 153: Global X Ray Machine Manufacturing Industry Revenue Million Forecast, by Technology 2019 & 2032
- Table 154: Global X Ray Machine Manufacturing Industry Volume K Unit Forecast, by Technology 2019 & 2032
- Table 155: Global X Ray Machine Manufacturing Industry Revenue Million Forecast, by End-user 2019 & 2032
- Table 156: Global X Ray Machine Manufacturing Industry Volume K Unit Forecast, by End-user 2019 & 2032
- Table 157: Global X Ray Machine Manufacturing Industry Revenue Million Forecast, by Country 2019 & 2032
- Table 158: Global X Ray Machine Manufacturing Industry Volume K Unit Forecast, by Country 2019 & 2032
Frequently Asked Questions
1. What is the projected Compound Annual Growth Rate (CAGR) of the X Ray Machine Manufacturing Industry?
The projected CAGR is approximately 5.69%.
2. Which companies are prominent players in the X Ray Machine Manufacturing Industry?
Key companies in the market include Canon Inc, Hologic Inc, GE Healthcare, Siemens AG, Philips Healthcare, Hindrays, Hitachi Medical Corporation, Vision Medicaid Equipment Private Limited, Shimadzu Corporation, Fujifilm Holdings Corporation.
3. What are the main segments of the X Ray Machine Manufacturing Industry?
The market segments include Product Type, Technology, End-user.
4. Can you provide details about the market size?
The market size is estimated to be USD 17.70 Million as of 2022.
5. What are some drivers contributing to market growth?
Rise in Adoption of Digital X-ray Systems; Government Regulations and Investments to Improve Infrastructure.
6. What are the notable trends driving market growth?
Healthcare Sector is Expected to Hold a Significant Market Share.
7. Are there any restraints impacting market growth?
High Cost of the Equipment.
8. Can you provide examples of recent developments in the market?
November 2022: Konica Minolta Healthcare Americas, Inc., a global leader in medical diagnostic imaging and healthcare information technology, introduced groundbreaking digital radiography (DR) technologies designed to revolutionize the clinical utility of X-rays.
9. What pricing options are available for accessing the report?
Pricing options include single-user, multi-user, and enterprise licenses priced at USD 4750, USD 5250, and USD 8750 respectively.
10. Is the market size provided in terms of value or volume?
The market size is provided in terms of value, measured in Million and volume, measured in K Unit.
11. Are there any specific market keywords associated with the report?
Yes, the market keyword associated with the report is "X Ray Machine Manufacturing Industry," which aids in identifying and referencing the specific market segment covered.
12. How do I determine which pricing option suits my needs best?
The pricing options vary based on user requirements and access needs. Individual users may opt for single-user licenses, while businesses requiring broader access may choose multi-user or enterprise licenses for cost-effective access to the report.
13. Are there any additional resources or data provided in the X Ray Machine Manufacturing Industry report?
While the report offers comprehensive insights, it's advisable to review the specific contents or supplementary materials provided to ascertain if additional resources or data are available.
14. How can I stay updated on further developments or reports in the X Ray Machine Manufacturing Industry?
To stay informed about further developments, trends, and reports in the X Ray Machine Manufacturing Industry, consider subscribing to industry newsletters, following relevant companies and organizations, or regularly checking reputable industry news sources and publications.
Methodology
Step 1 - Identification of Relevant Samples Size from Population Database


Step 2 - Approaches for Defining Global Market Size (Value, Volume* & Price*)

Note*: In applicable scenarios
Step 3 - Data Sources
Primary Research
- Web Analytics
- Survey Reports
- Research Institute
- Latest Research Reports
- Opinion Leaders
Secondary Research
- Annual Reports
- White Paper
- Latest Press Release
- Industry Association
- Paid Database
- Investor Presentations

Step 4 - Data Triangulation
Involves using different sources of information in order to increase the validity of a study
These sources are likely to be stakeholders in a program - participants, other researchers, program staff, other community members, and so on.
Then we put all data in single framework & apply various statistical tools to find out the dynamic on the market.
During the analysis stage, feedback from the stakeholder groups would be compared to determine areas of agreement as well as areas of divergence
