

Key Insights
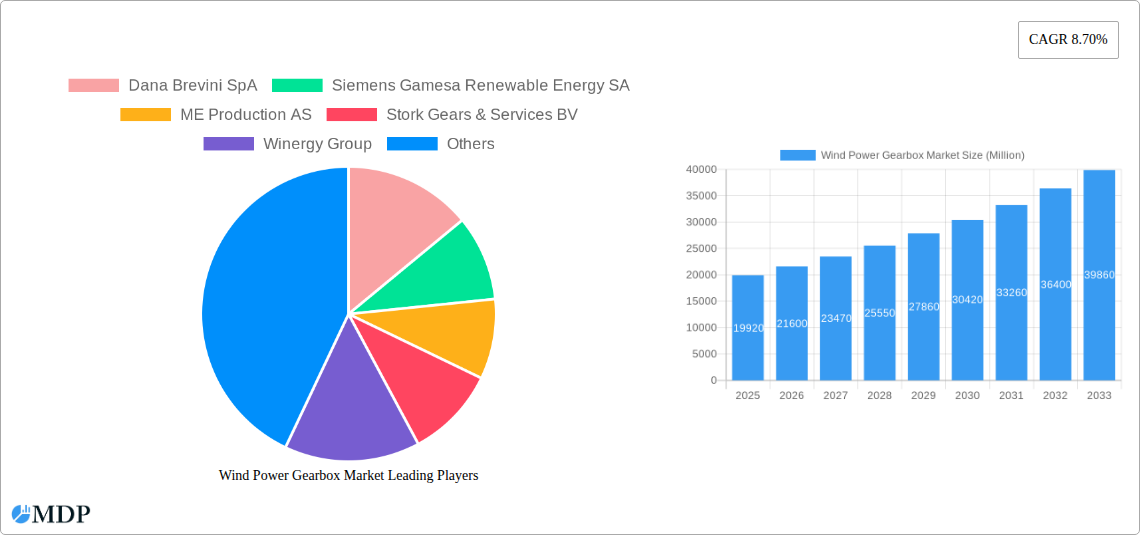
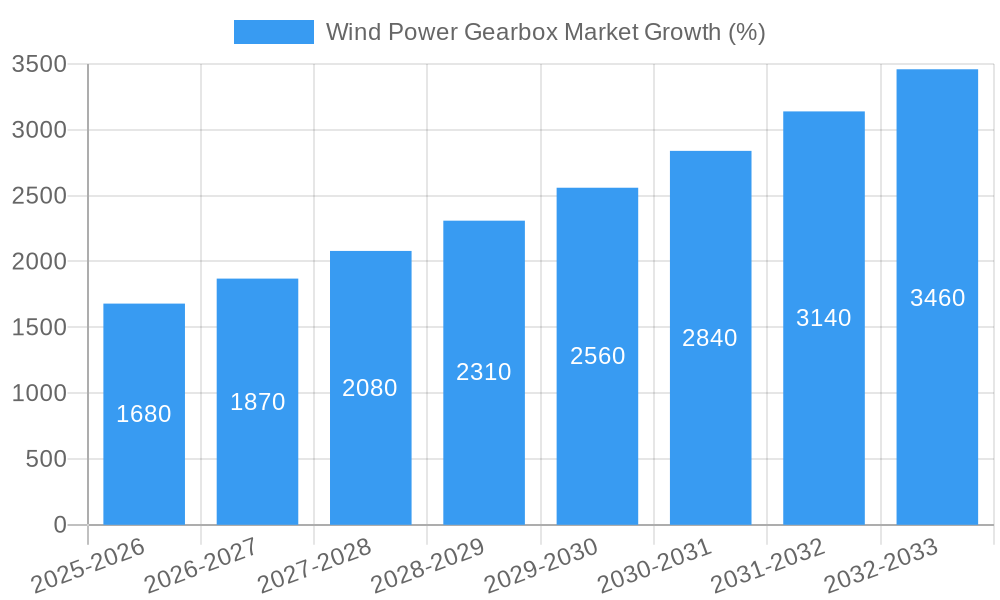
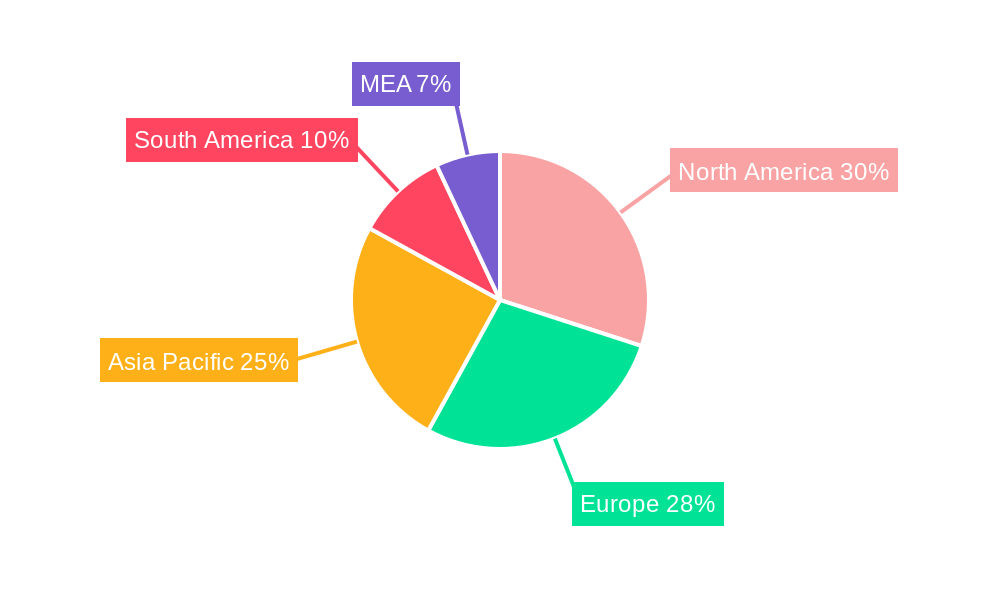
The global wind power gearbox market is experiencing robust growth, projected to reach \$19.92 billion in 2025 and maintain a Compound Annual Growth Rate (CAGR) of 8.70% from 2025 to 2033. This expansion is driven primarily by the increasing global demand for renewable energy sources, particularly wind power, fueled by government initiatives promoting sustainable energy and a growing awareness of climate change. Technological advancements in gearbox design, leading to higher efficiency, increased durability, and reduced maintenance costs, further contribute to market growth. The onshore segment currently dominates the market due to its established infrastructure and lower installation costs compared to offshore installations. However, the offshore segment is expected to witness significant growth in the forecast period due to higher wind speeds and capacity factors in offshore locations, coupled with ongoing advancements in offshore wind turbine technology. Key players in the market, including Dana Brevini SpA, Siemens Gamesa Renewable Energy SA, and ZF Friedrichshafen AG, are focusing on research and development to improve gearbox performance and expand their market share through strategic partnerships and acquisitions. Regional variations exist, with North America and Europe holding substantial market shares currently, although the Asia-Pacific region, particularly China and India, is anticipated to demonstrate the fastest growth rate due to large-scale wind energy projects underway. Challenges to market growth include the high initial investment costs associated with wind turbine installation and the need for robust maintenance strategies to ensure optimal gearbox performance throughout its operational lifespan.
The competitive landscape is characterized by both established industry giants and specialized gearbox manufacturers. Competition is primarily focused on offering superior gearbox technology, reliable after-sales service, and competitive pricing. The market is witnessing increasing consolidation through mergers and acquisitions as companies seek to expand their product portfolio and geographical reach. Future growth will depend significantly on continued technological innovation, government policies supporting renewable energy adoption, and the overall growth of the wind energy sector globally. The increasing focus on larger capacity wind turbines and offshore deployments will be key drivers for future market expansion, presenting both opportunities and challenges for existing and new entrants. The overall outlook for the wind power gearbox market remains positive, driven by sustainable energy demand and the continuous advancement of wind energy technologies.
Wind Power Gearbox Market: A Comprehensive Report (2019-2033)
This in-depth report provides a comprehensive analysis of the Wind Power Gearbox Market, offering invaluable insights for industry stakeholders, investors, and strategic decision-makers. Covering the period from 2019 to 2033, with a focus on 2025, this report unveils the market's dynamics, trends, leading players, and future outlook. Expect detailed analysis of market size, growth projections, segment performance, and key technological advancements, all supported by robust data and expert analysis. The market is projected to reach xx Million by 2033.
Wind Power Gearbox Market Dynamics & Concentration
The Wind Power Gearbox Market exhibits a moderately concentrated landscape, with several key players holding significant market share. Market concentration is influenced by factors such as technological advancements, economies of scale, and strategic mergers & acquisitions (M&A). Innovation, particularly in materials science and manufacturing processes, is a major driver, enabling the production of more efficient and durable gearboxes. Stringent regulatory frameworks concerning energy efficiency and environmental impact further shape market dynamics. The presence of substitute technologies, such as direct-drive systems, presents a competitive challenge. However, the growing demand for wind energy globally continues to fuel market growth.
- Market Share: The top 5 players collectively hold approximately xx% of the market share in 2025.
- M&A Activity: The number of M&A deals in the sector has averaged xx per year during the historical period (2019-2024), indicating a high level of consolidation.
- End-User Trends: The increasing adoption of larger wind turbines, both onshore and offshore, is driving demand for higher-capacity gearboxes.
Wind Power Gearbox Market Industry Trends & Analysis
The Wind Power Gearbox Market is experiencing robust growth, driven by the global expansion of wind energy capacity. The Compound Annual Growth Rate (CAGR) is estimated at xx% during the forecast period (2025-2033). Technological disruptions, such as the development of more efficient gearbox designs and the adoption of advanced materials, are significantly impacting market dynamics. Consumer preferences are increasingly shifting towards sustainable energy solutions, boosting demand for wind power and consequently, gearboxes. Competitive dynamics are intense, with key players focusing on innovation, cost optimization, and strategic partnerships to gain a competitive edge. Market penetration of advanced gearbox technologies is projected to reach xx% by 2033.
Leading Markets & Segments in Wind Power Gearbox Market
The onshore segment currently dominates the Wind Power Gearbox Market, accounting for approximately xx% of the total market value in 2025. However, the offshore segment is experiencing faster growth due to the increasing focus on harnessing offshore wind resources.
Onshore Segment Key Drivers:
- Favorable government policies and subsidies promoting renewable energy adoption.
- Relatively lower installation costs compared to offshore wind farms.
- Extensive land availability in certain regions.
Offshore Segment Key Drivers:
- Higher wind speeds and energy yields compared to onshore locations.
- Growing investment in offshore wind farm projects globally.
- Technological advancements enabling efficient and cost-effective offshore installations.
The Asia-Pacific region is expected to remain the leading market for wind power gearboxes throughout the forecast period, driven by strong government support for renewable energy and rapid economic growth. Europe and North America also represent substantial markets.
Wind Power Gearbox Market Product Developments
Recent product innovations have focused on increasing gearbox efficiency, durability, and reducing weight. Advanced materials, optimized designs, and improved lubrication systems are key aspects of these developments. These innovations enhance turbine performance, reduce maintenance costs, and extend the lifespan of wind turbines, contributing to a more economically viable wind energy sector. The market is witnessing a shift towards higher-capacity gearboxes designed for larger wind turbines.
Key Drivers of Wind Power Gearbox Market Growth
The Wind Power Gearbox Market is propelled by several key factors:
- Government Regulations: Stringent environmental regulations and targets for renewable energy adoption are driving demand for wind power.
- Technological Advancements: Innovations in gearbox design and materials are leading to greater efficiency and reduced costs.
- Falling Costs of Wind Energy: The declining cost of wind energy is making it increasingly competitive with fossil fuels, stimulating market growth.
Challenges in the Wind Power Gearbox Market
Several challenges impede market growth:
- Supply Chain Disruptions: Global supply chain issues can impact the availability and cost of raw materials and components. This effect can be quantified by a xx% increase in production costs during peak disruption periods.
- High Initial Investment Costs: The significant upfront investment required for wind turbine installations can be a barrier to entry for some developers.
- Competition from Direct-Drive Systems: Direct-drive technology is a potential substitute, although it is currently more expensive.
Emerging Opportunities in Wind Power Gearbox Market
Several factors present significant opportunities for growth:
- Offshore Wind Expansion: The vast potential of offshore wind energy presents a substantial market opportunity for high-capacity gearboxes.
- Technological Breakthroughs: Continued research and development in materials science and gearbox design will drive efficiency gains.
- Strategic Partnerships: Collaborations between gearbox manufacturers and wind turbine developers can unlock synergies and accelerate innovation.
Leading Players in the Wind Power Gearbox Market Sector
- Dana Brevini SpA
- Siemens Gamesa Renewable Energy SA
- ME Production AS
- Stork Gears & Services BV
- Winergy Group
- Turbine Repair Solutions
- Elecon Engineering Company Limited
- ZF Friedrichshafen AG
Key Milestones in Wind Power Gearbox Market Industry
- September 2023: Sany Renewable Energy unveils its 919 wind turbine platform, featuring modular gearboxes for 8.5-11 MW turbines. This signifies a significant leap in turbine capacity and gearbox technology.
- June 2022: Eickhoff Wind Asia opens a state-of-the-art gearbox assembly facility in Chennai, expanding manufacturing capacity in Asia. This enhances regional supply capabilities and reduces lead times.
- March 2022: SKF introduces innovative rolling bearing technology, reducing drivetrain weight and enabling larger onshore turbines while respecting transportation limits. This technological advancement unlocks cost savings and efficiency improvements.
Strategic Outlook for Wind Power Gearbox Market Market
The Wind Power Gearbox Market is poised for continued expansion, driven by the global transition to renewable energy. Strategic partnerships, technological innovation, and the increasing demand for higher-capacity gearboxes will be key factors shaping future market dynamics. The focus on improving efficiency, durability, and reducing the environmental impact of wind turbines will remain paramount. The market offers significant opportunities for companies that can leverage technological advancements, optimize their supply chains, and develop innovative solutions for both onshore and offshore applications.
Wind Power Gearbox Market Segmentation
-
1. Location of Deployment
- 1.1. Onshore
- 1.2. Offshore
Wind Power Gearbox Market Segmentation By Geography
-
1. North America
- 1.1. United States
- 1.2. Canada
- 1.3. Rest of North America
-
2. Asia Pacific
- 2.1. China
- 2.2. India
- 2.3. Japan
- 2.4. Asutralia
- 2.5. Rest of Asia Pacific
-
3. Europe
- 3.1. United Kingdom
- 3.2. Germany
- 3.3. France
- 3.4. Spain
- 3.5. Rest of Europe
-
4. South America
- 4.1. Brazil
- 4.2. Argentina
- 4.3. Chile
- 4.4. Rest of South America
-
5. Middle East and Africa
- 5.1. Saudi Arabia
- 5.2. United Arab Emirates
- 5.3. South Africa
- 5.4. Rest of Middle East
Wind Power Gearbox Market REPORT HIGHLIGHTS
| Aspects | Details |
|---|---|
| Study Period | 2019-2033 |
| Base Year | 2024 |
| Estimated Year | 2025 |
| Forecast Period | 2025-2033 |
| Historical Period | 2019-2024 |
| Growth Rate | CAGR of 8.70% from 2019-2033 |
| Segmentation |
|
Table of Contents
- 1. Introduction
- 1.1. Research Scope
- 1.2. Market Segmentation
- 1.3. Research Methodology
- 1.4. Definitions and Assumptions
- 2. Executive Summary
- 2.1. Introduction
- 3. Market Dynamics
- 3.1. Introduction
- 3.2. Market Drivers
- 3.2.1. Increasing Adoption of Wind Energy4.; Growing Investments in Wind Energy
- 3.3. Market Restrains
- 3.3.1. Increasing Penetration of Other Sources of Renewable Energy
- 3.4. Market Trends
- 3.4.1. Offshore Segment to Register Higher Growth
- 4. Market Factor Analysis
- 4.1. Porters Five Forces
- 4.2. Supply/Value Chain
- 4.3. PESTEL analysis
- 4.4. Market Entropy
- 4.5. Patent/Trademark Analysis
- 5. Global Wind Power Gearbox Market Analysis, Insights and Forecast, 2019-2031
- 5.1. Market Analysis, Insights and Forecast - by Location of Deployment
- 5.1.1. Onshore
- 5.1.2. Offshore
- 5.2. Market Analysis, Insights and Forecast - by Region
- 5.2.1. North America
- 5.2.2. Asia Pacific
- 5.2.3. Europe
- 5.2.4. South America
- 5.2.5. Middle East and Africa
- 5.1. Market Analysis, Insights and Forecast - by Location of Deployment
- 6. North America Wind Power Gearbox Market Analysis, Insights and Forecast, 2019-2031
- 6.1. Market Analysis, Insights and Forecast - by Location of Deployment
- 6.1.1. Onshore
- 6.1.2. Offshore
- 6.1. Market Analysis, Insights and Forecast - by Location of Deployment
- 7. Asia Pacific Wind Power Gearbox Market Analysis, Insights and Forecast, 2019-2031
- 7.1. Market Analysis, Insights and Forecast - by Location of Deployment
- 7.1.1. Onshore
- 7.1.2. Offshore
- 7.1. Market Analysis, Insights and Forecast - by Location of Deployment
- 8. Europe Wind Power Gearbox Market Analysis, Insights and Forecast, 2019-2031
- 8.1. Market Analysis, Insights and Forecast - by Location of Deployment
- 8.1.1. Onshore
- 8.1.2. Offshore
- 8.1. Market Analysis, Insights and Forecast - by Location of Deployment
- 9. South America Wind Power Gearbox Market Analysis, Insights and Forecast, 2019-2031
- 9.1. Market Analysis, Insights and Forecast - by Location of Deployment
- 9.1.1. Onshore
- 9.1.2. Offshore
- 9.1. Market Analysis, Insights and Forecast - by Location of Deployment
- 10. Middle East and Africa Wind Power Gearbox Market Analysis, Insights and Forecast, 2019-2031
- 10.1. Market Analysis, Insights and Forecast - by Location of Deployment
- 10.1.1. Onshore
- 10.1.2. Offshore
- 10.1. Market Analysis, Insights and Forecast - by Location of Deployment
- 11. North America Wind Power Gearbox Market Analysis, Insights and Forecast, 2019-2031
- 11.1. Market Analysis, Insights and Forecast - By Country/Sub-region
- 11.1.1 United States
- 11.1.2 Canada
- 11.1.3 Mexico
- 12. Europe Wind Power Gearbox Market Analysis, Insights and Forecast, 2019-2031
- 12.1. Market Analysis, Insights and Forecast - By Country/Sub-region
- 12.1.1 Germany
- 12.1.2 United Kingdom
- 12.1.3 France
- 12.1.4 Spain
- 12.1.5 Italy
- 12.1.6 Spain
- 12.1.7 Belgium
- 12.1.8 Netherland
- 12.1.9 Nordics
- 12.1.10 Rest of Europe
- 13. Asia Pacific Wind Power Gearbox Market Analysis, Insights and Forecast, 2019-2031
- 13.1. Market Analysis, Insights and Forecast - By Country/Sub-region
- 13.1.1 China
- 13.1.2 Japan
- 13.1.3 India
- 13.1.4 South Korea
- 13.1.5 Southeast Asia
- 13.1.6 Australia
- 13.1.7 Indonesia
- 13.1.8 Phillipes
- 13.1.9 Singapore
- 13.1.10 Thailandc
- 13.1.11 Rest of Asia Pacific
- 14. South America Wind Power Gearbox Market Analysis, Insights and Forecast, 2019-2031
- 14.1. Market Analysis, Insights and Forecast - By Country/Sub-region
- 14.1.1 Brazil
- 14.1.2 Argentina
- 14.1.3 Peru
- 14.1.4 Chile
- 14.1.5 Colombia
- 14.1.6 Ecuador
- 14.1.7 Venezuela
- 14.1.8 Rest of South America
- 15. North America Wind Power Gearbox Market Analysis, Insights and Forecast, 2019-2031
- 15.1. Market Analysis, Insights and Forecast - By Country/Sub-region
- 15.1.1 United States
- 15.1.2 Canada
- 15.1.3 Mexico
- 16. MEA Wind Power Gearbox Market Analysis, Insights and Forecast, 2019-2031
- 16.1. Market Analysis, Insights and Forecast - By Country/Sub-region
- 16.1.1 United Arab Emirates
- 16.1.2 Saudi Arabia
- 16.1.3 South Africa
- 16.1.4 Rest of Middle East and Africa
- 17. Competitive Analysis
- 17.1. Global Market Share Analysis 2024
- 17.2. Company Profiles
- 17.2.1 Dana Brevini SpA
- 17.2.1.1. Overview
- 17.2.1.2. Products
- 17.2.1.3. SWOT Analysis
- 17.2.1.4. Recent Developments
- 17.2.1.5. Financials (Based on Availability)
- 17.2.2 Siemens Gamesa Renewable Energy SA
- 17.2.2.1. Overview
- 17.2.2.2. Products
- 17.2.2.3. SWOT Analysis
- 17.2.2.4. Recent Developments
- 17.2.2.5. Financials (Based on Availability)
- 17.2.3 ME Production AS
- 17.2.3.1. Overview
- 17.2.3.2. Products
- 17.2.3.3. SWOT Analysis
- 17.2.3.4. Recent Developments
- 17.2.3.5. Financials (Based on Availability)
- 17.2.4 Stork Gears & Services BV
- 17.2.4.1. Overview
- 17.2.4.2. Products
- 17.2.4.3. SWOT Analysis
- 17.2.4.4. Recent Developments
- 17.2.4.5. Financials (Based on Availability)
- 17.2.5 Winergy Group
- 17.2.5.1. Overview
- 17.2.5.2. Products
- 17.2.5.3. SWOT Analysis
- 17.2.5.4. Recent Developments
- 17.2.5.5. Financials (Based on Availability)
- 17.2.6 Turbine Repair Solutions
- 17.2.6.1. Overview
- 17.2.6.2. Products
- 17.2.6.3. SWOT Analysis
- 17.2.6.4. Recent Developments
- 17.2.6.5. Financials (Based on Availability)
- 17.2.7 Elecon Engineering Company Limited*List Not Exhaustive
- 17.2.7.1. Overview
- 17.2.7.2. Products
- 17.2.7.3. SWOT Analysis
- 17.2.7.4. Recent Developments
- 17.2.7.5. Financials (Based on Availability)
- 17.2.8 ZF Friedrichshafen AG
- 17.2.8.1. Overview
- 17.2.8.2. Products
- 17.2.8.3. SWOT Analysis
- 17.2.8.4. Recent Developments
- 17.2.8.5. Financials (Based on Availability)
- 17.2.1 Dana Brevini SpA
List of Figures
- Figure 1: Global Wind Power Gearbox Market Revenue Breakdown (Million, %) by Region 2024 & 2032
- Figure 2: Global Wind Power Gearbox Market Volume Breakdown (K Unit, %) by Region 2024 & 2032
- Figure 3: North America Wind Power Gearbox Market Revenue (Million), by Country 2024 & 2032
- Figure 4: North America Wind Power Gearbox Market Volume (K Unit), by Country 2024 & 2032
- Figure 5: North America Wind Power Gearbox Market Revenue Share (%), by Country 2024 & 2032
- Figure 6: North America Wind Power Gearbox Market Volume Share (%), by Country 2024 & 2032
- Figure 7: Europe Wind Power Gearbox Market Revenue (Million), by Country 2024 & 2032
- Figure 8: Europe Wind Power Gearbox Market Volume (K Unit), by Country 2024 & 2032
- Figure 9: Europe Wind Power Gearbox Market Revenue Share (%), by Country 2024 & 2032
- Figure 10: Europe Wind Power Gearbox Market Volume Share (%), by Country 2024 & 2032
- Figure 11: Asia Pacific Wind Power Gearbox Market Revenue (Million), by Country 2024 & 2032
- Figure 12: Asia Pacific Wind Power Gearbox Market Volume (K Unit), by Country 2024 & 2032
- Figure 13: Asia Pacific Wind Power Gearbox Market Revenue Share (%), by Country 2024 & 2032
- Figure 14: Asia Pacific Wind Power Gearbox Market Volume Share (%), by Country 2024 & 2032
- Figure 15: South America Wind Power Gearbox Market Revenue (Million), by Country 2024 & 2032
- Figure 16: South America Wind Power Gearbox Market Volume (K Unit), by Country 2024 & 2032
- Figure 17: South America Wind Power Gearbox Market Revenue Share (%), by Country 2024 & 2032
- Figure 18: South America Wind Power Gearbox Market Volume Share (%), by Country 2024 & 2032
- Figure 19: North America Wind Power Gearbox Market Revenue (Million), by Country 2024 & 2032
- Figure 20: North America Wind Power Gearbox Market Volume (K Unit), by Country 2024 & 2032
- Figure 21: North America Wind Power Gearbox Market Revenue Share (%), by Country 2024 & 2032
- Figure 22: North America Wind Power Gearbox Market Volume Share (%), by Country 2024 & 2032
- Figure 23: MEA Wind Power Gearbox Market Revenue (Million), by Country 2024 & 2032
- Figure 24: MEA Wind Power Gearbox Market Volume (K Unit), by Country 2024 & 2032
- Figure 25: MEA Wind Power Gearbox Market Revenue Share (%), by Country 2024 & 2032
- Figure 26: MEA Wind Power Gearbox Market Volume Share (%), by Country 2024 & 2032
- Figure 27: North America Wind Power Gearbox Market Revenue (Million), by Location of Deployment 2024 & 2032
- Figure 28: North America Wind Power Gearbox Market Volume (K Unit), by Location of Deployment 2024 & 2032
- Figure 29: North America Wind Power Gearbox Market Revenue Share (%), by Location of Deployment 2024 & 2032
- Figure 30: North America Wind Power Gearbox Market Volume Share (%), by Location of Deployment 2024 & 2032
- Figure 31: North America Wind Power Gearbox Market Revenue (Million), by Country 2024 & 2032
- Figure 32: North America Wind Power Gearbox Market Volume (K Unit), by Country 2024 & 2032
- Figure 33: North America Wind Power Gearbox Market Revenue Share (%), by Country 2024 & 2032
- Figure 34: North America Wind Power Gearbox Market Volume Share (%), by Country 2024 & 2032
- Figure 35: Asia Pacific Wind Power Gearbox Market Revenue (Million), by Location of Deployment 2024 & 2032
- Figure 36: Asia Pacific Wind Power Gearbox Market Volume (K Unit), by Location of Deployment 2024 & 2032
- Figure 37: Asia Pacific Wind Power Gearbox Market Revenue Share (%), by Location of Deployment 2024 & 2032
- Figure 38: Asia Pacific Wind Power Gearbox Market Volume Share (%), by Location of Deployment 2024 & 2032
- Figure 39: Asia Pacific Wind Power Gearbox Market Revenue (Million), by Country 2024 & 2032
- Figure 40: Asia Pacific Wind Power Gearbox Market Volume (K Unit), by Country 2024 & 2032
- Figure 41: Asia Pacific Wind Power Gearbox Market Revenue Share (%), by Country 2024 & 2032
- Figure 42: Asia Pacific Wind Power Gearbox Market Volume Share (%), by Country 2024 & 2032
- Figure 43: Europe Wind Power Gearbox Market Revenue (Million), by Location of Deployment 2024 & 2032
- Figure 44: Europe Wind Power Gearbox Market Volume (K Unit), by Location of Deployment 2024 & 2032
- Figure 45: Europe Wind Power Gearbox Market Revenue Share (%), by Location of Deployment 2024 & 2032
- Figure 46: Europe Wind Power Gearbox Market Volume Share (%), by Location of Deployment 2024 & 2032
- Figure 47: Europe Wind Power Gearbox Market Revenue (Million), by Country 2024 & 2032
- Figure 48: Europe Wind Power Gearbox Market Volume (K Unit), by Country 2024 & 2032
- Figure 49: Europe Wind Power Gearbox Market Revenue Share (%), by Country 2024 & 2032
- Figure 50: Europe Wind Power Gearbox Market Volume Share (%), by Country 2024 & 2032
- Figure 51: South America Wind Power Gearbox Market Revenue (Million), by Location of Deployment 2024 & 2032
- Figure 52: South America Wind Power Gearbox Market Volume (K Unit), by Location of Deployment 2024 & 2032
- Figure 53: South America Wind Power Gearbox Market Revenue Share (%), by Location of Deployment 2024 & 2032
- Figure 54: South America Wind Power Gearbox Market Volume Share (%), by Location of Deployment 2024 & 2032
- Figure 55: South America Wind Power Gearbox Market Revenue (Million), by Country 2024 & 2032
- Figure 56: South America Wind Power Gearbox Market Volume (K Unit), by Country 2024 & 2032
- Figure 57: South America Wind Power Gearbox Market Revenue Share (%), by Country 2024 & 2032
- Figure 58: South America Wind Power Gearbox Market Volume Share (%), by Country 2024 & 2032
- Figure 59: Middle East and Africa Wind Power Gearbox Market Revenue (Million), by Location of Deployment 2024 & 2032
- Figure 60: Middle East and Africa Wind Power Gearbox Market Volume (K Unit), by Location of Deployment 2024 & 2032
- Figure 61: Middle East and Africa Wind Power Gearbox Market Revenue Share (%), by Location of Deployment 2024 & 2032
- Figure 62: Middle East and Africa Wind Power Gearbox Market Volume Share (%), by Location of Deployment 2024 & 2032
- Figure 63: Middle East and Africa Wind Power Gearbox Market Revenue (Million), by Country 2024 & 2032
- Figure 64: Middle East and Africa Wind Power Gearbox Market Volume (K Unit), by Country 2024 & 2032
- Figure 65: Middle East and Africa Wind Power Gearbox Market Revenue Share (%), by Country 2024 & 2032
- Figure 66: Middle East and Africa Wind Power Gearbox Market Volume Share (%), by Country 2024 & 2032
List of Tables
- Table 1: Global Wind Power Gearbox Market Revenue Million Forecast, by Region 2019 & 2032
- Table 2: Global Wind Power Gearbox Market Volume K Unit Forecast, by Region 2019 & 2032
- Table 3: Global Wind Power Gearbox Market Revenue Million Forecast, by Location of Deployment 2019 & 2032
- Table 4: Global Wind Power Gearbox Market Volume K Unit Forecast, by Location of Deployment 2019 & 2032
- Table 5: Global Wind Power Gearbox Market Revenue Million Forecast, by Region 2019 & 2032
- Table 6: Global Wind Power Gearbox Market Volume K Unit Forecast, by Region 2019 & 2032
- Table 7: Global Wind Power Gearbox Market Revenue Million Forecast, by Country 2019 & 2032
- Table 8: Global Wind Power Gearbox Market Volume K Unit Forecast, by Country 2019 & 2032
- Table 9: United States Wind Power Gearbox Market Revenue (Million) Forecast, by Application 2019 & 2032
- Table 10: United States Wind Power Gearbox Market Volume (K Unit) Forecast, by Application 2019 & 2032
- Table 11: Canada Wind Power Gearbox Market Revenue (Million) Forecast, by Application 2019 & 2032
- Table 12: Canada Wind Power Gearbox Market Volume (K Unit) Forecast, by Application 2019 & 2032
- Table 13: Mexico Wind Power Gearbox Market Revenue (Million) Forecast, by Application 2019 & 2032
- Table 14: Mexico Wind Power Gearbox Market Volume (K Unit) Forecast, by Application 2019 & 2032
- Table 15: Global Wind Power Gearbox Market Revenue Million Forecast, by Country 2019 & 2032
- Table 16: Global Wind Power Gearbox Market Volume K Unit Forecast, by Country 2019 & 2032
- Table 17: Germany Wind Power Gearbox Market Revenue (Million) Forecast, by Application 2019 & 2032
- Table 18: Germany Wind Power Gearbox Market Volume (K Unit) Forecast, by Application 2019 & 2032
- Table 19: United Kingdom Wind Power Gearbox Market Revenue (Million) Forecast, by Application 2019 & 2032
- Table 20: United Kingdom Wind Power Gearbox Market Volume (K Unit) Forecast, by Application 2019 & 2032
- Table 21: France Wind Power Gearbox Market Revenue (Million) Forecast, by Application 2019 & 2032
- Table 22: France Wind Power Gearbox Market Volume (K Unit) Forecast, by Application 2019 & 2032
- Table 23: Spain Wind Power Gearbox Market Revenue (Million) Forecast, by Application 2019 & 2032
- Table 24: Spain Wind Power Gearbox Market Volume (K Unit) Forecast, by Application 2019 & 2032
- Table 25: Italy Wind Power Gearbox Market Revenue (Million) Forecast, by Application 2019 & 2032
- Table 26: Italy Wind Power Gearbox Market Volume (K Unit) Forecast, by Application 2019 & 2032
- Table 27: Spain Wind Power Gearbox Market Revenue (Million) Forecast, by Application 2019 & 2032
- Table 28: Spain Wind Power Gearbox Market Volume (K Unit) Forecast, by Application 2019 & 2032
- Table 29: Belgium Wind Power Gearbox Market Revenue (Million) Forecast, by Application 2019 & 2032
- Table 30: Belgium Wind Power Gearbox Market Volume (K Unit) Forecast, by Application 2019 & 2032
- Table 31: Netherland Wind Power Gearbox Market Revenue (Million) Forecast, by Application 2019 & 2032
- Table 32: Netherland Wind Power Gearbox Market Volume (K Unit) Forecast, by Application 2019 & 2032
- Table 33: Nordics Wind Power Gearbox Market Revenue (Million) Forecast, by Application 2019 & 2032
- Table 34: Nordics Wind Power Gearbox Market Volume (K Unit) Forecast, by Application 2019 & 2032
- Table 35: Rest of Europe Wind Power Gearbox Market Revenue (Million) Forecast, by Application 2019 & 2032
- Table 36: Rest of Europe Wind Power Gearbox Market Volume (K Unit) Forecast, by Application 2019 & 2032
- Table 37: Global Wind Power Gearbox Market Revenue Million Forecast, by Country 2019 & 2032
- Table 38: Global Wind Power Gearbox Market Volume K Unit Forecast, by Country 2019 & 2032
- Table 39: China Wind Power Gearbox Market Revenue (Million) Forecast, by Application 2019 & 2032
- Table 40: China Wind Power Gearbox Market Volume (K Unit) Forecast, by Application 2019 & 2032
- Table 41: Japan Wind Power Gearbox Market Revenue (Million) Forecast, by Application 2019 & 2032
- Table 42: Japan Wind Power Gearbox Market Volume (K Unit) Forecast, by Application 2019 & 2032
- Table 43: India Wind Power Gearbox Market Revenue (Million) Forecast, by Application 2019 & 2032
- Table 44: India Wind Power Gearbox Market Volume (K Unit) Forecast, by Application 2019 & 2032
- Table 45: South Korea Wind Power Gearbox Market Revenue (Million) Forecast, by Application 2019 & 2032
- Table 46: South Korea Wind Power Gearbox Market Volume (K Unit) Forecast, by Application 2019 & 2032
- Table 47: Southeast Asia Wind Power Gearbox Market Revenue (Million) Forecast, by Application 2019 & 2032
- Table 48: Southeast Asia Wind Power Gearbox Market Volume (K Unit) Forecast, by Application 2019 & 2032
- Table 49: Australia Wind Power Gearbox Market Revenue (Million) Forecast, by Application 2019 & 2032
- Table 50: Australia Wind Power Gearbox Market Volume (K Unit) Forecast, by Application 2019 & 2032
- Table 51: Indonesia Wind Power Gearbox Market Revenue (Million) Forecast, by Application 2019 & 2032
- Table 52: Indonesia Wind Power Gearbox Market Volume (K Unit) Forecast, by Application 2019 & 2032
- Table 53: Phillipes Wind Power Gearbox Market Revenue (Million) Forecast, by Application 2019 & 2032
- Table 54: Phillipes Wind Power Gearbox Market Volume (K Unit) Forecast, by Application 2019 & 2032
- Table 55: Singapore Wind Power Gearbox Market Revenue (Million) Forecast, by Application 2019 & 2032
- Table 56: Singapore Wind Power Gearbox Market Volume (K Unit) Forecast, by Application 2019 & 2032
- Table 57: Thailandc Wind Power Gearbox Market Revenue (Million) Forecast, by Application 2019 & 2032
- Table 58: Thailandc Wind Power Gearbox Market Volume (K Unit) Forecast, by Application 2019 & 2032
- Table 59: Rest of Asia Pacific Wind Power Gearbox Market Revenue (Million) Forecast, by Application 2019 & 2032
- Table 60: Rest of Asia Pacific Wind Power Gearbox Market Volume (K Unit) Forecast, by Application 2019 & 2032
- Table 61: Global Wind Power Gearbox Market Revenue Million Forecast, by Country 2019 & 2032
- Table 62: Global Wind Power Gearbox Market Volume K Unit Forecast, by Country 2019 & 2032
- Table 63: Brazil Wind Power Gearbox Market Revenue (Million) Forecast, by Application 2019 & 2032
- Table 64: Brazil Wind Power Gearbox Market Volume (K Unit) Forecast, by Application 2019 & 2032
- Table 65: Argentina Wind Power Gearbox Market Revenue (Million) Forecast, by Application 2019 & 2032
- Table 66: Argentina Wind Power Gearbox Market Volume (K Unit) Forecast, by Application 2019 & 2032
- Table 67: Peru Wind Power Gearbox Market Revenue (Million) Forecast, by Application 2019 & 2032
- Table 68: Peru Wind Power Gearbox Market Volume (K Unit) Forecast, by Application 2019 & 2032
- Table 69: Chile Wind Power Gearbox Market Revenue (Million) Forecast, by Application 2019 & 2032
- Table 70: Chile Wind Power Gearbox Market Volume (K Unit) Forecast, by Application 2019 & 2032
- Table 71: Colombia Wind Power Gearbox Market Revenue (Million) Forecast, by Application 2019 & 2032
- Table 72: Colombia Wind Power Gearbox Market Volume (K Unit) Forecast, by Application 2019 & 2032
- Table 73: Ecuador Wind Power Gearbox Market Revenue (Million) Forecast, by Application 2019 & 2032
- Table 74: Ecuador Wind Power Gearbox Market Volume (K Unit) Forecast, by Application 2019 & 2032
- Table 75: Venezuela Wind Power Gearbox Market Revenue (Million) Forecast, by Application 2019 & 2032
- Table 76: Venezuela Wind Power Gearbox Market Volume (K Unit) Forecast, by Application 2019 & 2032
- Table 77: Rest of South America Wind Power Gearbox Market Revenue (Million) Forecast, by Application 2019 & 2032
- Table 78: Rest of South America Wind Power Gearbox Market Volume (K Unit) Forecast, by Application 2019 & 2032
- Table 79: Global Wind Power Gearbox Market Revenue Million Forecast, by Country 2019 & 2032
- Table 80: Global Wind Power Gearbox Market Volume K Unit Forecast, by Country 2019 & 2032
- Table 81: United States Wind Power Gearbox Market Revenue (Million) Forecast, by Application 2019 & 2032
- Table 82: United States Wind Power Gearbox Market Volume (K Unit) Forecast, by Application 2019 & 2032
- Table 83: Canada Wind Power Gearbox Market Revenue (Million) Forecast, by Application 2019 & 2032
- Table 84: Canada Wind Power Gearbox Market Volume (K Unit) Forecast, by Application 2019 & 2032
- Table 85: Mexico Wind Power Gearbox Market Revenue (Million) Forecast, by Application 2019 & 2032
- Table 86: Mexico Wind Power Gearbox Market Volume (K Unit) Forecast, by Application 2019 & 2032
- Table 87: Global Wind Power Gearbox Market Revenue Million Forecast, by Country 2019 & 2032
- Table 88: Global Wind Power Gearbox Market Volume K Unit Forecast, by Country 2019 & 2032
- Table 89: United Arab Emirates Wind Power Gearbox Market Revenue (Million) Forecast, by Application 2019 & 2032
- Table 90: United Arab Emirates Wind Power Gearbox Market Volume (K Unit) Forecast, by Application 2019 & 2032
- Table 91: Saudi Arabia Wind Power Gearbox Market Revenue (Million) Forecast, by Application 2019 & 2032
- Table 92: Saudi Arabia Wind Power Gearbox Market Volume (K Unit) Forecast, by Application 2019 & 2032
- Table 93: South Africa Wind Power Gearbox Market Revenue (Million) Forecast, by Application 2019 & 2032
- Table 94: South Africa Wind Power Gearbox Market Volume (K Unit) Forecast, by Application 2019 & 2032
- Table 95: Rest of Middle East and Africa Wind Power Gearbox Market Revenue (Million) Forecast, by Application 2019 & 2032
- Table 96: Rest of Middle East and Africa Wind Power Gearbox Market Volume (K Unit) Forecast, by Application 2019 & 2032
- Table 97: Global Wind Power Gearbox Market Revenue Million Forecast, by Location of Deployment 2019 & 2032
- Table 98: Global Wind Power Gearbox Market Volume K Unit Forecast, by Location of Deployment 2019 & 2032
- Table 99: Global Wind Power Gearbox Market Revenue Million Forecast, by Country 2019 & 2032
- Table 100: Global Wind Power Gearbox Market Volume K Unit Forecast, by Country 2019 & 2032
- Table 101: United States Wind Power Gearbox Market Revenue (Million) Forecast, by Application 2019 & 2032
- Table 102: United States Wind Power Gearbox Market Volume (K Unit) Forecast, by Application 2019 & 2032
- Table 103: Canada Wind Power Gearbox Market Revenue (Million) Forecast, by Application 2019 & 2032
- Table 104: Canada Wind Power Gearbox Market Volume (K Unit) Forecast, by Application 2019 & 2032
- Table 105: Rest of North America Wind Power Gearbox Market Revenue (Million) Forecast, by Application 2019 & 2032
- Table 106: Rest of North America Wind Power Gearbox Market Volume (K Unit) Forecast, by Application 2019 & 2032
- Table 107: Global Wind Power Gearbox Market Revenue Million Forecast, by Location of Deployment 2019 & 2032
- Table 108: Global Wind Power Gearbox Market Volume K Unit Forecast, by Location of Deployment 2019 & 2032
- Table 109: Global Wind Power Gearbox Market Revenue Million Forecast, by Country 2019 & 2032
- Table 110: Global Wind Power Gearbox Market Volume K Unit Forecast, by Country 2019 & 2032
- Table 111: China Wind Power Gearbox Market Revenue (Million) Forecast, by Application 2019 & 2032
- Table 112: China Wind Power Gearbox Market Volume (K Unit) Forecast, by Application 2019 & 2032
- Table 113: India Wind Power Gearbox Market Revenue (Million) Forecast, by Application 2019 & 2032
- Table 114: India Wind Power Gearbox Market Volume (K Unit) Forecast, by Application 2019 & 2032
- Table 115: Japan Wind Power Gearbox Market Revenue (Million) Forecast, by Application 2019 & 2032
- Table 116: Japan Wind Power Gearbox Market Volume (K Unit) Forecast, by Application 2019 & 2032
- Table 117: Asutralia Wind Power Gearbox Market Revenue (Million) Forecast, by Application 2019 & 2032
- Table 118: Asutralia Wind Power Gearbox Market Volume (K Unit) Forecast, by Application 2019 & 2032
- Table 119: Rest of Asia Pacific Wind Power Gearbox Market Revenue (Million) Forecast, by Application 2019 & 2032
- Table 120: Rest of Asia Pacific Wind Power Gearbox Market Volume (K Unit) Forecast, by Application 2019 & 2032
- Table 121: Global Wind Power Gearbox Market Revenue Million Forecast, by Location of Deployment 2019 & 2032
- Table 122: Global Wind Power Gearbox Market Volume K Unit Forecast, by Location of Deployment 2019 & 2032
- Table 123: Global Wind Power Gearbox Market Revenue Million Forecast, by Country 2019 & 2032
- Table 124: Global Wind Power Gearbox Market Volume K Unit Forecast, by Country 2019 & 2032
- Table 125: United Kingdom Wind Power Gearbox Market Revenue (Million) Forecast, by Application 2019 & 2032
- Table 126: United Kingdom Wind Power Gearbox Market Volume (K Unit) Forecast, by Application 2019 & 2032
- Table 127: Germany Wind Power Gearbox Market Revenue (Million) Forecast, by Application 2019 & 2032
- Table 128: Germany Wind Power Gearbox Market Volume (K Unit) Forecast, by Application 2019 & 2032
- Table 129: France Wind Power Gearbox Market Revenue (Million) Forecast, by Application 2019 & 2032
- Table 130: France Wind Power Gearbox Market Volume (K Unit) Forecast, by Application 2019 & 2032
- Table 131: Spain Wind Power Gearbox Market Revenue (Million) Forecast, by Application 2019 & 2032
- Table 132: Spain Wind Power Gearbox Market Volume (K Unit) Forecast, by Application 2019 & 2032
- Table 133: Rest of Europe Wind Power Gearbox Market Revenue (Million) Forecast, by Application 2019 & 2032
- Table 134: Rest of Europe Wind Power Gearbox Market Volume (K Unit) Forecast, by Application 2019 & 2032
- Table 135: Global Wind Power Gearbox Market Revenue Million Forecast, by Location of Deployment 2019 & 2032
- Table 136: Global Wind Power Gearbox Market Volume K Unit Forecast, by Location of Deployment 2019 & 2032
- Table 137: Global Wind Power Gearbox Market Revenue Million Forecast, by Country 2019 & 2032
- Table 138: Global Wind Power Gearbox Market Volume K Unit Forecast, by Country 2019 & 2032
- Table 139: Brazil Wind Power Gearbox Market Revenue (Million) Forecast, by Application 2019 & 2032
- Table 140: Brazil Wind Power Gearbox Market Volume (K Unit) Forecast, by Application 2019 & 2032
- Table 141: Argentina Wind Power Gearbox Market Revenue (Million) Forecast, by Application 2019 & 2032
- Table 142: Argentina Wind Power Gearbox Market Volume (K Unit) Forecast, by Application 2019 & 2032
- Table 143: Chile Wind Power Gearbox Market Revenue (Million) Forecast, by Application 2019 & 2032
- Table 144: Chile Wind Power Gearbox Market Volume (K Unit) Forecast, by Application 2019 & 2032
- Table 145: Rest of South America Wind Power Gearbox Market Revenue (Million) Forecast, by Application 2019 & 2032
- Table 146: Rest of South America Wind Power Gearbox Market Volume (K Unit) Forecast, by Application 2019 & 2032
- Table 147: Global Wind Power Gearbox Market Revenue Million Forecast, by Location of Deployment 2019 & 2032
- Table 148: Global Wind Power Gearbox Market Volume K Unit Forecast, by Location of Deployment 2019 & 2032
- Table 149: Global Wind Power Gearbox Market Revenue Million Forecast, by Country 2019 & 2032
- Table 150: Global Wind Power Gearbox Market Volume K Unit Forecast, by Country 2019 & 2032
- Table 151: Saudi Arabia Wind Power Gearbox Market Revenue (Million) Forecast, by Application 2019 & 2032
- Table 152: Saudi Arabia Wind Power Gearbox Market Volume (K Unit) Forecast, by Application 2019 & 2032
- Table 153: United Arab Emirates Wind Power Gearbox Market Revenue (Million) Forecast, by Application 2019 & 2032
- Table 154: United Arab Emirates Wind Power Gearbox Market Volume (K Unit) Forecast, by Application 2019 & 2032
- Table 155: South Africa Wind Power Gearbox Market Revenue (Million) Forecast, by Application 2019 & 2032
- Table 156: South Africa Wind Power Gearbox Market Volume (K Unit) Forecast, by Application 2019 & 2032
- Table 157: Rest of Middle East Wind Power Gearbox Market Revenue (Million) Forecast, by Application 2019 & 2032
- Table 158: Rest of Middle East Wind Power Gearbox Market Volume (K Unit) Forecast, by Application 2019 & 2032
Frequently Asked Questions
1. What is the projected Compound Annual Growth Rate (CAGR) of the Wind Power Gearbox Market?
The projected CAGR is approximately 8.70%.
2. Which companies are prominent players in the Wind Power Gearbox Market?
Key companies in the market include Dana Brevini SpA, Siemens Gamesa Renewable Energy SA, ME Production AS, Stork Gears & Services BV, Winergy Group, Turbine Repair Solutions, Elecon Engineering Company Limited*List Not Exhaustive, ZF Friedrichshafen AG.
3. What are the main segments of the Wind Power Gearbox Market?
The market segments include Location of Deployment.
4. Can you provide details about the market size?
The market size is estimated to be USD 19.92 Million as of 2022.
5. What are some drivers contributing to market growth?
Increasing Adoption of Wind Energy4.; Growing Investments in Wind Energy.
6. What are the notable trends driving market growth?
Offshore Segment to Register Higher Growth.
7. Are there any restraints impacting market growth?
Increasing Penetration of Other Sources of Renewable Energy.
8. Can you provide examples of recent developments in the market?
In September 2023, Sany Renewable Energy (Sany RE) revealed its latest 919 wind turbine platform. The 919 Platform adopts an integrated design, and developments on the 919 Platform share structural components such as the hub, main shaft, front bedplate, blades, gearboxes, and electrical systems are developed as modular systems to cover capacity from 8.5 MW to 11 MW wind turbines with rotor diameters ranging from 214 meters to 230 meters.
9. What pricing options are available for accessing the report?
Pricing options include single-user, multi-user, and enterprise licenses priced at USD 4750, USD 5250, and USD 8750 respectively.
10. Is the market size provided in terms of value or volume?
The market size is provided in terms of value, measured in Million and volume, measured in K Unit.
11. Are there any specific market keywords associated with the report?
Yes, the market keyword associated with the report is "Wind Power Gearbox Market," which aids in identifying and referencing the specific market segment covered.
12. How do I determine which pricing option suits my needs best?
The pricing options vary based on user requirements and access needs. Individual users may opt for single-user licenses, while businesses requiring broader access may choose multi-user or enterprise licenses for cost-effective access to the report.
13. Are there any additional resources or data provided in the Wind Power Gearbox Market report?
While the report offers comprehensive insights, it's advisable to review the specific contents or supplementary materials provided to ascertain if additional resources or data are available.
14. How can I stay updated on further developments or reports in the Wind Power Gearbox Market?
To stay informed about further developments, trends, and reports in the Wind Power Gearbox Market, consider subscribing to industry newsletters, following relevant companies and organizations, or regularly checking reputable industry news sources and publications.
Methodology
Step 1 - Identification of Relevant Samples Size from Population Database


Step 2 - Approaches for Defining Global Market Size (Value, Volume* & Price*)

Note*: In applicable scenarios
Step 3 - Data Sources
Primary Research
- Web Analytics
- Survey Reports
- Research Institute
- Latest Research Reports
- Opinion Leaders
Secondary Research
- Annual Reports
- White Paper
- Latest Press Release
- Industry Association
- Paid Database
- Investor Presentations

Step 4 - Data Triangulation
Involves using different sources of information in order to increase the validity of a study
These sources are likely to be stakeholders in a program - participants, other researchers, program staff, other community members, and so on.
Then we put all data in single framework & apply various statistical tools to find out the dynamic on the market.
During the analysis stage, feedback from the stakeholder groups would be compared to determine areas of agreement as well as areas of divergence
