

Key Insights
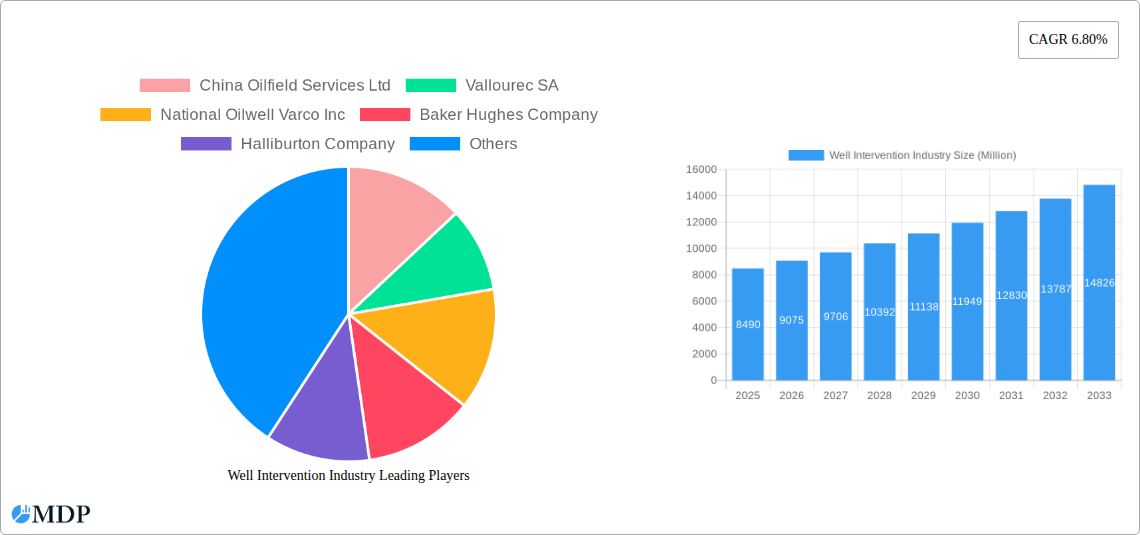
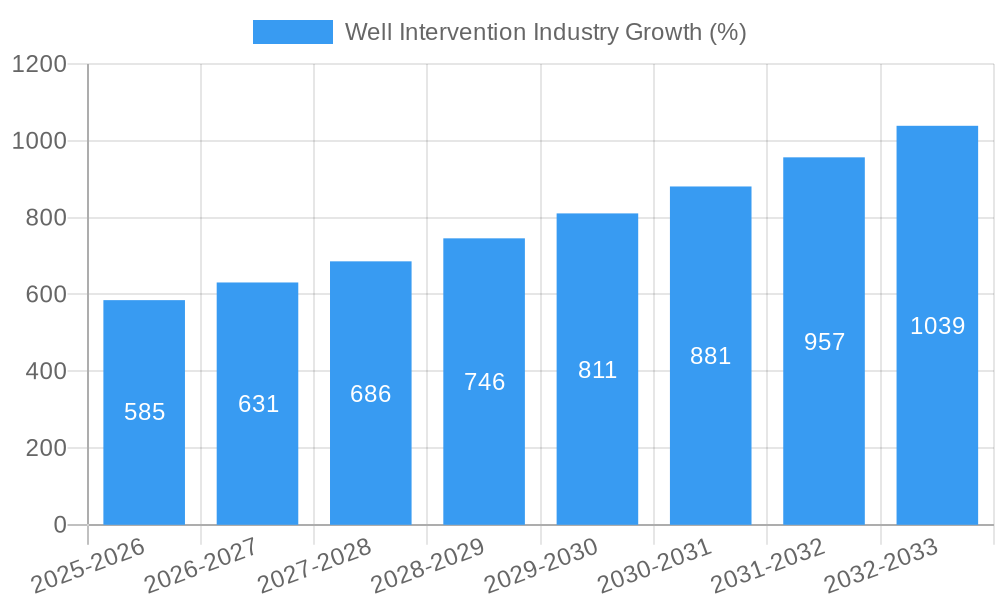
The global well intervention market, valued at $8.49 billion in 2025, is projected to experience robust growth, driven by increasing oil and gas exploration and production activities worldwide. The market's Compound Annual Growth Rate (CAGR) of 6.80% from 2025 to 2033 indicates a significant expansion in the coming years. This growth is fueled by several key factors, including the rising demand for enhanced oil recovery techniques to maximize production from mature fields, the increasing adoption of advanced well intervention technologies for improved efficiency and safety, and the growing exploration and production activities in unconventional resources like shale gas and tight oil. The onshore segment currently holds a larger market share than offshore, primarily due to the higher concentration of mature oil and gas fields on land and relatively lower operational costs. However, the offshore segment is expected to witness faster growth, driven by technological advancements enabling safer and more cost-effective interventions in deepwater environments. Major players like Schlumberger, Halliburton, and Baker Hughes are investing heavily in research and development to improve their technological offerings and maintain their competitive edge. Geopolitical factors and fluctuating oil and gas prices pose potential restraints to market growth, but the long-term outlook remains positive, driven by the continued need for efficient and sustainable energy production.
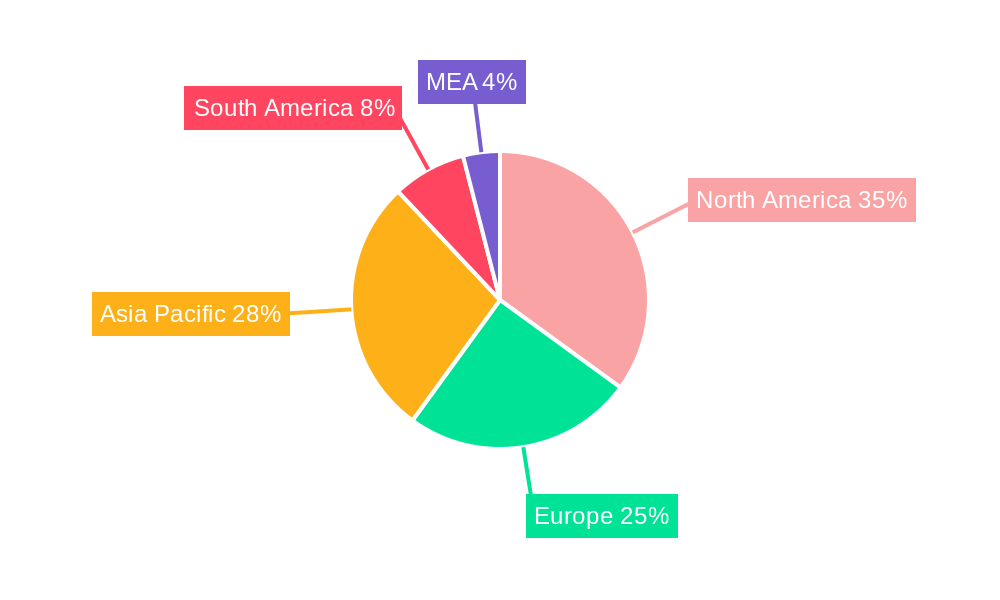
The regional landscape showcases significant variations. North America, particularly the United States, currently holds a substantial market share, due to its large reserves and established infrastructure. However, Asia-Pacific, particularly China and India, is anticipated to exhibit considerable growth, fueled by increasing energy demands and investments in domestic oil and gas production. Europe is another important market, although growth might be comparatively slower due to stringent environmental regulations and a focus on renewable energy sources. South America and the Middle East and Africa regions also present significant growth opportunities, driven by ongoing exploration efforts and expanding oil and gas production capabilities. The competitive landscape is characterized by a mix of large multinational corporations and specialized service providers. Competition is primarily based on technological innovation, operational efficiency, and pricing strategies.
Well Intervention Industry Market Report: 2019-2033 Forecast
This comprehensive report provides a detailed analysis of the Well Intervention industry, offering actionable insights for stakeholders across the value chain. The report covers the period from 2019 to 2033, with a focus on the 2025-2033 forecast period. The market is projected to reach xx Million by 2033, driven by technological advancements, increasing offshore activities, and growing demand for enhanced oil recovery techniques.
Well Intervention Industry Market Dynamics & Concentration
The Well Intervention market exhibits a moderately concentrated landscape, with a few major players holding significant market share. Market concentration is influenced by factors such as technological capabilities, operational efficiency, and geographical reach. Major players like Schlumberger Limited, Halliburton Company, and Baker Hughes Company, collectively hold an estimated xx% market share in 2025. The market is characterized by both organic growth (through technological innovation and service expansion) and inorganic growth (through mergers and acquisitions).
- Innovation Drivers: Advancements in robotics, automation, and data analytics are driving efficiency and reducing operational costs.
- Regulatory Frameworks: Stringent environmental regulations and safety standards influence operational practices and technological adoption.
- Product Substitutes: Limited direct substitutes exist; however, advancements in drilling technologies may impact demand.
- End-User Trends: The increasing focus on enhanced oil recovery (EOR) and well integrity management is boosting demand for well intervention services.
- M&A Activities: The number of M&A deals in the sector has fluctuated over the past few years, with xx deals recorded between 2019 and 2024. The total deal value is estimated at xx Million. This activity is driven by players seeking to expand their service offerings and geographic reach.
Well Intervention Industry Industry Trends & Analysis
The Well Intervention market is experiencing robust growth, driven by several factors. The Compound Annual Growth Rate (CAGR) for the forecast period (2025-2033) is estimated at xx%. Market penetration of advanced technologies, such as coiled tubing and slickline interventions, continues to rise. Increased investments in offshore exploration and production, coupled with the aging well infrastructure in mature oil and gas fields, are major contributors to market expansion. Consumer preferences are shifting towards more sustainable and efficient intervention solutions. The competitive dynamics are intense, with leading players continuously investing in R&D to maintain their competitive edge. This competitive landscape fosters innovation, driving technological advancements and ultimately benefiting the end-user with more efficient and cost-effective well intervention solutions.
Leading Markets & Segments in Well Intervention Industry
The offshore segment holds a significant market share, driven by the complexity and higher cost of offshore well interventions. The Middle East and North America are the leading regional markets, largely due to extensive oil and gas exploration and production activities.
Onshore:
- Key Drivers: Relatively lower operational costs, established infrastructure in some regions.
- Market Analysis: While onshore holds a significant portion of the overall market, offshore's complexity and higher intervention needs result in stronger market growth.
Offshore:
- Key Drivers: High concentration of deepwater oil and gas reserves, increasing exploration in frontier areas. Technological advancements making deepwater interventions increasingly feasible.
- Market Analysis: Despite the higher costs associated with offshore operations, this sector commands a larger market share due to the substantial investments in offshore fields and the complexity of interventions required in these challenging environments.
Well Intervention Industry Product Developments
Technological advancements have significantly enhanced well intervention technologies. Recent innovations focus on increased efficiency, automation, and enhanced data analytics for better decision-making. This includes the development of advanced robotic systems for minimally invasive interventions and sophisticated software for real-time monitoring and data interpretation, improving the safety and efficiency of operations. New materials and techniques are also enhancing the longevity and performance of well intervention tools. This constant product development is a key factor driving market growth.
Key Drivers of Well Intervention Industry Growth
Several factors contribute to the growth of the Well Intervention industry:
- Technological Advancements: Automation, robotics, and data analytics enhance efficiency and reduce costs.
- Economic Factors: Rising oil and gas prices stimulate exploration and production, leading to increased demand for well intervention services.
- Regulatory Factors: Stricter regulations on emissions and safety protocols create demand for advanced intervention solutions to meet compliance needs. The increasing emphasis on extending the life of existing wells also plays a significant role.
Challenges in the Well Intervention Industry Market
The Well Intervention industry faces several challenges:
- Regulatory Hurdles: Obtaining permits and complying with stringent environmental regulations adds to operational complexity and costs.
- Supply Chain Issues: Dependence on specialized equipment and skilled personnel can create supply chain vulnerabilities and impact operational efficiency.
- Competitive Pressures: Intense competition among major players puts pressure on pricing and margins. This necessitates constant innovation and efficiency improvements.
Emerging Opportunities in Well Intervention Industry
The industry presents several emerging opportunities:
- Technological Breakthroughs: The development of advanced robotics, AI, and data analytics can significantly enhance operational efficiency, safety, and cost-effectiveness.
- Strategic Partnerships: Collaboration between well intervention companies and technology providers can facilitate the development and deployment of innovative solutions.
- Market Expansion: Growth in emerging markets, particularly in developing economies, presents significant opportunities for expansion.
Leading Players in the Well Intervention Industry Sector
- China Oilfield Services Ltd
- Vallourec SA
- National Oilwell Varco Inc
- Baker Hughes Company
- Halliburton Company
- Weatherford International Ltd
- Schlumberger Limited
- Scientific Drilling International Inc
Key Milestones in Well Intervention Industry Industry
- May 2023: TechnipFMC secured a contract from Equinor for RLWI services on the Norwegian Continental Shelf, highlighting the growing demand for efficient production enhancement techniques.
- March 2023: Petroleum Safety Authority Norway (PSA) approved Norske Shell's use of the Island Constructor vessel for well intervention, showcasing ongoing activity in the North Sea.
Strategic Outlook for Well Intervention Industry Market
The Well Intervention market is poised for continued growth, driven by technological innovation, increasing demand for EOR techniques, and the expanding offshore sector. Strategic partnerships, focusing on technological advancements and expansion into emerging markets, will play a crucial role in shaping the future of the industry. The market's long-term outlook remains positive, with substantial potential for sustained growth in the coming years.
Well Intervention Industry Segmentation
-
1. Location of Deployment
- 1.1. Onshore
- 1.2. Offshore
Well Intervention Industry Segmentation By Geography
-
1. North America
- 1.1. United States of America
- 1.2. Canada
- 1.3. Rest of the North America
-
2. Europe
- 2.1. United Kingdom
- 2.2. France
- 2.3. Germany
- 2.4. Italy
- 2.5. Rest of the Europe
-
3. Asia Pacific
- 3.1. China
- 3.2. India
- 3.3. South Korea
- 3.4. Rest of the Asia Pacific
-
4. South America
- 4.1. Brazil
- 4.2. Argentina
- 4.3. Rest of the South America
-
5. Middle East and Africa
- 5.1. United Arab Emirates
- 5.2. Saudi Arabia
- 5.3. Rest of the Middle East and Africa
Well Intervention Industry REPORT HIGHLIGHTS
| Aspects | Details |
|---|---|
| Study Period | 2019-2033 |
| Base Year | 2024 |
| Estimated Year | 2025 |
| Forecast Period | 2025-2033 |
| Historical Period | 2019-2024 |
| Growth Rate | CAGR of 6.80% from 2019-2033 |
| Segmentation |
|
Table of Contents
- 1. Introduction
- 1.1. Research Scope
- 1.2. Market Segmentation
- 1.3. Research Methodology
- 1.4. Definitions and Assumptions
- 2. Executive Summary
- 2.1. Introduction
- 3. Market Dynamics
- 3.1. Introduction
- 3.2. Market Drivers
- 3.2.1. 4.; Increased Drilling and Completion Activities
- 3.3. Market Restrains
- 3.3.1. 4.; Volatility of Oil Prices
- 3.4. Market Trends
- 3.4.1. Offshore Segment to have a Significant Market Share
- 4. Market Factor Analysis
- 4.1. Porters Five Forces
- 4.2. Supply/Value Chain
- 4.3. PESTEL analysis
- 4.4. Market Entropy
- 4.5. Patent/Trademark Analysis
- 5. Global Well Intervention Industry Analysis, Insights and Forecast, 2019-2031
- 5.1. Market Analysis, Insights and Forecast - by Location of Deployment
- 5.1.1. Onshore
- 5.1.2. Offshore
- 5.2. Market Analysis, Insights and Forecast - by Region
- 5.2.1. North America
- 5.2.2. Europe
- 5.2.3. Asia Pacific
- 5.2.4. South America
- 5.2.5. Middle East and Africa
- 5.1. Market Analysis, Insights and Forecast - by Location of Deployment
- 6. North America Well Intervention Industry Analysis, Insights and Forecast, 2019-2031
- 6.1. Market Analysis, Insights and Forecast - by Location of Deployment
- 6.1.1. Onshore
- 6.1.2. Offshore
- 6.1. Market Analysis, Insights and Forecast - by Location of Deployment
- 7. Europe Well Intervention Industry Analysis, Insights and Forecast, 2019-2031
- 7.1. Market Analysis, Insights and Forecast - by Location of Deployment
- 7.1.1. Onshore
- 7.1.2. Offshore
- 7.1. Market Analysis, Insights and Forecast - by Location of Deployment
- 8. Asia Pacific Well Intervention Industry Analysis, Insights and Forecast, 2019-2031
- 8.1. Market Analysis, Insights and Forecast - by Location of Deployment
- 8.1.1. Onshore
- 8.1.2. Offshore
- 8.1. Market Analysis, Insights and Forecast - by Location of Deployment
- 9. South America Well Intervention Industry Analysis, Insights and Forecast, 2019-2031
- 9.1. Market Analysis, Insights and Forecast - by Location of Deployment
- 9.1.1. Onshore
- 9.1.2. Offshore
- 9.1. Market Analysis, Insights and Forecast - by Location of Deployment
- 10. Middle East and Africa Well Intervention Industry Analysis, Insights and Forecast, 2019-2031
- 10.1. Market Analysis, Insights and Forecast - by Location of Deployment
- 10.1.1. Onshore
- 10.1.2. Offshore
- 10.1. Market Analysis, Insights and Forecast - by Location of Deployment
- 11. North America Well Intervention Industry Analysis, Insights and Forecast, 2019-2031
- 11.1. Market Analysis, Insights and Forecast - By Country/Sub-region
- 11.1.1 United States
- 11.1.2 Canada
- 11.1.3 Mexico
- 12. Europe Well Intervention Industry Analysis, Insights and Forecast, 2019-2031
- 12.1. Market Analysis, Insights and Forecast - By Country/Sub-region
- 12.1.1 Germany
- 12.1.2 United Kingdom
- 12.1.3 France
- 12.1.4 Spain
- 12.1.5 Italy
- 12.1.6 Spain
- 12.1.7 Belgium
- 12.1.8 Netherland
- 12.1.9 Nordics
- 12.1.10 Rest of Europe
- 13. Asia Pacific Well Intervention Industry Analysis, Insights and Forecast, 2019-2031
- 13.1. Market Analysis, Insights and Forecast - By Country/Sub-region
- 13.1.1 China
- 13.1.2 Japan
- 13.1.3 India
- 13.1.4 South Korea
- 13.1.5 Southeast Asia
- 13.1.6 Australia
- 13.1.7 Indonesia
- 13.1.8 Phillipes
- 13.1.9 Singapore
- 13.1.10 Thailandc
- 13.1.11 Rest of Asia Pacific
- 14. South America Well Intervention Industry Analysis, Insights and Forecast, 2019-2031
- 14.1. Market Analysis, Insights and Forecast - By Country/Sub-region
- 14.1.1 Brazil
- 14.1.2 Argentina
- 14.1.3 Peru
- 14.1.4 Chile
- 14.1.5 Colombia
- 14.1.6 Ecuador
- 14.1.7 Venezuela
- 14.1.8 Rest of South America
- 15. MEA Well Intervention Industry Analysis, Insights and Forecast, 2019-2031
- 15.1. Market Analysis, Insights and Forecast - By Country/Sub-region
- 15.1.1 United Arab Emirates
- 15.1.2 Saudi Arabia
- 15.1.3 South Africa
- 15.1.4 Rest of Middle East and Africa
- 16. Competitive Analysis
- 16.1. Global Market Share Analysis 2024
- 16.2. Company Profiles
- 16.2.1 China Oilfield Services Ltd
- 16.2.1.1. Overview
- 16.2.1.2. Products
- 16.2.1.3. SWOT Analysis
- 16.2.1.4. Recent Developments
- 16.2.1.5. Financials (Based on Availability)
- 16.2.2 Vallourec SA
- 16.2.2.1. Overview
- 16.2.2.2. Products
- 16.2.2.3. SWOT Analysis
- 16.2.2.4. Recent Developments
- 16.2.2.5. Financials (Based on Availability)
- 16.2.3 National Oilwell Varco Inc
- 16.2.3.1. Overview
- 16.2.3.2. Products
- 16.2.3.3. SWOT Analysis
- 16.2.3.4. Recent Developments
- 16.2.3.5. Financials (Based on Availability)
- 16.2.4 Baker Hughes Company
- 16.2.4.1. Overview
- 16.2.4.2. Products
- 16.2.4.3. SWOT Analysis
- 16.2.4.4. Recent Developments
- 16.2.4.5. Financials (Based on Availability)
- 16.2.5 Halliburton Company
- 16.2.5.1. Overview
- 16.2.5.2. Products
- 16.2.5.3. SWOT Analysis
- 16.2.5.4. Recent Developments
- 16.2.5.5. Financials (Based on Availability)
- 16.2.6 Weatherford International Ltd
- 16.2.6.1. Overview
- 16.2.6.2. Products
- 16.2.6.3. SWOT Analysis
- 16.2.6.4. Recent Developments
- 16.2.6.5. Financials (Based on Availability)
- 16.2.7 Schlumberger Limited
- 16.2.7.1. Overview
- 16.2.7.2. Products
- 16.2.7.3. SWOT Analysis
- 16.2.7.4. Recent Developments
- 16.2.7.5. Financials (Based on Availability)
- 16.2.8 Scientific Drilling International Inc
- 16.2.8.1. Overview
- 16.2.8.2. Products
- 16.2.8.3. SWOT Analysis
- 16.2.8.4. Recent Developments
- 16.2.8.5. Financials (Based on Availability)
- 16.2.1 China Oilfield Services Ltd
List of Figures
- Figure 1: Global Well Intervention Industry Revenue Breakdown (Million, %) by Region 2024 & 2032
- Figure 2: North America Well Intervention Industry Revenue (Million), by Country 2024 & 2032
- Figure 3: North America Well Intervention Industry Revenue Share (%), by Country 2024 & 2032
- Figure 4: Europe Well Intervention Industry Revenue (Million), by Country 2024 & 2032
- Figure 5: Europe Well Intervention Industry Revenue Share (%), by Country 2024 & 2032
- Figure 6: Asia Pacific Well Intervention Industry Revenue (Million), by Country 2024 & 2032
- Figure 7: Asia Pacific Well Intervention Industry Revenue Share (%), by Country 2024 & 2032
- Figure 8: South America Well Intervention Industry Revenue (Million), by Country 2024 & 2032
- Figure 9: South America Well Intervention Industry Revenue Share (%), by Country 2024 & 2032
- Figure 10: MEA Well Intervention Industry Revenue (Million), by Country 2024 & 2032
- Figure 11: MEA Well Intervention Industry Revenue Share (%), by Country 2024 & 2032
- Figure 12: North America Well Intervention Industry Revenue (Million), by Location of Deployment 2024 & 2032
- Figure 13: North America Well Intervention Industry Revenue Share (%), by Location of Deployment 2024 & 2032
- Figure 14: North America Well Intervention Industry Revenue (Million), by Country 2024 & 2032
- Figure 15: North America Well Intervention Industry Revenue Share (%), by Country 2024 & 2032
- Figure 16: Europe Well Intervention Industry Revenue (Million), by Location of Deployment 2024 & 2032
- Figure 17: Europe Well Intervention Industry Revenue Share (%), by Location of Deployment 2024 & 2032
- Figure 18: Europe Well Intervention Industry Revenue (Million), by Country 2024 & 2032
- Figure 19: Europe Well Intervention Industry Revenue Share (%), by Country 2024 & 2032
- Figure 20: Asia Pacific Well Intervention Industry Revenue (Million), by Location of Deployment 2024 & 2032
- Figure 21: Asia Pacific Well Intervention Industry Revenue Share (%), by Location of Deployment 2024 & 2032
- Figure 22: Asia Pacific Well Intervention Industry Revenue (Million), by Country 2024 & 2032
- Figure 23: Asia Pacific Well Intervention Industry Revenue Share (%), by Country 2024 & 2032
- Figure 24: South America Well Intervention Industry Revenue (Million), by Location of Deployment 2024 & 2032
- Figure 25: South America Well Intervention Industry Revenue Share (%), by Location of Deployment 2024 & 2032
- Figure 26: South America Well Intervention Industry Revenue (Million), by Country 2024 & 2032
- Figure 27: South America Well Intervention Industry Revenue Share (%), by Country 2024 & 2032
- Figure 28: Middle East and Africa Well Intervention Industry Revenue (Million), by Location of Deployment 2024 & 2032
- Figure 29: Middle East and Africa Well Intervention Industry Revenue Share (%), by Location of Deployment 2024 & 2032
- Figure 30: Middle East and Africa Well Intervention Industry Revenue (Million), by Country 2024 & 2032
- Figure 31: Middle East and Africa Well Intervention Industry Revenue Share (%), by Country 2024 & 2032
List of Tables
- Table 1: Global Well Intervention Industry Revenue Million Forecast, by Region 2019 & 2032
- Table 2: Global Well Intervention Industry Revenue Million Forecast, by Location of Deployment 2019 & 2032
- Table 3: Global Well Intervention Industry Revenue Million Forecast, by Region 2019 & 2032
- Table 4: Global Well Intervention Industry Revenue Million Forecast, by Country 2019 & 2032
- Table 5: United States Well Intervention Industry Revenue (Million) Forecast, by Application 2019 & 2032
- Table 6: Canada Well Intervention Industry Revenue (Million) Forecast, by Application 2019 & 2032
- Table 7: Mexico Well Intervention Industry Revenue (Million) Forecast, by Application 2019 & 2032
- Table 8: Global Well Intervention Industry Revenue Million Forecast, by Country 2019 & 2032
- Table 9: Germany Well Intervention Industry Revenue (Million) Forecast, by Application 2019 & 2032
- Table 10: United Kingdom Well Intervention Industry Revenue (Million) Forecast, by Application 2019 & 2032
- Table 11: France Well Intervention Industry Revenue (Million) Forecast, by Application 2019 & 2032
- Table 12: Spain Well Intervention Industry Revenue (Million) Forecast, by Application 2019 & 2032
- Table 13: Italy Well Intervention Industry Revenue (Million) Forecast, by Application 2019 & 2032
- Table 14: Spain Well Intervention Industry Revenue (Million) Forecast, by Application 2019 & 2032
- Table 15: Belgium Well Intervention Industry Revenue (Million) Forecast, by Application 2019 & 2032
- Table 16: Netherland Well Intervention Industry Revenue (Million) Forecast, by Application 2019 & 2032
- Table 17: Nordics Well Intervention Industry Revenue (Million) Forecast, by Application 2019 & 2032
- Table 18: Rest of Europe Well Intervention Industry Revenue (Million) Forecast, by Application 2019 & 2032
- Table 19: Global Well Intervention Industry Revenue Million Forecast, by Country 2019 & 2032
- Table 20: China Well Intervention Industry Revenue (Million) Forecast, by Application 2019 & 2032
- Table 21: Japan Well Intervention Industry Revenue (Million) Forecast, by Application 2019 & 2032
- Table 22: India Well Intervention Industry Revenue (Million) Forecast, by Application 2019 & 2032
- Table 23: South Korea Well Intervention Industry Revenue (Million) Forecast, by Application 2019 & 2032
- Table 24: Southeast Asia Well Intervention Industry Revenue (Million) Forecast, by Application 2019 & 2032
- Table 25: Australia Well Intervention Industry Revenue (Million) Forecast, by Application 2019 & 2032
- Table 26: Indonesia Well Intervention Industry Revenue (Million) Forecast, by Application 2019 & 2032
- Table 27: Phillipes Well Intervention Industry Revenue (Million) Forecast, by Application 2019 & 2032
- Table 28: Singapore Well Intervention Industry Revenue (Million) Forecast, by Application 2019 & 2032
- Table 29: Thailandc Well Intervention Industry Revenue (Million) Forecast, by Application 2019 & 2032
- Table 30: Rest of Asia Pacific Well Intervention Industry Revenue (Million) Forecast, by Application 2019 & 2032
- Table 31: Global Well Intervention Industry Revenue Million Forecast, by Country 2019 & 2032
- Table 32: Brazil Well Intervention Industry Revenue (Million) Forecast, by Application 2019 & 2032
- Table 33: Argentina Well Intervention Industry Revenue (Million) Forecast, by Application 2019 & 2032
- Table 34: Peru Well Intervention Industry Revenue (Million) Forecast, by Application 2019 & 2032
- Table 35: Chile Well Intervention Industry Revenue (Million) Forecast, by Application 2019 & 2032
- Table 36: Colombia Well Intervention Industry Revenue (Million) Forecast, by Application 2019 & 2032
- Table 37: Ecuador Well Intervention Industry Revenue (Million) Forecast, by Application 2019 & 2032
- Table 38: Venezuela Well Intervention Industry Revenue (Million) Forecast, by Application 2019 & 2032
- Table 39: Rest of South America Well Intervention Industry Revenue (Million) Forecast, by Application 2019 & 2032
- Table 40: Global Well Intervention Industry Revenue Million Forecast, by Country 2019 & 2032
- Table 41: United Arab Emirates Well Intervention Industry Revenue (Million) Forecast, by Application 2019 & 2032
- Table 42: Saudi Arabia Well Intervention Industry Revenue (Million) Forecast, by Application 2019 & 2032
- Table 43: South Africa Well Intervention Industry Revenue (Million) Forecast, by Application 2019 & 2032
- Table 44: Rest of Middle East and Africa Well Intervention Industry Revenue (Million) Forecast, by Application 2019 & 2032
- Table 45: Global Well Intervention Industry Revenue Million Forecast, by Location of Deployment 2019 & 2032
- Table 46: Global Well Intervention Industry Revenue Million Forecast, by Country 2019 & 2032
- Table 47: United States of America Well Intervention Industry Revenue (Million) Forecast, by Application 2019 & 2032
- Table 48: Canada Well Intervention Industry Revenue (Million) Forecast, by Application 2019 & 2032
- Table 49: Rest of the North America Well Intervention Industry Revenue (Million) Forecast, by Application 2019 & 2032
- Table 50: Global Well Intervention Industry Revenue Million Forecast, by Location of Deployment 2019 & 2032
- Table 51: Global Well Intervention Industry Revenue Million Forecast, by Country 2019 & 2032
- Table 52: United Kingdom Well Intervention Industry Revenue (Million) Forecast, by Application 2019 & 2032
- Table 53: France Well Intervention Industry Revenue (Million) Forecast, by Application 2019 & 2032
- Table 54: Germany Well Intervention Industry Revenue (Million) Forecast, by Application 2019 & 2032
- Table 55: Italy Well Intervention Industry Revenue (Million) Forecast, by Application 2019 & 2032
- Table 56: Rest of the Europe Well Intervention Industry Revenue (Million) Forecast, by Application 2019 & 2032
- Table 57: Global Well Intervention Industry Revenue Million Forecast, by Location of Deployment 2019 & 2032
- Table 58: Global Well Intervention Industry Revenue Million Forecast, by Country 2019 & 2032
- Table 59: China Well Intervention Industry Revenue (Million) Forecast, by Application 2019 & 2032
- Table 60: India Well Intervention Industry Revenue (Million) Forecast, by Application 2019 & 2032
- Table 61: South Korea Well Intervention Industry Revenue (Million) Forecast, by Application 2019 & 2032
- Table 62: Rest of the Asia Pacific Well Intervention Industry Revenue (Million) Forecast, by Application 2019 & 2032
- Table 63: Global Well Intervention Industry Revenue Million Forecast, by Location of Deployment 2019 & 2032
- Table 64: Global Well Intervention Industry Revenue Million Forecast, by Country 2019 & 2032
- Table 65: Brazil Well Intervention Industry Revenue (Million) Forecast, by Application 2019 & 2032
- Table 66: Argentina Well Intervention Industry Revenue (Million) Forecast, by Application 2019 & 2032
- Table 67: Rest of the South America Well Intervention Industry Revenue (Million) Forecast, by Application 2019 & 2032
- Table 68: Global Well Intervention Industry Revenue Million Forecast, by Location of Deployment 2019 & 2032
- Table 69: Global Well Intervention Industry Revenue Million Forecast, by Country 2019 & 2032
- Table 70: United Arab Emirates Well Intervention Industry Revenue (Million) Forecast, by Application 2019 & 2032
- Table 71: Saudi Arabia Well Intervention Industry Revenue (Million) Forecast, by Application 2019 & 2032
- Table 72: Rest of the Middle East and Africa Well Intervention Industry Revenue (Million) Forecast, by Application 2019 & 2032
Frequently Asked Questions
1. What is the projected Compound Annual Growth Rate (CAGR) of the Well Intervention Industry?
The projected CAGR is approximately 6.80%.
2. Which companies are prominent players in the Well Intervention Industry?
Key companies in the market include China Oilfield Services Ltd, Vallourec SA, National Oilwell Varco Inc, Baker Hughes Company, Halliburton Company, Weatherford International Ltd, Schlumberger Limited, Scientific Drilling International Inc.
3. What are the main segments of the Well Intervention Industry?
The market segments include Location of Deployment.
4. Can you provide details about the market size?
The market size is estimated to be USD 8.49 Million as of 2022.
5. What are some drivers contributing to market growth?
4.; Increased Drilling and Completion Activities.
6. What are the notable trends driving market growth?
Offshore Segment to have a Significant Market Share.
7. Are there any restraints impacting market growth?
4.; Volatility of Oil Prices.
8. Can you provide examples of recent developments in the market?
In May 2023, TechnipFMC got a contract from Equinor to provide riserless light well intervention (RLWI) services on the Norwegian Continental Shelf. The contract includes production enhancement, production data, and pre-plug-and-abandonment services with a time bond from 2024 to 2025, with options to extend for the three subsequent years.
9. What pricing options are available for accessing the report?
Pricing options include single-user, multi-user, and enterprise licenses priced at USD 4750, USD 5250, and USD 8750 respectively.
10. Is the market size provided in terms of value or volume?
The market size is provided in terms of value, measured in Million.
11. Are there any specific market keywords associated with the report?
Yes, the market keyword associated with the report is "Well Intervention Industry," which aids in identifying and referencing the specific market segment covered.
12. How do I determine which pricing option suits my needs best?
The pricing options vary based on user requirements and access needs. Individual users may opt for single-user licenses, while businesses requiring broader access may choose multi-user or enterprise licenses for cost-effective access to the report.
13. Are there any additional resources or data provided in the Well Intervention Industry report?
While the report offers comprehensive insights, it's advisable to review the specific contents or supplementary materials provided to ascertain if additional resources or data are available.
14. How can I stay updated on further developments or reports in the Well Intervention Industry?
To stay informed about further developments, trends, and reports in the Well Intervention Industry, consider subscribing to industry newsletters, following relevant companies and organizations, or regularly checking reputable industry news sources and publications.
Methodology
Step 1 - Identification of Relevant Samples Size from Population Database


Step 2 - Approaches for Defining Global Market Size (Value, Volume* & Price*)

Note*: In applicable scenarios
Step 3 - Data Sources
Primary Research
- Web Analytics
- Survey Reports
- Research Institute
- Latest Research Reports
- Opinion Leaders
Secondary Research
- Annual Reports
- White Paper
- Latest Press Release
- Industry Association
- Paid Database
- Investor Presentations

Step 4 - Data Triangulation
Involves using different sources of information in order to increase the validity of a study
These sources are likely to be stakeholders in a program - participants, other researchers, program staff, other community members, and so on.
Then we put all data in single framework & apply various statistical tools to find out the dynamic on the market.
During the analysis stage, feedback from the stakeholder groups would be compared to determine areas of agreement as well as areas of divergence
