

Key Insights
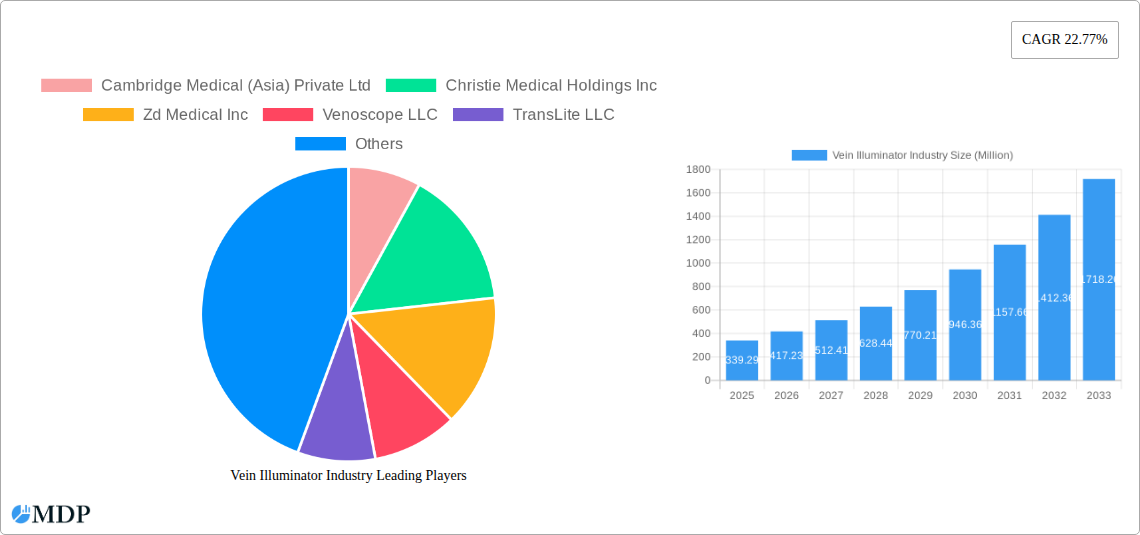
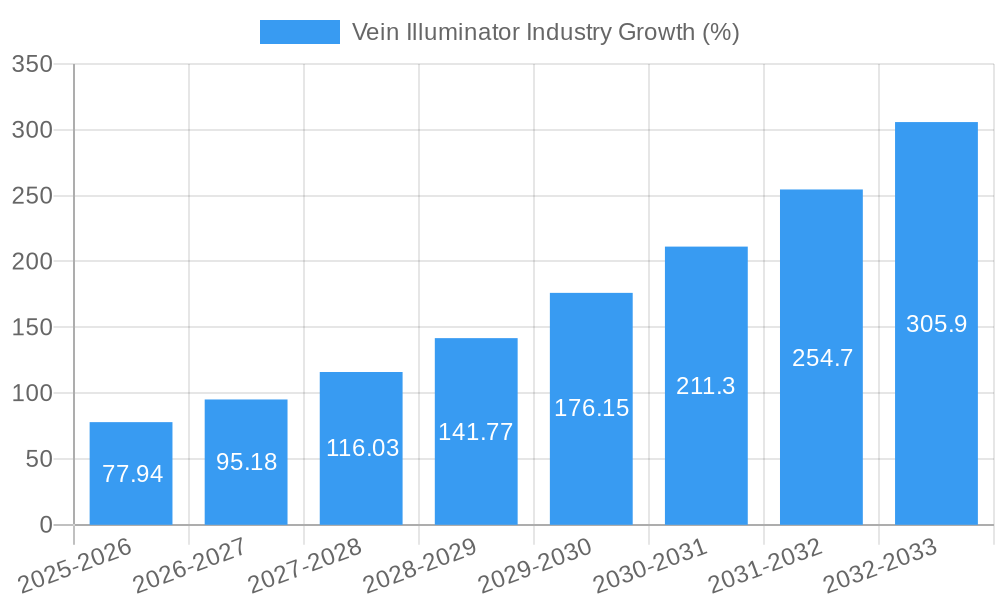
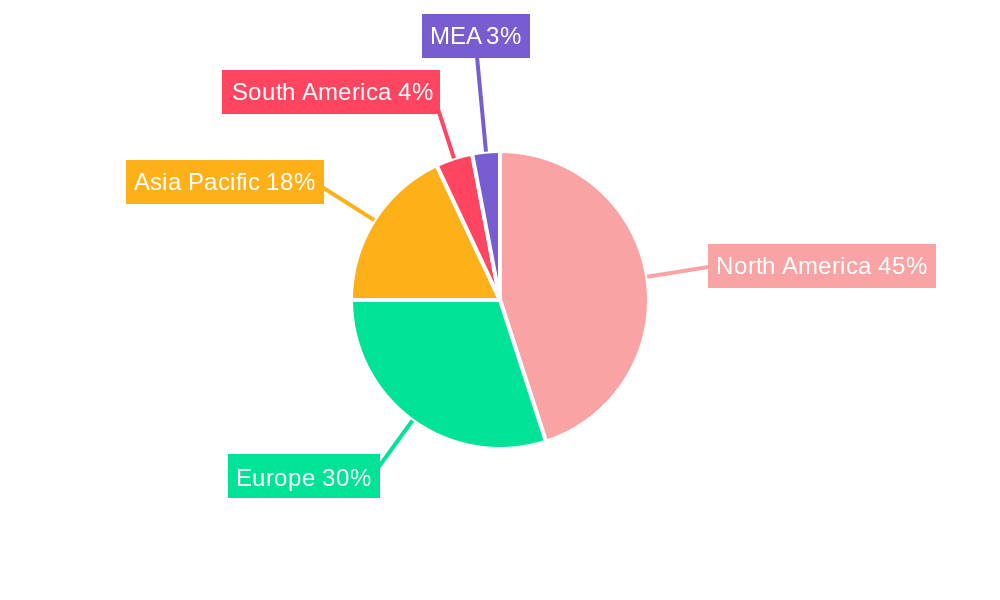
The vein illuminator market, valued at $339.29 million in 2025, is experiencing robust growth, projected to expand at a compound annual growth rate (CAGR) of 22.77% from 2025 to 2033. This significant expansion is driven by several key factors. The increasing prevalence of chronic diseases requiring frequent venipuncture, such as diabetes and cardiovascular conditions, fuels demand for improved vein visualization technology. Furthermore, the growing adoption of minimally invasive procedures and the rising emphasis on patient safety and reduced complications during intravenous access contribute to market growth. Technological advancements, including improved image clarity and portability of devices, are also driving adoption across various healthcare settings. The market is segmented by application (venipuncture assistance, IV access, sclerotherapy, and other applications) and end-user (hospitals, blood banks, rehabilitation centers, academic institutions, paramedic applications, and other end-users). North America currently holds a significant market share, attributed to high healthcare expenditure and technological advancements in the region. However, Asia-Pacific is anticipated to witness substantial growth driven by rising healthcare infrastructure development and increasing awareness of advanced medical technologies. While the market faces challenges such as high initial investment costs and potential regulatory hurdles for new technologies, the overall outlook remains exceptionally positive, fueled by sustained growth in the healthcare industry and the increasing need for efficient and effective vein visualization solutions.
The competitive landscape is characterized by a mix of established players and emerging companies. Key players like AccuVein Inc., Christie Medical Holdings Inc., and others are actively engaged in research and development, aiming to enhance product features and expand their market reach. Strategic collaborations and partnerships between device manufacturers and healthcare providers are fostering market growth. The future trajectory indicates a continued rise in demand for advanced vein illuminators, especially in emerging economies where access to efficient healthcare technologies remains limited. This expansion will likely be accompanied by the introduction of innovative products featuring enhanced functionalities and improved user-friendliness. The market is expected to see further segmentation with the development of specialized devices targeted at specific applications and end-user needs.
Vein Illuminator Market Report: 2019-2033 - A Comprehensive Analysis
This comprehensive report provides an in-depth analysis of the global vein illuminator market, offering crucial insights for stakeholders across the industry. The study period covers 2019-2033, with a base year of 2025 and a forecast period of 2025-2033. We examine market dynamics, leading players, technological advancements, and emerging opportunities to provide a complete picture of this rapidly evolving sector. The market is expected to reach xx Million by 2033, exhibiting a CAGR of xx% during the forecast period.
Vein Illuminator Industry Market Dynamics & Concentration
The vein illuminator market is characterized by moderate concentration, with key players like AccuVein Inc., Christie Medical Holdings Inc., and Zd Medical Inc. holding significant market share. The market share of these leading players is estimated to be approximately xx% in 2025. Innovation is a key driver, with companies continuously improving device accuracy, portability, and ease of use. Regulatory frameworks, such as those related to medical device approvals (e.g., FDA clearance in the US), significantly influence market entry and product development. While no direct substitutes exist, alternative venipuncture techniques represent indirect competition. End-user trends show increasing preference for minimally invasive procedures, bolstering demand for vein illuminators. Mergers and acquisitions (M&A) activity within the sector has been moderate, with xx M&A deals recorded between 2019 and 2024. This activity reflects the strategic consolidation efforts within the vein illuminator market.
- Market Concentration: Moderate, with top 3 players holding xx% market share in 2025.
- Innovation Drivers: Improved accuracy, portability, and ease of use.
- Regulatory Framework: Stringent medical device approvals (FDA, etc.)
- Product Substitutes: Alternative venipuncture techniques (indirect competition).
- End-User Trends: Growing preference for minimally invasive procedures.
- M&A Activity: xx deals recorded between 2019 and 2024.
Vein Illuminator Industry Industry Trends & Analysis
The vein illuminator market is experiencing robust growth driven by factors like the rising prevalence of chronic diseases requiring frequent IV access (e.g., diabetes, cancer), increasing demand for minimally invasive procedures, and technological advancements enhancing device accuracy and performance. Technological disruptions, such as the incorporation of AI and machine learning for improved vein detection, are reshaping the market landscape. Consumer preferences are shifting toward user-friendly, portable, and cost-effective devices. Competitive dynamics are intense, with companies focusing on product differentiation, strategic partnerships, and geographic expansion. The market is projected to witness significant expansion, with a CAGR of xx% from 2025 to 2033, driven by increasing adoption across healthcare settings and rising awareness among healthcare professionals. Market penetration is estimated to reach xx% by 2033.
Leading Markets & Segments in Vein Illuminator Industry
The North American market currently dominates the vein illuminator industry, driven by factors such as high healthcare expenditure, advanced healthcare infrastructure, and early adoption of innovative medical technologies. Within applications, venipuncture assistance and IV access segments hold the largest market share, owing to their widespread use in hospitals and clinics. Hospitals constitute the largest end-user segment, followed by blood banks.
- Key Drivers in North America: High healthcare expenditure, advanced infrastructure, early adoption of new technologies.
- Dominant Applications: Venipuncture assistance and IV access.
- Dominant End-User: Hospitals, followed by blood banks.
- Europe Market Drivers: Increasing aging population, growing prevalence of chronic diseases.
- Asia-Pacific Market Drivers: Rising healthcare expenditure, improving healthcare infrastructure.
Vein Illuminator Industry Product Developments
Recent product developments focus on enhancing vein visualization capabilities, improving portability, and integrating features like real-time feedback and data analysis. New devices are smaller, lighter, and easier to use, improving efficiency and reducing procedural errors. Technological advancements such as near-infrared (NIR) imaging technology are improving the accuracy and efficacy of these devices. These innovations meet the growing demand for minimally invasive techniques and improved patient outcomes.
Key Drivers of Vein Illuminator Industry Growth
The vein illuminator market's growth is fueled by several factors: the increasing prevalence of chronic diseases necessitating frequent intravenous procedures, the rising demand for minimally invasive procedures to reduce patient discomfort and complications, and the continuous technological advancements enhancing device accuracy, portability, and ease of use. Favorable regulatory environments and growing healthcare expenditure also contribute positively to the market's growth trajectory.
Challenges in the Vein Illuminator Industry Market
The vein illuminator market faces challenges like high initial investment costs for advanced devices, stringent regulatory approvals slowing down product launches, and intense competition from established and emerging players. Supply chain disruptions can impact production and availability, affecting market growth. Price competition and the need for ongoing technological upgrades also present significant challenges.
Emerging Opportunities in Vein Illuminator Industry
Significant opportunities exist for expansion into emerging markets with growing healthcare infrastructure and increasing awareness of minimally invasive techniques. Strategic partnerships with healthcare providers and distributors can expand market reach. Technological advancements such as AI-powered vein detection and integration with Electronic Health Records (EHR) systems will unlock further growth potential, improving efficiency and patient care. Developing devices for niche applications, such as pediatric use, could also provide new avenues for growth.
Leading Players in the Vein Illuminator Industry Sector
- AccuVein Inc.
- Christie Medical Holdings Inc
- Zd Medical Inc
- Venoscope LLC
- TransLite LLC
- VueTek Scientific LLC
- Sharn Anesthesia
- Near Infrared Imaging Inc
- Cambridge Medical (Asia) Private Ltd
Key Milestones in Vein Illuminator Industry Industry
- 2020: AccuVein Inc. launches a new generation of vein illuminator with improved visualization capabilities.
- 2022: Zd Medical Inc. receives FDA clearance for its novel vein illumination device.
- 2023: A significant merger between two smaller players leads to increased market consolidation.
- 2024: Christie Medical Holdings Inc. secures a major distribution deal for its product line in the European market.
Strategic Outlook for Vein Illuminator Industry Market
The vein illuminator market holds substantial growth potential, driven by ongoing technological advancements, expansion into emerging markets, and increasing healthcare expenditure. Strategic partnerships, product diversification, and focus on improved user experience will be key factors for success in this dynamic sector. Companies that adapt quickly to technological changes and regulatory landscapes are poised to capture significant market share in the coming years.
Vein Illuminator Industry Segmentation
-
1. Application
- 1.1. Venipuncture Assistance
- 1.2. IV Access
- 1.3. Sclerotherapy
- 1.4. Other Applications
-
2. End User
- 2.1. Hospital
- 2.2. Blood Camp
- 2.3. Rehabilitation
- 2.4. Academic Institution
- 2.5. Parademic Application
- 2.6. Other End Users
Vein Illuminator Industry Segmentation By Geography
- 1. North America
- 2. Europe
- 3. Asia Pacific
- 4. Latin America
- 5. Middle East
Vein Illuminator Industry REPORT HIGHLIGHTS
| Aspects | Details |
|---|---|
| Study Period | 2019-2033 |
| Base Year | 2024 |
| Estimated Year | 2025 |
| Forecast Period | 2025-2033 |
| Historical Period | 2019-2024 |
| Growth Rate | CAGR of 22.77% from 2019-2033 |
| Segmentation |
|
Table of Contents
- 1. Introduction
- 1.1. Research Scope
- 1.2. Market Segmentation
- 1.3. Research Methodology
- 1.4. Definitions and Assumptions
- 2. Executive Summary
- 2.1. Introduction
- 3. Market Dynamics
- 3.1. Introduction
- 3.2. Market Drivers
- 3.2.1. ; Increased Success Rate of Blood Draw at First Attempt; Increased Patient Satisfaction
- 3.3. Market Restrains
- 3.3.1. ; Higher Costs
- 3.4. Market Trends
- 3.4.1. Growing Healthcare Spending and Equipment Market Expected to Drive the Market
- 4. Market Factor Analysis
- 4.1. Porters Five Forces
- 4.2. Supply/Value Chain
- 4.3. PESTEL analysis
- 4.4. Market Entropy
- 4.5. Patent/Trademark Analysis
- 5. Global Vein Illuminator Industry Analysis, Insights and Forecast, 2019-2031
- 5.1. Market Analysis, Insights and Forecast - by Application
- 5.1.1. Venipuncture Assistance
- 5.1.2. IV Access
- 5.1.3. Sclerotherapy
- 5.1.4. Other Applications
- 5.2. Market Analysis, Insights and Forecast - by End User
- 5.2.1. Hospital
- 5.2.2. Blood Camp
- 5.2.3. Rehabilitation
- 5.2.4. Academic Institution
- 5.2.5. Parademic Application
- 5.2.6. Other End Users
- 5.3. Market Analysis, Insights and Forecast - by Region
- 5.3.1. North America
- 5.3.2. Europe
- 5.3.3. Asia Pacific
- 5.3.4. Latin America
- 5.3.5. Middle East
- 5.1. Market Analysis, Insights and Forecast - by Application
- 6. North America Vein Illuminator Industry Analysis, Insights and Forecast, 2019-2031
- 6.1. Market Analysis, Insights and Forecast - by Application
- 6.1.1. Venipuncture Assistance
- 6.1.2. IV Access
- 6.1.3. Sclerotherapy
- 6.1.4. Other Applications
- 6.2. Market Analysis, Insights and Forecast - by End User
- 6.2.1. Hospital
- 6.2.2. Blood Camp
- 6.2.3. Rehabilitation
- 6.2.4. Academic Institution
- 6.2.5. Parademic Application
- 6.2.6. Other End Users
- 6.1. Market Analysis, Insights and Forecast - by Application
- 7. Europe Vein Illuminator Industry Analysis, Insights and Forecast, 2019-2031
- 7.1. Market Analysis, Insights and Forecast - by Application
- 7.1.1. Venipuncture Assistance
- 7.1.2. IV Access
- 7.1.3. Sclerotherapy
- 7.1.4. Other Applications
- 7.2. Market Analysis, Insights and Forecast - by End User
- 7.2.1. Hospital
- 7.2.2. Blood Camp
- 7.2.3. Rehabilitation
- 7.2.4. Academic Institution
- 7.2.5. Parademic Application
- 7.2.6. Other End Users
- 7.1. Market Analysis, Insights and Forecast - by Application
- 8. Asia Pacific Vein Illuminator Industry Analysis, Insights and Forecast, 2019-2031
- 8.1. Market Analysis, Insights and Forecast - by Application
- 8.1.1. Venipuncture Assistance
- 8.1.2. IV Access
- 8.1.3. Sclerotherapy
- 8.1.4. Other Applications
- 8.2. Market Analysis, Insights and Forecast - by End User
- 8.2.1. Hospital
- 8.2.2. Blood Camp
- 8.2.3. Rehabilitation
- 8.2.4. Academic Institution
- 8.2.5. Parademic Application
- 8.2.6. Other End Users
- 8.1. Market Analysis, Insights and Forecast - by Application
- 9. Latin America Vein Illuminator Industry Analysis, Insights and Forecast, 2019-2031
- 9.1. Market Analysis, Insights and Forecast - by Application
- 9.1.1. Venipuncture Assistance
- 9.1.2. IV Access
- 9.1.3. Sclerotherapy
- 9.1.4. Other Applications
- 9.2. Market Analysis, Insights and Forecast - by End User
- 9.2.1. Hospital
- 9.2.2. Blood Camp
- 9.2.3. Rehabilitation
- 9.2.4. Academic Institution
- 9.2.5. Parademic Application
- 9.2.6. Other End Users
- 9.1. Market Analysis, Insights and Forecast - by Application
- 10. Middle East Vein Illuminator Industry Analysis, Insights and Forecast, 2019-2031
- 10.1. Market Analysis, Insights and Forecast - by Application
- 10.1.1. Venipuncture Assistance
- 10.1.2. IV Access
- 10.1.3. Sclerotherapy
- 10.1.4. Other Applications
- 10.2. Market Analysis, Insights and Forecast - by End User
- 10.2.1. Hospital
- 10.2.2. Blood Camp
- 10.2.3. Rehabilitation
- 10.2.4. Academic Institution
- 10.2.5. Parademic Application
- 10.2.6. Other End Users
- 10.1. Market Analysis, Insights and Forecast - by Application
- 11. North America Vein Illuminator Industry Analysis, Insights and Forecast, 2019-2031
- 11.1. Market Analysis, Insights and Forecast - By Country/Sub-region
- 11.1.1 United States
- 11.1.2 Canada
- 11.1.3 Mexico
- 12. Europe Vein Illuminator Industry Analysis, Insights and Forecast, 2019-2031
- 12.1. Market Analysis, Insights and Forecast - By Country/Sub-region
- 12.1.1 Germany
- 12.1.2 United Kingdom
- 12.1.3 France
- 12.1.4 Spain
- 12.1.5 Italy
- 12.1.6 Spain
- 12.1.7 Belgium
- 12.1.8 Netherland
- 12.1.9 Nordics
- 12.1.10 Rest of Europe
- 13. Asia Pacific Vein Illuminator Industry Analysis, Insights and Forecast, 2019-2031
- 13.1. Market Analysis, Insights and Forecast - By Country/Sub-region
- 13.1.1 China
- 13.1.2 Japan
- 13.1.3 India
- 13.1.4 South Korea
- 13.1.5 Southeast Asia
- 13.1.6 Australia
- 13.1.7 Indonesia
- 13.1.8 Phillipes
- 13.1.9 Singapore
- 13.1.10 Thailandc
- 13.1.11 Rest of Asia Pacific
- 14. South America Vein Illuminator Industry Analysis, Insights and Forecast, 2019-2031
- 14.1. Market Analysis, Insights and Forecast - By Country/Sub-region
- 14.1.1 Brazil
- 14.1.2 Argentina
- 14.1.3 Peru
- 14.1.4 Chile
- 14.1.5 Colombia
- 14.1.6 Ecuador
- 14.1.7 Venezuela
- 14.1.8 Rest of South America
- 15. North America Vein Illuminator Industry Analysis, Insights and Forecast, 2019-2031
- 15.1. Market Analysis, Insights and Forecast - By Country/Sub-region
- 15.1.1 United States
- 15.1.2 Canada
- 15.1.3 Mexico
- 16. MEA Vein Illuminator Industry Analysis, Insights and Forecast, 2019-2031
- 16.1. Market Analysis, Insights and Forecast - By Country/Sub-region
- 16.1.1 United Arab Emirates
- 16.1.2 Saudi Arabia
- 16.1.3 South Africa
- 16.1.4 Rest of Middle East and Africa
- 17. Competitive Analysis
- 17.1. Global Market Share Analysis 2024
- 17.2. Company Profiles
- 17.2.1 Cambridge Medical (Asia) Private Ltd
- 17.2.1.1. Overview
- 17.2.1.2. Products
- 17.2.1.3. SWOT Analysis
- 17.2.1.4. Recent Developments
- 17.2.1.5. Financials (Based on Availability)
- 17.2.2 Christie Medical Holdings Inc
- 17.2.2.1. Overview
- 17.2.2.2. Products
- 17.2.2.3. SWOT Analysis
- 17.2.2.4. Recent Developments
- 17.2.2.5. Financials (Based on Availability)
- 17.2.3 Zd Medical Inc
- 17.2.3.1. Overview
- 17.2.3.2. Products
- 17.2.3.3. SWOT Analysis
- 17.2.3.4. Recent Developments
- 17.2.3.5. Financials (Based on Availability)
- 17.2.4 Venoscope LLC
- 17.2.4.1. Overview
- 17.2.4.2. Products
- 17.2.4.3. SWOT Analysis
- 17.2.4.4. Recent Developments
- 17.2.4.5. Financials (Based on Availability)
- 17.2.5 TransLite LLC
- 17.2.5.1. Overview
- 17.2.5.2. Products
- 17.2.5.3. SWOT Analysis
- 17.2.5.4. Recent Developments
- 17.2.5.5. Financials (Based on Availability)
- 17.2.6 VueTek Scientific LLC
- 17.2.6.1. Overview
- 17.2.6.2. Products
- 17.2.6.3. SWOT Analysis
- 17.2.6.4. Recent Developments
- 17.2.6.5. Financials (Based on Availability)
- 17.2.7 AccuVein Inc
- 17.2.7.1. Overview
- 17.2.7.2. Products
- 17.2.7.3. SWOT Analysis
- 17.2.7.4. Recent Developments
- 17.2.7.5. Financials (Based on Availability)
- 17.2.8 Sharn Anesthesia
- 17.2.8.1. Overview
- 17.2.8.2. Products
- 17.2.8.3. SWOT Analysis
- 17.2.8.4. Recent Developments
- 17.2.8.5. Financials (Based on Availability)
- 17.2.9 Near Infrared Imaging Inc
- 17.2.9.1. Overview
- 17.2.9.2. Products
- 17.2.9.3. SWOT Analysis
- 17.2.9.4. Recent Developments
- 17.2.9.5. Financials (Based on Availability)
- 17.2.1 Cambridge Medical (Asia) Private Ltd
List of Figures
- Figure 1: Global Vein Illuminator Industry Revenue Breakdown (Million, %) by Region 2024 & 2032
- Figure 2: Global Vein Illuminator Industry Volume Breakdown (K Unit, %) by Region 2024 & 2032
- Figure 3: North America Vein Illuminator Industry Revenue (Million), by Country 2024 & 2032
- Figure 4: North America Vein Illuminator Industry Volume (K Unit), by Country 2024 & 2032
- Figure 5: North America Vein Illuminator Industry Revenue Share (%), by Country 2024 & 2032
- Figure 6: North America Vein Illuminator Industry Volume Share (%), by Country 2024 & 2032
- Figure 7: Europe Vein Illuminator Industry Revenue (Million), by Country 2024 & 2032
- Figure 8: Europe Vein Illuminator Industry Volume (K Unit), by Country 2024 & 2032
- Figure 9: Europe Vein Illuminator Industry Revenue Share (%), by Country 2024 & 2032
- Figure 10: Europe Vein Illuminator Industry Volume Share (%), by Country 2024 & 2032
- Figure 11: Asia Pacific Vein Illuminator Industry Revenue (Million), by Country 2024 & 2032
- Figure 12: Asia Pacific Vein Illuminator Industry Volume (K Unit), by Country 2024 & 2032
- Figure 13: Asia Pacific Vein Illuminator Industry Revenue Share (%), by Country 2024 & 2032
- Figure 14: Asia Pacific Vein Illuminator Industry Volume Share (%), by Country 2024 & 2032
- Figure 15: South America Vein Illuminator Industry Revenue (Million), by Country 2024 & 2032
- Figure 16: South America Vein Illuminator Industry Volume (K Unit), by Country 2024 & 2032
- Figure 17: South America Vein Illuminator Industry Revenue Share (%), by Country 2024 & 2032
- Figure 18: South America Vein Illuminator Industry Volume Share (%), by Country 2024 & 2032
- Figure 19: North America Vein Illuminator Industry Revenue (Million), by Country 2024 & 2032
- Figure 20: North America Vein Illuminator Industry Volume (K Unit), by Country 2024 & 2032
- Figure 21: North America Vein Illuminator Industry Revenue Share (%), by Country 2024 & 2032
- Figure 22: North America Vein Illuminator Industry Volume Share (%), by Country 2024 & 2032
- Figure 23: MEA Vein Illuminator Industry Revenue (Million), by Country 2024 & 2032
- Figure 24: MEA Vein Illuminator Industry Volume (K Unit), by Country 2024 & 2032
- Figure 25: MEA Vein Illuminator Industry Revenue Share (%), by Country 2024 & 2032
- Figure 26: MEA Vein Illuminator Industry Volume Share (%), by Country 2024 & 2032
- Figure 27: North America Vein Illuminator Industry Revenue (Million), by Application 2024 & 2032
- Figure 28: North America Vein Illuminator Industry Volume (K Unit), by Application 2024 & 2032
- Figure 29: North America Vein Illuminator Industry Revenue Share (%), by Application 2024 & 2032
- Figure 30: North America Vein Illuminator Industry Volume Share (%), by Application 2024 & 2032
- Figure 31: North America Vein Illuminator Industry Revenue (Million), by End User 2024 & 2032
- Figure 32: North America Vein Illuminator Industry Volume (K Unit), by End User 2024 & 2032
- Figure 33: North America Vein Illuminator Industry Revenue Share (%), by End User 2024 & 2032
- Figure 34: North America Vein Illuminator Industry Volume Share (%), by End User 2024 & 2032
- Figure 35: North America Vein Illuminator Industry Revenue (Million), by Country 2024 & 2032
- Figure 36: North America Vein Illuminator Industry Volume (K Unit), by Country 2024 & 2032
- Figure 37: North America Vein Illuminator Industry Revenue Share (%), by Country 2024 & 2032
- Figure 38: North America Vein Illuminator Industry Volume Share (%), by Country 2024 & 2032
- Figure 39: Europe Vein Illuminator Industry Revenue (Million), by Application 2024 & 2032
- Figure 40: Europe Vein Illuminator Industry Volume (K Unit), by Application 2024 & 2032
- Figure 41: Europe Vein Illuminator Industry Revenue Share (%), by Application 2024 & 2032
- Figure 42: Europe Vein Illuminator Industry Volume Share (%), by Application 2024 & 2032
- Figure 43: Europe Vein Illuminator Industry Revenue (Million), by End User 2024 & 2032
- Figure 44: Europe Vein Illuminator Industry Volume (K Unit), by End User 2024 & 2032
- Figure 45: Europe Vein Illuminator Industry Revenue Share (%), by End User 2024 & 2032
- Figure 46: Europe Vein Illuminator Industry Volume Share (%), by End User 2024 & 2032
- Figure 47: Europe Vein Illuminator Industry Revenue (Million), by Country 2024 & 2032
- Figure 48: Europe Vein Illuminator Industry Volume (K Unit), by Country 2024 & 2032
- Figure 49: Europe Vein Illuminator Industry Revenue Share (%), by Country 2024 & 2032
- Figure 50: Europe Vein Illuminator Industry Volume Share (%), by Country 2024 & 2032
- Figure 51: Asia Pacific Vein Illuminator Industry Revenue (Million), by Application 2024 & 2032
- Figure 52: Asia Pacific Vein Illuminator Industry Volume (K Unit), by Application 2024 & 2032
- Figure 53: Asia Pacific Vein Illuminator Industry Revenue Share (%), by Application 2024 & 2032
- Figure 54: Asia Pacific Vein Illuminator Industry Volume Share (%), by Application 2024 & 2032
- Figure 55: Asia Pacific Vein Illuminator Industry Revenue (Million), by End User 2024 & 2032
- Figure 56: Asia Pacific Vein Illuminator Industry Volume (K Unit), by End User 2024 & 2032
- Figure 57: Asia Pacific Vein Illuminator Industry Revenue Share (%), by End User 2024 & 2032
- Figure 58: Asia Pacific Vein Illuminator Industry Volume Share (%), by End User 2024 & 2032
- Figure 59: Asia Pacific Vein Illuminator Industry Revenue (Million), by Country 2024 & 2032
- Figure 60: Asia Pacific Vein Illuminator Industry Volume (K Unit), by Country 2024 & 2032
- Figure 61: Asia Pacific Vein Illuminator Industry Revenue Share (%), by Country 2024 & 2032
- Figure 62: Asia Pacific Vein Illuminator Industry Volume Share (%), by Country 2024 & 2032
- Figure 63: Latin America Vein Illuminator Industry Revenue (Million), by Application 2024 & 2032
- Figure 64: Latin America Vein Illuminator Industry Volume (K Unit), by Application 2024 & 2032
- Figure 65: Latin America Vein Illuminator Industry Revenue Share (%), by Application 2024 & 2032
- Figure 66: Latin America Vein Illuminator Industry Volume Share (%), by Application 2024 & 2032
- Figure 67: Latin America Vein Illuminator Industry Revenue (Million), by End User 2024 & 2032
- Figure 68: Latin America Vein Illuminator Industry Volume (K Unit), by End User 2024 & 2032
- Figure 69: Latin America Vein Illuminator Industry Revenue Share (%), by End User 2024 & 2032
- Figure 70: Latin America Vein Illuminator Industry Volume Share (%), by End User 2024 & 2032
- Figure 71: Latin America Vein Illuminator Industry Revenue (Million), by Country 2024 & 2032
- Figure 72: Latin America Vein Illuminator Industry Volume (K Unit), by Country 2024 & 2032
- Figure 73: Latin America Vein Illuminator Industry Revenue Share (%), by Country 2024 & 2032
- Figure 74: Latin America Vein Illuminator Industry Volume Share (%), by Country 2024 & 2032
- Figure 75: Middle East Vein Illuminator Industry Revenue (Million), by Application 2024 & 2032
- Figure 76: Middle East Vein Illuminator Industry Volume (K Unit), by Application 2024 & 2032
- Figure 77: Middle East Vein Illuminator Industry Revenue Share (%), by Application 2024 & 2032
- Figure 78: Middle East Vein Illuminator Industry Volume Share (%), by Application 2024 & 2032
- Figure 79: Middle East Vein Illuminator Industry Revenue (Million), by End User 2024 & 2032
- Figure 80: Middle East Vein Illuminator Industry Volume (K Unit), by End User 2024 & 2032
- Figure 81: Middle East Vein Illuminator Industry Revenue Share (%), by End User 2024 & 2032
- Figure 82: Middle East Vein Illuminator Industry Volume Share (%), by End User 2024 & 2032
- Figure 83: Middle East Vein Illuminator Industry Revenue (Million), by Country 2024 & 2032
- Figure 84: Middle East Vein Illuminator Industry Volume (K Unit), by Country 2024 & 2032
- Figure 85: Middle East Vein Illuminator Industry Revenue Share (%), by Country 2024 & 2032
- Figure 86: Middle East Vein Illuminator Industry Volume Share (%), by Country 2024 & 2032
List of Tables
- Table 1: Global Vein Illuminator Industry Revenue Million Forecast, by Region 2019 & 2032
- Table 2: Global Vein Illuminator Industry Volume K Unit Forecast, by Region 2019 & 2032
- Table 3: Global Vein Illuminator Industry Revenue Million Forecast, by Application 2019 & 2032
- Table 4: Global Vein Illuminator Industry Volume K Unit Forecast, by Application 2019 & 2032
- Table 5: Global Vein Illuminator Industry Revenue Million Forecast, by End User 2019 & 2032
- Table 6: Global Vein Illuminator Industry Volume K Unit Forecast, by End User 2019 & 2032
- Table 7: Global Vein Illuminator Industry Revenue Million Forecast, by Region 2019 & 2032
- Table 8: Global Vein Illuminator Industry Volume K Unit Forecast, by Region 2019 & 2032
- Table 9: Global Vein Illuminator Industry Revenue Million Forecast, by Country 2019 & 2032
- Table 10: Global Vein Illuminator Industry Volume K Unit Forecast, by Country 2019 & 2032
- Table 11: United States Vein Illuminator Industry Revenue (Million) Forecast, by Application 2019 & 2032
- Table 12: United States Vein Illuminator Industry Volume (K Unit) Forecast, by Application 2019 & 2032
- Table 13: Canada Vein Illuminator Industry Revenue (Million) Forecast, by Application 2019 & 2032
- Table 14: Canada Vein Illuminator Industry Volume (K Unit) Forecast, by Application 2019 & 2032
- Table 15: Mexico Vein Illuminator Industry Revenue (Million) Forecast, by Application 2019 & 2032
- Table 16: Mexico Vein Illuminator Industry Volume (K Unit) Forecast, by Application 2019 & 2032
- Table 17: Global Vein Illuminator Industry Revenue Million Forecast, by Country 2019 & 2032
- Table 18: Global Vein Illuminator Industry Volume K Unit Forecast, by Country 2019 & 2032
- Table 19: Germany Vein Illuminator Industry Revenue (Million) Forecast, by Application 2019 & 2032
- Table 20: Germany Vein Illuminator Industry Volume (K Unit) Forecast, by Application 2019 & 2032
- Table 21: United Kingdom Vein Illuminator Industry Revenue (Million) Forecast, by Application 2019 & 2032
- Table 22: United Kingdom Vein Illuminator Industry Volume (K Unit) Forecast, by Application 2019 & 2032
- Table 23: France Vein Illuminator Industry Revenue (Million) Forecast, by Application 2019 & 2032
- Table 24: France Vein Illuminator Industry Volume (K Unit) Forecast, by Application 2019 & 2032
- Table 25: Spain Vein Illuminator Industry Revenue (Million) Forecast, by Application 2019 & 2032
- Table 26: Spain Vein Illuminator Industry Volume (K Unit) Forecast, by Application 2019 & 2032
- Table 27: Italy Vein Illuminator Industry Revenue (Million) Forecast, by Application 2019 & 2032
- Table 28: Italy Vein Illuminator Industry Volume (K Unit) Forecast, by Application 2019 & 2032
- Table 29: Spain Vein Illuminator Industry Revenue (Million) Forecast, by Application 2019 & 2032
- Table 30: Spain Vein Illuminator Industry Volume (K Unit) Forecast, by Application 2019 & 2032
- Table 31: Belgium Vein Illuminator Industry Revenue (Million) Forecast, by Application 2019 & 2032
- Table 32: Belgium Vein Illuminator Industry Volume (K Unit) Forecast, by Application 2019 & 2032
- Table 33: Netherland Vein Illuminator Industry Revenue (Million) Forecast, by Application 2019 & 2032
- Table 34: Netherland Vein Illuminator Industry Volume (K Unit) Forecast, by Application 2019 & 2032
- Table 35: Nordics Vein Illuminator Industry Revenue (Million) Forecast, by Application 2019 & 2032
- Table 36: Nordics Vein Illuminator Industry Volume (K Unit) Forecast, by Application 2019 & 2032
- Table 37: Rest of Europe Vein Illuminator Industry Revenue (Million) Forecast, by Application 2019 & 2032
- Table 38: Rest of Europe Vein Illuminator Industry Volume (K Unit) Forecast, by Application 2019 & 2032
- Table 39: Global Vein Illuminator Industry Revenue Million Forecast, by Country 2019 & 2032
- Table 40: Global Vein Illuminator Industry Volume K Unit Forecast, by Country 2019 & 2032
- Table 41: China Vein Illuminator Industry Revenue (Million) Forecast, by Application 2019 & 2032
- Table 42: China Vein Illuminator Industry Volume (K Unit) Forecast, by Application 2019 & 2032
- Table 43: Japan Vein Illuminator Industry Revenue (Million) Forecast, by Application 2019 & 2032
- Table 44: Japan Vein Illuminator Industry Volume (K Unit) Forecast, by Application 2019 & 2032
- Table 45: India Vein Illuminator Industry Revenue (Million) Forecast, by Application 2019 & 2032
- Table 46: India Vein Illuminator Industry Volume (K Unit) Forecast, by Application 2019 & 2032
- Table 47: South Korea Vein Illuminator Industry Revenue (Million) Forecast, by Application 2019 & 2032
- Table 48: South Korea Vein Illuminator Industry Volume (K Unit) Forecast, by Application 2019 & 2032
- Table 49: Southeast Asia Vein Illuminator Industry Revenue (Million) Forecast, by Application 2019 & 2032
- Table 50: Southeast Asia Vein Illuminator Industry Volume (K Unit) Forecast, by Application 2019 & 2032
- Table 51: Australia Vein Illuminator Industry Revenue (Million) Forecast, by Application 2019 & 2032
- Table 52: Australia Vein Illuminator Industry Volume (K Unit) Forecast, by Application 2019 & 2032
- Table 53: Indonesia Vein Illuminator Industry Revenue (Million) Forecast, by Application 2019 & 2032
- Table 54: Indonesia Vein Illuminator Industry Volume (K Unit) Forecast, by Application 2019 & 2032
- Table 55: Phillipes Vein Illuminator Industry Revenue (Million) Forecast, by Application 2019 & 2032
- Table 56: Phillipes Vein Illuminator Industry Volume (K Unit) Forecast, by Application 2019 & 2032
- Table 57: Singapore Vein Illuminator Industry Revenue (Million) Forecast, by Application 2019 & 2032
- Table 58: Singapore Vein Illuminator Industry Volume (K Unit) Forecast, by Application 2019 & 2032
- Table 59: Thailandc Vein Illuminator Industry Revenue (Million) Forecast, by Application 2019 & 2032
- Table 60: Thailandc Vein Illuminator Industry Volume (K Unit) Forecast, by Application 2019 & 2032
- Table 61: Rest of Asia Pacific Vein Illuminator Industry Revenue (Million) Forecast, by Application 2019 & 2032
- Table 62: Rest of Asia Pacific Vein Illuminator Industry Volume (K Unit) Forecast, by Application 2019 & 2032
- Table 63: Global Vein Illuminator Industry Revenue Million Forecast, by Country 2019 & 2032
- Table 64: Global Vein Illuminator Industry Volume K Unit Forecast, by Country 2019 & 2032
- Table 65: Brazil Vein Illuminator Industry Revenue (Million) Forecast, by Application 2019 & 2032
- Table 66: Brazil Vein Illuminator Industry Volume (K Unit) Forecast, by Application 2019 & 2032
- Table 67: Argentina Vein Illuminator Industry Revenue (Million) Forecast, by Application 2019 & 2032
- Table 68: Argentina Vein Illuminator Industry Volume (K Unit) Forecast, by Application 2019 & 2032
- Table 69: Peru Vein Illuminator Industry Revenue (Million) Forecast, by Application 2019 & 2032
- Table 70: Peru Vein Illuminator Industry Volume (K Unit) Forecast, by Application 2019 & 2032
- Table 71: Chile Vein Illuminator Industry Revenue (Million) Forecast, by Application 2019 & 2032
- Table 72: Chile Vein Illuminator Industry Volume (K Unit) Forecast, by Application 2019 & 2032
- Table 73: Colombia Vein Illuminator Industry Revenue (Million) Forecast, by Application 2019 & 2032
- Table 74: Colombia Vein Illuminator Industry Volume (K Unit) Forecast, by Application 2019 & 2032
- Table 75: Ecuador Vein Illuminator Industry Revenue (Million) Forecast, by Application 2019 & 2032
- Table 76: Ecuador Vein Illuminator Industry Volume (K Unit) Forecast, by Application 2019 & 2032
- Table 77: Venezuela Vein Illuminator Industry Revenue (Million) Forecast, by Application 2019 & 2032
- Table 78: Venezuela Vein Illuminator Industry Volume (K Unit) Forecast, by Application 2019 & 2032
- Table 79: Rest of South America Vein Illuminator Industry Revenue (Million) Forecast, by Application 2019 & 2032
- Table 80: Rest of South America Vein Illuminator Industry Volume (K Unit) Forecast, by Application 2019 & 2032
- Table 81: Global Vein Illuminator Industry Revenue Million Forecast, by Country 2019 & 2032
- Table 82: Global Vein Illuminator Industry Volume K Unit Forecast, by Country 2019 & 2032
- Table 83: United States Vein Illuminator Industry Revenue (Million) Forecast, by Application 2019 & 2032
- Table 84: United States Vein Illuminator Industry Volume (K Unit) Forecast, by Application 2019 & 2032
- Table 85: Canada Vein Illuminator Industry Revenue (Million) Forecast, by Application 2019 & 2032
- Table 86: Canada Vein Illuminator Industry Volume (K Unit) Forecast, by Application 2019 & 2032
- Table 87: Mexico Vein Illuminator Industry Revenue (Million) Forecast, by Application 2019 & 2032
- Table 88: Mexico Vein Illuminator Industry Volume (K Unit) Forecast, by Application 2019 & 2032
- Table 89: Global Vein Illuminator Industry Revenue Million Forecast, by Country 2019 & 2032
- Table 90: Global Vein Illuminator Industry Volume K Unit Forecast, by Country 2019 & 2032
- Table 91: United Arab Emirates Vein Illuminator Industry Revenue (Million) Forecast, by Application 2019 & 2032
- Table 92: United Arab Emirates Vein Illuminator Industry Volume (K Unit) Forecast, by Application 2019 & 2032
- Table 93: Saudi Arabia Vein Illuminator Industry Revenue (Million) Forecast, by Application 2019 & 2032
- Table 94: Saudi Arabia Vein Illuminator Industry Volume (K Unit) Forecast, by Application 2019 & 2032
- Table 95: South Africa Vein Illuminator Industry Revenue (Million) Forecast, by Application 2019 & 2032
- Table 96: South Africa Vein Illuminator Industry Volume (K Unit) Forecast, by Application 2019 & 2032
- Table 97: Rest of Middle East and Africa Vein Illuminator Industry Revenue (Million) Forecast, by Application 2019 & 2032
- Table 98: Rest of Middle East and Africa Vein Illuminator Industry Volume (K Unit) Forecast, by Application 2019 & 2032
- Table 99: Global Vein Illuminator Industry Revenue Million Forecast, by Application 2019 & 2032
- Table 100: Global Vein Illuminator Industry Volume K Unit Forecast, by Application 2019 & 2032
- Table 101: Global Vein Illuminator Industry Revenue Million Forecast, by End User 2019 & 2032
- Table 102: Global Vein Illuminator Industry Volume K Unit Forecast, by End User 2019 & 2032
- Table 103: Global Vein Illuminator Industry Revenue Million Forecast, by Country 2019 & 2032
- Table 104: Global Vein Illuminator Industry Volume K Unit Forecast, by Country 2019 & 2032
- Table 105: Global Vein Illuminator Industry Revenue Million Forecast, by Application 2019 & 2032
- Table 106: Global Vein Illuminator Industry Volume K Unit Forecast, by Application 2019 & 2032
- Table 107: Global Vein Illuminator Industry Revenue Million Forecast, by End User 2019 & 2032
- Table 108: Global Vein Illuminator Industry Volume K Unit Forecast, by End User 2019 & 2032
- Table 109: Global Vein Illuminator Industry Revenue Million Forecast, by Country 2019 & 2032
- Table 110: Global Vein Illuminator Industry Volume K Unit Forecast, by Country 2019 & 2032
- Table 111: Global Vein Illuminator Industry Revenue Million Forecast, by Application 2019 & 2032
- Table 112: Global Vein Illuminator Industry Volume K Unit Forecast, by Application 2019 & 2032
- Table 113: Global Vein Illuminator Industry Revenue Million Forecast, by End User 2019 & 2032
- Table 114: Global Vein Illuminator Industry Volume K Unit Forecast, by End User 2019 & 2032
- Table 115: Global Vein Illuminator Industry Revenue Million Forecast, by Country 2019 & 2032
- Table 116: Global Vein Illuminator Industry Volume K Unit Forecast, by Country 2019 & 2032
- Table 117: Global Vein Illuminator Industry Revenue Million Forecast, by Application 2019 & 2032
- Table 118: Global Vein Illuminator Industry Volume K Unit Forecast, by Application 2019 & 2032
- Table 119: Global Vein Illuminator Industry Revenue Million Forecast, by End User 2019 & 2032
- Table 120: Global Vein Illuminator Industry Volume K Unit Forecast, by End User 2019 & 2032
- Table 121: Global Vein Illuminator Industry Revenue Million Forecast, by Country 2019 & 2032
- Table 122: Global Vein Illuminator Industry Volume K Unit Forecast, by Country 2019 & 2032
- Table 123: Global Vein Illuminator Industry Revenue Million Forecast, by Application 2019 & 2032
- Table 124: Global Vein Illuminator Industry Volume K Unit Forecast, by Application 2019 & 2032
- Table 125: Global Vein Illuminator Industry Revenue Million Forecast, by End User 2019 & 2032
- Table 126: Global Vein Illuminator Industry Volume K Unit Forecast, by End User 2019 & 2032
- Table 127: Global Vein Illuminator Industry Revenue Million Forecast, by Country 2019 & 2032
- Table 128: Global Vein Illuminator Industry Volume K Unit Forecast, by Country 2019 & 2032
Frequently Asked Questions
1. What is the projected Compound Annual Growth Rate (CAGR) of the Vein Illuminator Industry?
The projected CAGR is approximately 22.77%.
2. Which companies are prominent players in the Vein Illuminator Industry?
Key companies in the market include Cambridge Medical (Asia) Private Ltd, Christie Medical Holdings Inc, Zd Medical Inc, Venoscope LLC, TransLite LLC, VueTek Scientific LLC, AccuVein Inc, Sharn Anesthesia, Near Infrared Imaging Inc.
3. What are the main segments of the Vein Illuminator Industry?
The market segments include Application, End User.
4. Can you provide details about the market size?
The market size is estimated to be USD 339.29 Million as of 2022.
5. What are some drivers contributing to market growth?
; Increased Success Rate of Blood Draw at First Attempt; Increased Patient Satisfaction.
6. What are the notable trends driving market growth?
Growing Healthcare Spending and Equipment Market Expected to Drive the Market.
7. Are there any restraints impacting market growth?
; Higher Costs.
8. Can you provide examples of recent developments in the market?
N/A
9. What pricing options are available for accessing the report?
Pricing options include single-user, multi-user, and enterprise licenses priced at USD 4750, USD 5250, and USD 8750 respectively.
10. Is the market size provided in terms of value or volume?
The market size is provided in terms of value, measured in Million and volume, measured in K Unit.
11. Are there any specific market keywords associated with the report?
Yes, the market keyword associated with the report is "Vein Illuminator Industry," which aids in identifying and referencing the specific market segment covered.
12. How do I determine which pricing option suits my needs best?
The pricing options vary based on user requirements and access needs. Individual users may opt for single-user licenses, while businesses requiring broader access may choose multi-user or enterprise licenses for cost-effective access to the report.
13. Are there any additional resources or data provided in the Vein Illuminator Industry report?
While the report offers comprehensive insights, it's advisable to review the specific contents or supplementary materials provided to ascertain if additional resources or data are available.
14. How can I stay updated on further developments or reports in the Vein Illuminator Industry?
To stay informed about further developments, trends, and reports in the Vein Illuminator Industry, consider subscribing to industry newsletters, following relevant companies and organizations, or regularly checking reputable industry news sources and publications.
Methodology
Step 1 - Identification of Relevant Samples Size from Population Database


Step 2 - Approaches for Defining Global Market Size (Value, Volume* & Price*)

Note*: In applicable scenarios
Step 3 - Data Sources
Primary Research
- Web Analytics
- Survey Reports
- Research Institute
- Latest Research Reports
- Opinion Leaders
Secondary Research
- Annual Reports
- White Paper
- Latest Press Release
- Industry Association
- Paid Database
- Investor Presentations

Step 4 - Data Triangulation
Involves using different sources of information in order to increase the validity of a study
These sources are likely to be stakeholders in a program - participants, other researchers, program staff, other community members, and so on.
Then we put all data in single framework & apply various statistical tools to find out the dynamic on the market.
During the analysis stage, feedback from the stakeholder groups would be compared to determine areas of agreement as well as areas of divergence
