

Key Insights
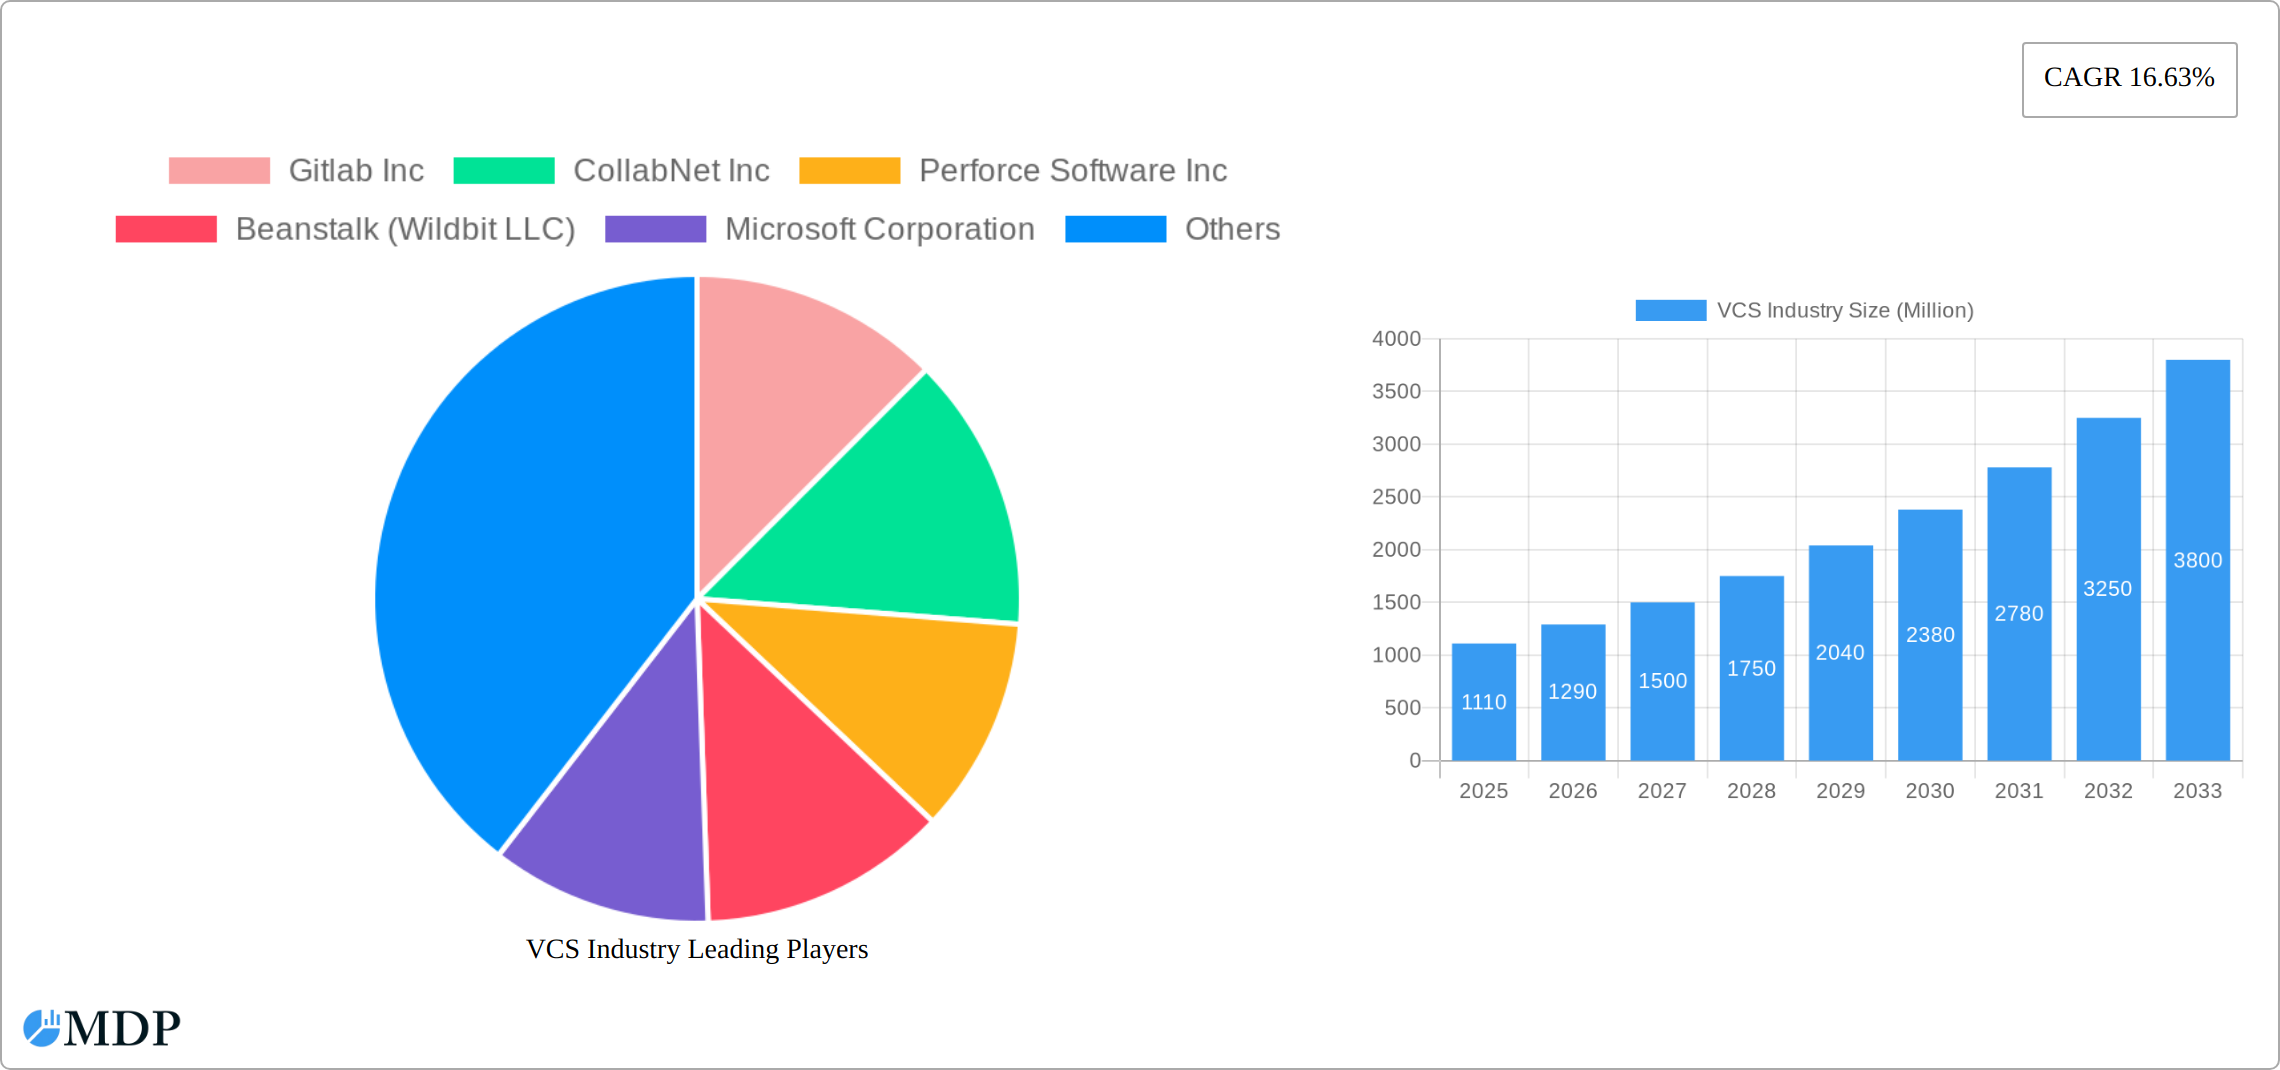
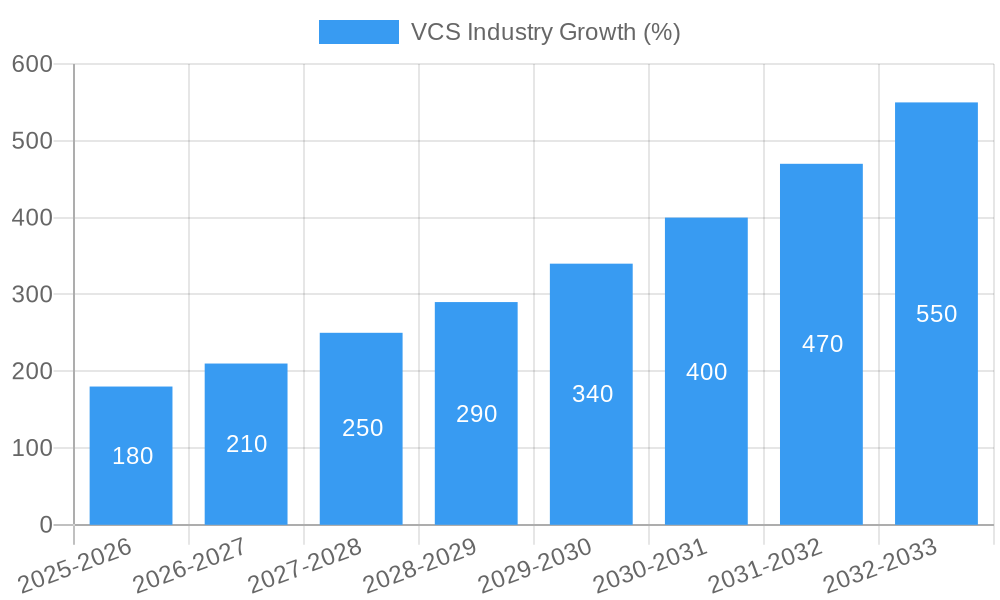
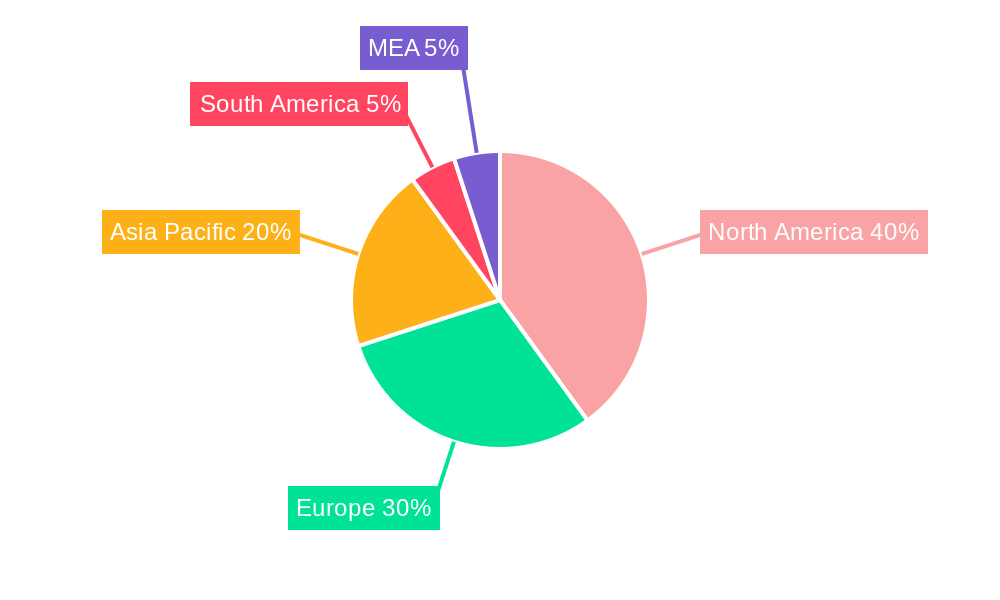
The Version Control System (VCS) market is experiencing robust growth, projected to reach $1.11 billion in 2025 and maintain a Compound Annual Growth Rate (CAGR) of 16.63% from 2025 to 2033. This expansion is fueled by several key factors. The increasing adoption of DevOps methodologies and Agile development practices necessitates efficient version control for collaborative software development. The rise of cloud computing further accelerates this trend, with cloud-based VCS solutions offering scalability, accessibility, and cost-effectiveness. Growth is also driven by the expanding need for secure and reliable data management across diverse industries, including IT and Telecom, Retail & E-commerce, Healthcare and Life Sciences, and BFSI (Banking, Financial Services, and Insurance). The shift towards remote work and geographically distributed teams further underscores the importance of robust VCS solutions enabling seamless collaboration irrespective of location. Competitive landscape is characterized by a mix of established players like GitLab, Atlassian (Bitbucket), Microsoft, and newer entrants continuously innovating with enhanced features and integrations. The market is segmented by VCS type (Distributed and Centralized), deployment mode (On-Premise and On-Cloud), and end-user industry, reflecting the varied needs of different sectors. While the North American market currently holds a significant share, strong growth is anticipated from regions like Asia-Pacific, driven by increasing digitalization and technological advancements.
The sustained growth trajectory of the VCS market is expected to continue, albeit potentially at a slightly moderated pace in the later years of the forecast period due to market saturation in certain segments. However, the emergence of new technologies such as AI-powered code analysis and automated testing integrated within VCS platforms will likely fuel innovation and expand the addressable market. The increasing complexity of software development projects, coupled with the demand for faster time-to-market, will necessitate advanced features in VCS solutions, fostering ongoing market expansion. Companies are likely to focus on providing integrated solutions that encompass not only version control but also other DevOps tools for a more comprehensive offering. The competitive landscape will remain dynamic, with ongoing mergers, acquisitions, and strategic partnerships shaping the market structure.
VCS Industry Market Report: 2019-2033
This comprehensive report provides a detailed analysis of the Version Control System (VCS) industry, projecting a market valuation exceeding $XX Million by 2033. Leveraging a robust methodology and incorporating data from the historical period (2019-2024), base year (2025), and forecast period (2025-2033), this report offers invaluable insights for industry stakeholders, investors, and businesses seeking to navigate this dynamic market. Key players like Gitlab Inc, CollabNet Inc, Perforce Software Inc, Beanstalk (Wildbit LLC), Microsoft Corporation, Bitbucket (Atlassian Corporation Plc), Amazon Web Services Inc, Apache Software Foundation, Github Inc, and Dynamsoft Corporation are analyzed in detail.
VCS Industry Market Dynamics & Concentration
The VCS market exhibits a moderately concentrated landscape, with a few major players holding significant market share. While precise figures for individual market shares are proprietary, Gitlab, Github, and Bitbucket are considered amongst the leading players, cumulatively holding an estimated xx% market share in 2025. The market's dynamics are driven by continuous innovation in VCS technologies, including the rise of distributed VCS (DVCS) and cloud-based deployment models. Regulatory frameworks surrounding data privacy and security significantly influence market operations, especially in sectors like BFSI and Healthcare. The emergence of alternative collaboration platforms, while posing some substitution threat, often integrates with VCS solutions, limiting their direct competitive impact. M&A activity has been relatively moderate in recent years, with an estimated xx M&A deals in the historical period, primarily focused on consolidating smaller players or expanding into complementary technologies. End-user trends favour integrated solutions that streamline workflows and enhance collaboration across distributed teams.
- Market Concentration: Moderately concentrated with top players holding an estimated xx% market share in 2025.
- Innovation Drivers: Development of cloud-based VCS, AI-powered code analysis, and enhanced collaboration tools.
- Regulatory Frameworks: Data privacy regulations (GDPR, CCPA) and industry-specific compliance standards influence adoption.
- Product Substitutes: Limited direct substitutes; integration with alternative collaboration platforms is more common.
- M&A Activity: An estimated xx M&A deals in 2019-2024, focused on consolidation and technology expansion.
VCS Industry Trends & Analysis
The VCS market demonstrates robust growth, driven by the increasing adoption of agile development methodologies, the expansion of remote work environments, and the growing complexity of software development projects. The market is experiencing a Compound Annual Growth Rate (CAGR) of xx% during the forecast period (2025-2033). Technological disruptions, such as the increased adoption of AI-powered code analysis and automation tools, are fundamentally altering development workflows. This trend is further amplified by evolving consumer preferences for user-friendly, feature-rich platforms, pushing vendors to continuously improve their offerings. The competitive landscape is characterized by intense innovation and strategic partnerships, with companies focusing on integrating their VCS solutions with other development tools and platforms to create comprehensive ecosystems. Market penetration is highest in the IT and Telecom sector, but significant growth is projected in other sectors like BFSI and Healthcare.
Leading Markets & Segments in VCS Industry
The North American region currently dominates the VCS market, primarily driven by the high concentration of technology companies and a strong emphasis on agile development. However, APAC is poised for significant growth due to its rapidly expanding tech industry and increasing adoption of cloud-based solutions.
Dominant Segments:
- End-user Industry: IT and Telecom consistently leads, followed by Retail & E-commerce and BFSI showing rapid growth.
- Type: Distributed VCS is experiencing more rapid growth than Centralized VCS due to flexibility demands.
- Deployment Mode: On-Cloud deployment is dominating, driven by scalability and cost-effectiveness.
Key Drivers:
- Economic Policies: Government initiatives promoting digital transformation and technological innovation.
- Infrastructure: Robust internet infrastructure and cloud computing capabilities.
VCS Industry Product Developments
Recent product developments focus on enhanced collaboration features, AI-powered code review tools, and improved integration with other development tools. This reflects a market trend towards streamlined workflows and increased developer productivity. The competitive advantage lies in offering robust, scalable, and user-friendly platforms with strong security and compliance features. Integration with CI/CD pipelines and DevOps platforms is another critical factor driving product innovation.
Key Drivers of VCS Industry Growth
The VCS industry's growth is fueled by several factors: the rising adoption of agile development methodologies, the increasing demand for efficient collaboration tools among distributed teams, the expansion of cloud-based development environments, and growing awareness of the importance of robust version control for software development projects. Technological advancements, such as AI-powered code analysis and automation tools, further enhance productivity and efficiency, driving adoption.
Challenges in the VCS Industry Market
The VCS industry faces challenges such as the need for robust security and compliance features, especially given increasing data privacy concerns. Integration complexities with legacy systems can hinder adoption, while intense competition among vendors requires continuous innovation and investment. These factors can significantly impact profitability and market share for individual companies.
Emerging Opportunities in VCS Industry
Emerging opportunities include the integration of VCS with AI-powered tools for improved code quality, the expansion of VCS into new sectors like IoT and embedded systems, and the potential for strategic partnerships to create comprehensive development platforms. These advancements will unlock significant growth potential in the coming years.
Leading Players in the VCS Industry Sector
- Gitlab Inc
- CollabNet Inc
- Perforce Software Inc
- Beanstalk (Wildbit LLC)
- Microsoft Corporation
- Bitbucket (Atlassian Corporation Plc)
- Amazon Web Services Inc
- Apache Software Foundation
- Github Inc
- Dynamsoft Corporation
Key Milestones in VCS Industry Industry
- September 2023: Accenture and Workday's expanded partnership focuses on agile finance solutions, impacting the software and technology, retail, and media industries' VCS needs.
- December 2022: Microsoft's Git integration for canvas apps significantly improves collaboration in distributed development environments.
- September 2022: WebKit's migration to GitHub highlights the platform's growing dominance and the advantages of its community and automation features.
Strategic Outlook for VCS Industry Market
The VCS market exhibits strong growth potential, driven by technological advancements, expanding adoption across various sectors, and a growing focus on seamless collaboration. Strategic opportunities lie in developing AI-powered features, enhancing integration capabilities, and expanding into emerging markets. Companies prioritizing innovation and strategic partnerships will be best positioned to capitalize on this growth.
VCS Industry Segmentation
-
1. Deployment Mode
- 1.1. On-Premise
- 1.2. On-Cloud
-
2. End-user Industry
- 2.1. IT and Telecom
- 2.2. Retail & E-commerce
- 2.3. Healthcare and Life Sciences
- 2.4. BFSI
- 2.5. Other
-
3. Type
- 3.1. Distributed VCS
- 3.2. Centralized VCS
VCS Industry Segmentation By Geography
- 1. North America
- 2. Europe
- 3. Asia Pacific
- 4. Latin America
- 5. Middle East and Africa
VCS Industry REPORT HIGHLIGHTS
| Aspects | Details |
|---|---|
| Study Period | 2019-2033 |
| Base Year | 2024 |
| Estimated Year | 2025 |
| Forecast Period | 2025-2033 |
| Historical Period | 2019-2024 |
| Growth Rate | CAGR of 16.63% from 2019-2033 |
| Segmentation |
|
Table of Contents
- 1. Introduction
- 1.1. Research Scope
- 1.2. Market Segmentation
- 1.3. Research Methodology
- 1.4. Definitions and Assumptions
- 2. Executive Summary
- 2.1. Introduction
- 3. Market Dynamics
- 3.1. Introduction
- 3.2. Market Drivers
- 3.2.1. Digitization of Business Processes Leading to Adoption of Software; Increasing Demand for Reduced Complexities in Software Development and Cost Optimization
- 3.3. Market Restrains
- 3.3.1. Use of Diversified Software Applications in Organizations; Growing Complexity Due to Massive Data Generation
- 3.4. Market Trends
- 3.4.1. BFSI Industry Expected to Hold Significant Share
- 4. Market Factor Analysis
- 4.1. Porters Five Forces
- 4.2. Supply/Value Chain
- 4.3. PESTEL analysis
- 4.4. Market Entropy
- 4.5. Patent/Trademark Analysis
- 5. Global VCS Industry Analysis, Insights and Forecast, 2019-2031
- 5.1. Market Analysis, Insights and Forecast - by Deployment Mode
- 5.1.1. On-Premise
- 5.1.2. On-Cloud
- 5.2. Market Analysis, Insights and Forecast - by End-user Industry
- 5.2.1. IT and Telecom
- 5.2.2. Retail & E-commerce
- 5.2.3. Healthcare and Life Sciences
- 5.2.4. BFSI
- 5.2.5. Other
- 5.3. Market Analysis, Insights and Forecast - by Type
- 5.3.1. Distributed VCS
- 5.3.2. Centralized VCS
- 5.4. Market Analysis, Insights and Forecast - by Region
- 5.4.1. North America
- 5.4.2. Europe
- 5.4.3. Asia Pacific
- 5.4.4. Latin America
- 5.4.5. Middle East and Africa
- 5.1. Market Analysis, Insights and Forecast - by Deployment Mode
- 6. North America VCS Industry Analysis, Insights and Forecast, 2019-2031
- 6.1. Market Analysis, Insights and Forecast - by Deployment Mode
- 6.1.1. On-Premise
- 6.1.2. On-Cloud
- 6.2. Market Analysis, Insights and Forecast - by End-user Industry
- 6.2.1. IT and Telecom
- 6.2.2. Retail & E-commerce
- 6.2.3. Healthcare and Life Sciences
- 6.2.4. BFSI
- 6.2.5. Other
- 6.3. Market Analysis, Insights and Forecast - by Type
- 6.3.1. Distributed VCS
- 6.3.2. Centralized VCS
- 6.1. Market Analysis, Insights and Forecast - by Deployment Mode
- 7. Europe VCS Industry Analysis, Insights and Forecast, 2019-2031
- 7.1. Market Analysis, Insights and Forecast - by Deployment Mode
- 7.1.1. On-Premise
- 7.1.2. On-Cloud
- 7.2. Market Analysis, Insights and Forecast - by End-user Industry
- 7.2.1. IT and Telecom
- 7.2.2. Retail & E-commerce
- 7.2.3. Healthcare and Life Sciences
- 7.2.4. BFSI
- 7.2.5. Other
- 7.3. Market Analysis, Insights and Forecast - by Type
- 7.3.1. Distributed VCS
- 7.3.2. Centralized VCS
- 7.1. Market Analysis, Insights and Forecast - by Deployment Mode
- 8. Asia Pacific VCS Industry Analysis, Insights and Forecast, 2019-2031
- 8.1. Market Analysis, Insights and Forecast - by Deployment Mode
- 8.1.1. On-Premise
- 8.1.2. On-Cloud
- 8.2. Market Analysis, Insights and Forecast - by End-user Industry
- 8.2.1. IT and Telecom
- 8.2.2. Retail & E-commerce
- 8.2.3. Healthcare and Life Sciences
- 8.2.4. BFSI
- 8.2.5. Other
- 8.3. Market Analysis, Insights and Forecast - by Type
- 8.3.1. Distributed VCS
- 8.3.2. Centralized VCS
- 8.1. Market Analysis, Insights and Forecast - by Deployment Mode
- 9. Latin America VCS Industry Analysis, Insights and Forecast, 2019-2031
- 9.1. Market Analysis, Insights and Forecast - by Deployment Mode
- 9.1.1. On-Premise
- 9.1.2. On-Cloud
- 9.2. Market Analysis, Insights and Forecast - by End-user Industry
- 9.2.1. IT and Telecom
- 9.2.2. Retail & E-commerce
- 9.2.3. Healthcare and Life Sciences
- 9.2.4. BFSI
- 9.2.5. Other
- 9.3. Market Analysis, Insights and Forecast - by Type
- 9.3.1. Distributed VCS
- 9.3.2. Centralized VCS
- 9.1. Market Analysis, Insights and Forecast - by Deployment Mode
- 10. Middle East and Africa VCS Industry Analysis, Insights and Forecast, 2019-2031
- 10.1. Market Analysis, Insights and Forecast - by Deployment Mode
- 10.1.1. On-Premise
- 10.1.2. On-Cloud
- 10.2. Market Analysis, Insights and Forecast - by End-user Industry
- 10.2.1. IT and Telecom
- 10.2.2. Retail & E-commerce
- 10.2.3. Healthcare and Life Sciences
- 10.2.4. BFSI
- 10.2.5. Other
- 10.3. Market Analysis, Insights and Forecast - by Type
- 10.3.1. Distributed VCS
- 10.3.2. Centralized VCS
- 10.1. Market Analysis, Insights and Forecast - by Deployment Mode
- 11. North America VCS Industry Analysis, Insights and Forecast, 2019-2031
- 11.1. Market Analysis, Insights and Forecast - By Country/Sub-region
- 11.1.1 United States
- 11.1.2 Canada
- 11.1.3 Mexico
- 12. Europe VCS Industry Analysis, Insights and Forecast, 2019-2031
- 12.1. Market Analysis, Insights and Forecast - By Country/Sub-region
- 12.1.1 Germany
- 12.1.2 United Kingdom
- 12.1.3 France
- 12.1.4 Spain
- 12.1.5 Italy
- 12.1.6 Spain
- 12.1.7 Belgium
- 12.1.8 Netherland
- 12.1.9 Nordics
- 12.1.10 Rest of Europe
- 13. Asia Pacific VCS Industry Analysis, Insights and Forecast, 2019-2031
- 13.1. Market Analysis, Insights and Forecast - By Country/Sub-region
- 13.1.1 China
- 13.1.2 Japan
- 13.1.3 India
- 13.1.4 South Korea
- 13.1.5 Southeast Asia
- 13.1.6 Australia
- 13.1.7 Indonesia
- 13.1.8 Phillipes
- 13.1.9 Singapore
- 13.1.10 Thailandc
- 13.1.11 Rest of Asia Pacific
- 14. South America VCS Industry Analysis, Insights and Forecast, 2019-2031
- 14.1. Market Analysis, Insights and Forecast - By Country/Sub-region
- 14.1.1 Brazil
- 14.1.2 Argentina
- 14.1.3 Peru
- 14.1.4 Chile
- 14.1.5 Colombia
- 14.1.6 Ecuador
- 14.1.7 Venezuela
- 14.1.8 Rest of South America
- 15. North America VCS Industry Analysis, Insights and Forecast, 2019-2031
- 15.1. Market Analysis, Insights and Forecast - By Country/Sub-region
- 15.1.1 United States
- 15.1.2 Canada
- 15.1.3 Mexico
- 16. MEA VCS Industry Analysis, Insights and Forecast, 2019-2031
- 16.1. Market Analysis, Insights and Forecast - By Country/Sub-region
- 16.1.1 United Arab Emirates
- 16.1.2 Saudi Arabia
- 16.1.3 South Africa
- 16.1.4 Rest of Middle East and Africa
- 17. Competitive Analysis
- 17.1. Global Market Share Analysis 2024
- 17.2. Company Profiles
- 17.2.1 Gitlab Inc
- 17.2.1.1. Overview
- 17.2.1.2. Products
- 17.2.1.3. SWOT Analysis
- 17.2.1.4. Recent Developments
- 17.2.1.5. Financials (Based on Availability)
- 17.2.2 CollabNet Inc
- 17.2.2.1. Overview
- 17.2.2.2. Products
- 17.2.2.3. SWOT Analysis
- 17.2.2.4. Recent Developments
- 17.2.2.5. Financials (Based on Availability)
- 17.2.3 Perforce Software Inc
- 17.2.3.1. Overview
- 17.2.3.2. Products
- 17.2.3.3. SWOT Analysis
- 17.2.3.4. Recent Developments
- 17.2.3.5. Financials (Based on Availability)
- 17.2.4 Beanstalk (Wildbit LLC)
- 17.2.4.1. Overview
- 17.2.4.2. Products
- 17.2.4.3. SWOT Analysis
- 17.2.4.4. Recent Developments
- 17.2.4.5. Financials (Based on Availability)
- 17.2.5 Microsoft Corporation
- 17.2.5.1. Overview
- 17.2.5.2. Products
- 17.2.5.3. SWOT Analysis
- 17.2.5.4. Recent Developments
- 17.2.5.5. Financials (Based on Availability)
- 17.2.6 Bitbucket org (Atlassian Corporation Plc)
- 17.2.6.1. Overview
- 17.2.6.2. Products
- 17.2.6.3. SWOT Analysis
- 17.2.6.4. Recent Developments
- 17.2.6.5. Financials (Based on Availability)
- 17.2.7 Amazon Web Services Inc
- 17.2.7.1. Overview
- 17.2.7.2. Products
- 17.2.7.3. SWOT Analysis
- 17.2.7.4. Recent Developments
- 17.2.7.5. Financials (Based on Availability)
- 17.2.8 APAChe Software Foundation
- 17.2.8.1. Overview
- 17.2.8.2. Products
- 17.2.8.3. SWOT Analysis
- 17.2.8.4. Recent Developments
- 17.2.8.5. Financials (Based on Availability)
- 17.2.9 Github Inc
- 17.2.9.1. Overview
- 17.2.9.2. Products
- 17.2.9.3. SWOT Analysis
- 17.2.9.4. Recent Developments
- 17.2.9.5. Financials (Based on Availability)
- 17.2.10 Dynamsoft Corporatio
- 17.2.10.1. Overview
- 17.2.10.2. Products
- 17.2.10.3. SWOT Analysis
- 17.2.10.4. Recent Developments
- 17.2.10.5. Financials (Based on Availability)
- 17.2.1 Gitlab Inc
List of Figures
- Figure 1: Global VCS Industry Revenue Breakdown (Million, %) by Region 2024 & 2032
- Figure 2: North America VCS Industry Revenue (Million), by Country 2024 & 2032
- Figure 3: North America VCS Industry Revenue Share (%), by Country 2024 & 2032
- Figure 4: Europe VCS Industry Revenue (Million), by Country 2024 & 2032
- Figure 5: Europe VCS Industry Revenue Share (%), by Country 2024 & 2032
- Figure 6: Asia Pacific VCS Industry Revenue (Million), by Country 2024 & 2032
- Figure 7: Asia Pacific VCS Industry Revenue Share (%), by Country 2024 & 2032
- Figure 8: South America VCS Industry Revenue (Million), by Country 2024 & 2032
- Figure 9: South America VCS Industry Revenue Share (%), by Country 2024 & 2032
- Figure 10: North America VCS Industry Revenue (Million), by Country 2024 & 2032
- Figure 11: North America VCS Industry Revenue Share (%), by Country 2024 & 2032
- Figure 12: MEA VCS Industry Revenue (Million), by Country 2024 & 2032
- Figure 13: MEA VCS Industry Revenue Share (%), by Country 2024 & 2032
- Figure 14: North America VCS Industry Revenue (Million), by Deployment Mode 2024 & 2032
- Figure 15: North America VCS Industry Revenue Share (%), by Deployment Mode 2024 & 2032
- Figure 16: North America VCS Industry Revenue (Million), by End-user Industry 2024 & 2032
- Figure 17: North America VCS Industry Revenue Share (%), by End-user Industry 2024 & 2032
- Figure 18: North America VCS Industry Revenue (Million), by Type 2024 & 2032
- Figure 19: North America VCS Industry Revenue Share (%), by Type 2024 & 2032
- Figure 20: North America VCS Industry Revenue (Million), by Country 2024 & 2032
- Figure 21: North America VCS Industry Revenue Share (%), by Country 2024 & 2032
- Figure 22: Europe VCS Industry Revenue (Million), by Deployment Mode 2024 & 2032
- Figure 23: Europe VCS Industry Revenue Share (%), by Deployment Mode 2024 & 2032
- Figure 24: Europe VCS Industry Revenue (Million), by End-user Industry 2024 & 2032
- Figure 25: Europe VCS Industry Revenue Share (%), by End-user Industry 2024 & 2032
- Figure 26: Europe VCS Industry Revenue (Million), by Type 2024 & 2032
- Figure 27: Europe VCS Industry Revenue Share (%), by Type 2024 & 2032
- Figure 28: Europe VCS Industry Revenue (Million), by Country 2024 & 2032
- Figure 29: Europe VCS Industry Revenue Share (%), by Country 2024 & 2032
- Figure 30: Asia Pacific VCS Industry Revenue (Million), by Deployment Mode 2024 & 2032
- Figure 31: Asia Pacific VCS Industry Revenue Share (%), by Deployment Mode 2024 & 2032
- Figure 32: Asia Pacific VCS Industry Revenue (Million), by End-user Industry 2024 & 2032
- Figure 33: Asia Pacific VCS Industry Revenue Share (%), by End-user Industry 2024 & 2032
- Figure 34: Asia Pacific VCS Industry Revenue (Million), by Type 2024 & 2032
- Figure 35: Asia Pacific VCS Industry Revenue Share (%), by Type 2024 & 2032
- Figure 36: Asia Pacific VCS Industry Revenue (Million), by Country 2024 & 2032
- Figure 37: Asia Pacific VCS Industry Revenue Share (%), by Country 2024 & 2032
- Figure 38: Latin America VCS Industry Revenue (Million), by Deployment Mode 2024 & 2032
- Figure 39: Latin America VCS Industry Revenue Share (%), by Deployment Mode 2024 & 2032
- Figure 40: Latin America VCS Industry Revenue (Million), by End-user Industry 2024 & 2032
- Figure 41: Latin America VCS Industry Revenue Share (%), by End-user Industry 2024 & 2032
- Figure 42: Latin America VCS Industry Revenue (Million), by Type 2024 & 2032
- Figure 43: Latin America VCS Industry Revenue Share (%), by Type 2024 & 2032
- Figure 44: Latin America VCS Industry Revenue (Million), by Country 2024 & 2032
- Figure 45: Latin America VCS Industry Revenue Share (%), by Country 2024 & 2032
- Figure 46: Middle East and Africa VCS Industry Revenue (Million), by Deployment Mode 2024 & 2032
- Figure 47: Middle East and Africa VCS Industry Revenue Share (%), by Deployment Mode 2024 & 2032
- Figure 48: Middle East and Africa VCS Industry Revenue (Million), by End-user Industry 2024 & 2032
- Figure 49: Middle East and Africa VCS Industry Revenue Share (%), by End-user Industry 2024 & 2032
- Figure 50: Middle East and Africa VCS Industry Revenue (Million), by Type 2024 & 2032
- Figure 51: Middle East and Africa VCS Industry Revenue Share (%), by Type 2024 & 2032
- Figure 52: Middle East and Africa VCS Industry Revenue (Million), by Country 2024 & 2032
- Figure 53: Middle East and Africa VCS Industry Revenue Share (%), by Country 2024 & 2032
List of Tables
- Table 1: Global VCS Industry Revenue Million Forecast, by Region 2019 & 2032
- Table 2: Global VCS Industry Revenue Million Forecast, by Deployment Mode 2019 & 2032
- Table 3: Global VCS Industry Revenue Million Forecast, by End-user Industry 2019 & 2032
- Table 4: Global VCS Industry Revenue Million Forecast, by Type 2019 & 2032
- Table 5: Global VCS Industry Revenue Million Forecast, by Region 2019 & 2032
- Table 6: Global VCS Industry Revenue Million Forecast, by Country 2019 & 2032
- Table 7: United States VCS Industry Revenue (Million) Forecast, by Application 2019 & 2032
- Table 8: Canada VCS Industry Revenue (Million) Forecast, by Application 2019 & 2032
- Table 9: Mexico VCS Industry Revenue (Million) Forecast, by Application 2019 & 2032
- Table 10: Global VCS Industry Revenue Million Forecast, by Country 2019 & 2032
- Table 11: Germany VCS Industry Revenue (Million) Forecast, by Application 2019 & 2032
- Table 12: United Kingdom VCS Industry Revenue (Million) Forecast, by Application 2019 & 2032
- Table 13: France VCS Industry Revenue (Million) Forecast, by Application 2019 & 2032
- Table 14: Spain VCS Industry Revenue (Million) Forecast, by Application 2019 & 2032
- Table 15: Italy VCS Industry Revenue (Million) Forecast, by Application 2019 & 2032
- Table 16: Spain VCS Industry Revenue (Million) Forecast, by Application 2019 & 2032
- Table 17: Belgium VCS Industry Revenue (Million) Forecast, by Application 2019 & 2032
- Table 18: Netherland VCS Industry Revenue (Million) Forecast, by Application 2019 & 2032
- Table 19: Nordics VCS Industry Revenue (Million) Forecast, by Application 2019 & 2032
- Table 20: Rest of Europe VCS Industry Revenue (Million) Forecast, by Application 2019 & 2032
- Table 21: Global VCS Industry Revenue Million Forecast, by Country 2019 & 2032
- Table 22: China VCS Industry Revenue (Million) Forecast, by Application 2019 & 2032
- Table 23: Japan VCS Industry Revenue (Million) Forecast, by Application 2019 & 2032
- Table 24: India VCS Industry Revenue (Million) Forecast, by Application 2019 & 2032
- Table 25: South Korea VCS Industry Revenue (Million) Forecast, by Application 2019 & 2032
- Table 26: Southeast Asia VCS Industry Revenue (Million) Forecast, by Application 2019 & 2032
- Table 27: Australia VCS Industry Revenue (Million) Forecast, by Application 2019 & 2032
- Table 28: Indonesia VCS Industry Revenue (Million) Forecast, by Application 2019 & 2032
- Table 29: Phillipes VCS Industry Revenue (Million) Forecast, by Application 2019 & 2032
- Table 30: Singapore VCS Industry Revenue (Million) Forecast, by Application 2019 & 2032
- Table 31: Thailandc VCS Industry Revenue (Million) Forecast, by Application 2019 & 2032
- Table 32: Rest of Asia Pacific VCS Industry Revenue (Million) Forecast, by Application 2019 & 2032
- Table 33: Global VCS Industry Revenue Million Forecast, by Country 2019 & 2032
- Table 34: Brazil VCS Industry Revenue (Million) Forecast, by Application 2019 & 2032
- Table 35: Argentina VCS Industry Revenue (Million) Forecast, by Application 2019 & 2032
- Table 36: Peru VCS Industry Revenue (Million) Forecast, by Application 2019 & 2032
- Table 37: Chile VCS Industry Revenue (Million) Forecast, by Application 2019 & 2032
- Table 38: Colombia VCS Industry Revenue (Million) Forecast, by Application 2019 & 2032
- Table 39: Ecuador VCS Industry Revenue (Million) Forecast, by Application 2019 & 2032
- Table 40: Venezuela VCS Industry Revenue (Million) Forecast, by Application 2019 & 2032
- Table 41: Rest of South America VCS Industry Revenue (Million) Forecast, by Application 2019 & 2032
- Table 42: Global VCS Industry Revenue Million Forecast, by Country 2019 & 2032
- Table 43: United States VCS Industry Revenue (Million) Forecast, by Application 2019 & 2032
- Table 44: Canada VCS Industry Revenue (Million) Forecast, by Application 2019 & 2032
- Table 45: Mexico VCS Industry Revenue (Million) Forecast, by Application 2019 & 2032
- Table 46: Global VCS Industry Revenue Million Forecast, by Country 2019 & 2032
- Table 47: United Arab Emirates VCS Industry Revenue (Million) Forecast, by Application 2019 & 2032
- Table 48: Saudi Arabia VCS Industry Revenue (Million) Forecast, by Application 2019 & 2032
- Table 49: South Africa VCS Industry Revenue (Million) Forecast, by Application 2019 & 2032
- Table 50: Rest of Middle East and Africa VCS Industry Revenue (Million) Forecast, by Application 2019 & 2032
- Table 51: Global VCS Industry Revenue Million Forecast, by Deployment Mode 2019 & 2032
- Table 52: Global VCS Industry Revenue Million Forecast, by End-user Industry 2019 & 2032
- Table 53: Global VCS Industry Revenue Million Forecast, by Type 2019 & 2032
- Table 54: Global VCS Industry Revenue Million Forecast, by Country 2019 & 2032
- Table 55: Global VCS Industry Revenue Million Forecast, by Deployment Mode 2019 & 2032
- Table 56: Global VCS Industry Revenue Million Forecast, by End-user Industry 2019 & 2032
- Table 57: Global VCS Industry Revenue Million Forecast, by Type 2019 & 2032
- Table 58: Global VCS Industry Revenue Million Forecast, by Country 2019 & 2032
- Table 59: Global VCS Industry Revenue Million Forecast, by Deployment Mode 2019 & 2032
- Table 60: Global VCS Industry Revenue Million Forecast, by End-user Industry 2019 & 2032
- Table 61: Global VCS Industry Revenue Million Forecast, by Type 2019 & 2032
- Table 62: Global VCS Industry Revenue Million Forecast, by Country 2019 & 2032
- Table 63: Global VCS Industry Revenue Million Forecast, by Deployment Mode 2019 & 2032
- Table 64: Global VCS Industry Revenue Million Forecast, by End-user Industry 2019 & 2032
- Table 65: Global VCS Industry Revenue Million Forecast, by Type 2019 & 2032
- Table 66: Global VCS Industry Revenue Million Forecast, by Country 2019 & 2032
- Table 67: Global VCS Industry Revenue Million Forecast, by Deployment Mode 2019 & 2032
- Table 68: Global VCS Industry Revenue Million Forecast, by End-user Industry 2019 & 2032
- Table 69: Global VCS Industry Revenue Million Forecast, by Type 2019 & 2032
- Table 70: Global VCS Industry Revenue Million Forecast, by Country 2019 & 2032
Frequently Asked Questions
1. What is the projected Compound Annual Growth Rate (CAGR) of the VCS Industry?
The projected CAGR is approximately 16.63%.
2. Which companies are prominent players in the VCS Industry?
Key companies in the market include Gitlab Inc, CollabNet Inc, Perforce Software Inc, Beanstalk (Wildbit LLC), Microsoft Corporation, Bitbucket org (Atlassian Corporation Plc), Amazon Web Services Inc, APAChe Software Foundation, Github Inc, Dynamsoft Corporatio.
3. What are the main segments of the VCS Industry?
The market segments include Deployment Mode, End-user Industry, Type.
4. Can you provide details about the market size?
The market size is estimated to be USD 1.11 Million as of 2022.
5. What are some drivers contributing to market growth?
Digitization of Business Processes Leading to Adoption of Software; Increasing Demand for Reduced Complexities in Software Development and Cost Optimization.
6. What are the notable trends driving market growth?
BFSI Industry Expected to Hold Significant Share.
7. Are there any restraints impacting market growth?
Use of Diversified Software Applications in Organizations; Growing Complexity Due to Massive Data Generation.
8. Can you provide examples of recent developments in the market?
September 2023 - Accenture and Workday have expanded their partnership to assist organizations in reinventing their finance functions to be more agile, data-driven, and customer-centric. The companies are collaborating to develop a suite of data-led, composable finance solutions that can be configured and reconfigured to help clients in the software and technology, retail, and media industries be more responsive to changing business requirements.
9. What pricing options are available for accessing the report?
Pricing options include single-user, multi-user, and enterprise licenses priced at USD 4750, USD 5250, and USD 8750 respectively.
10. Is the market size provided in terms of value or volume?
The market size is provided in terms of value, measured in Million.
11. Are there any specific market keywords associated with the report?
Yes, the market keyword associated with the report is "VCS Industry," which aids in identifying and referencing the specific market segment covered.
12. How do I determine which pricing option suits my needs best?
The pricing options vary based on user requirements and access needs. Individual users may opt for single-user licenses, while businesses requiring broader access may choose multi-user or enterprise licenses for cost-effective access to the report.
13. Are there any additional resources or data provided in the VCS Industry report?
While the report offers comprehensive insights, it's advisable to review the specific contents or supplementary materials provided to ascertain if additional resources or data are available.
14. How can I stay updated on further developments or reports in the VCS Industry?
To stay informed about further developments, trends, and reports in the VCS Industry, consider subscribing to industry newsletters, following relevant companies and organizations, or regularly checking reputable industry news sources and publications.
Methodology
Step 1 - Identification of Relevant Samples Size from Population Database


Step 2 - Approaches for Defining Global Market Size (Value, Volume* & Price*)

Note*: In applicable scenarios
Step 3 - Data Sources
Primary Research
- Web Analytics
- Survey Reports
- Research Institute
- Latest Research Reports
- Opinion Leaders
Secondary Research
- Annual Reports
- White Paper
- Latest Press Release
- Industry Association
- Paid Database
- Investor Presentations

Step 4 - Data Triangulation
Involves using different sources of information in order to increase the validity of a study
These sources are likely to be stakeholders in a program - participants, other researchers, program staff, other community members, and so on.
Then we put all data in single framework & apply various statistical tools to find out the dynamic on the market.
During the analysis stage, feedback from the stakeholder groups would be compared to determine areas of agreement as well as areas of divergence
