

Key Insights
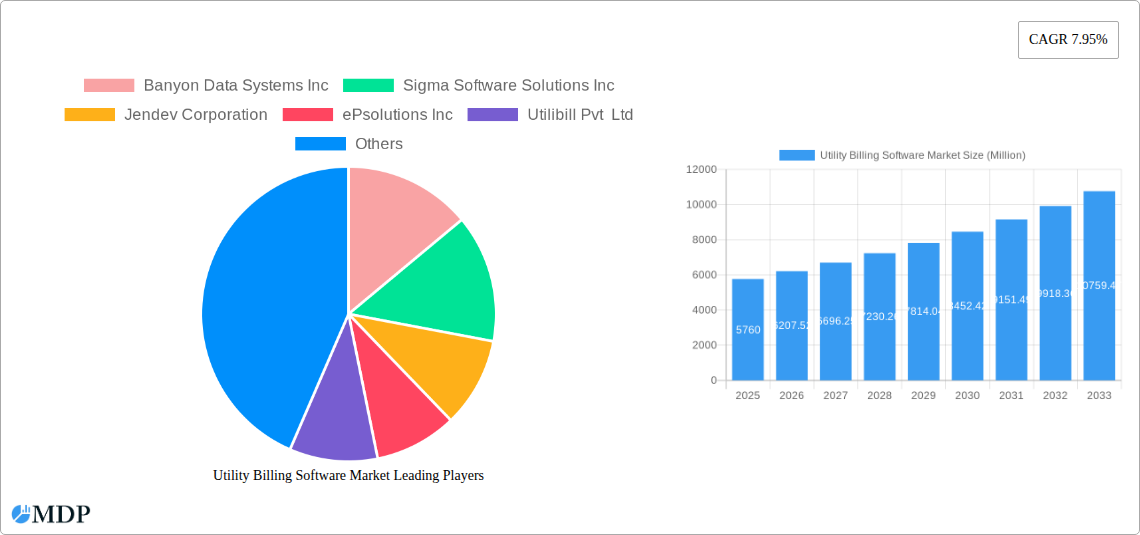
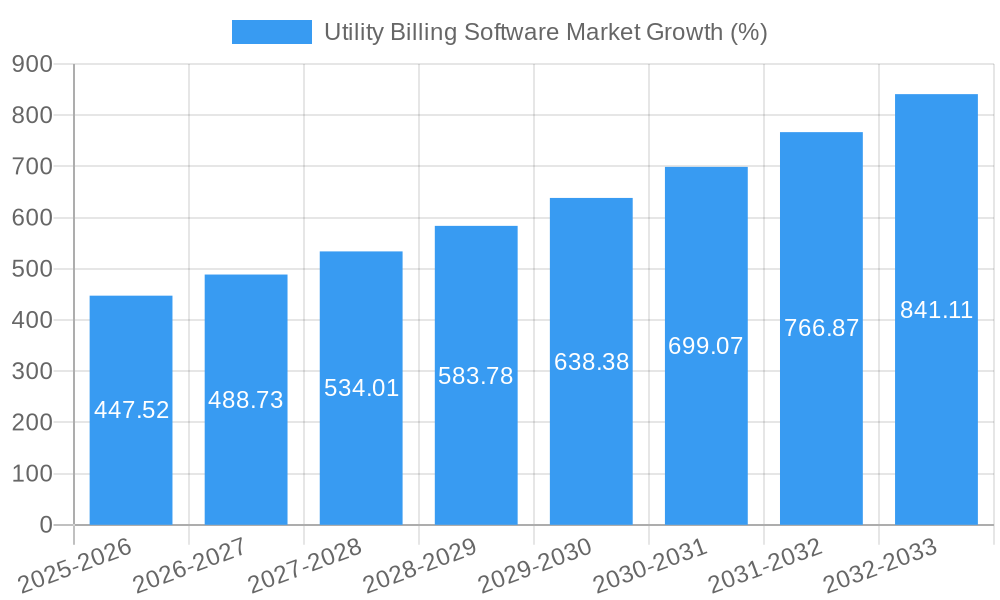
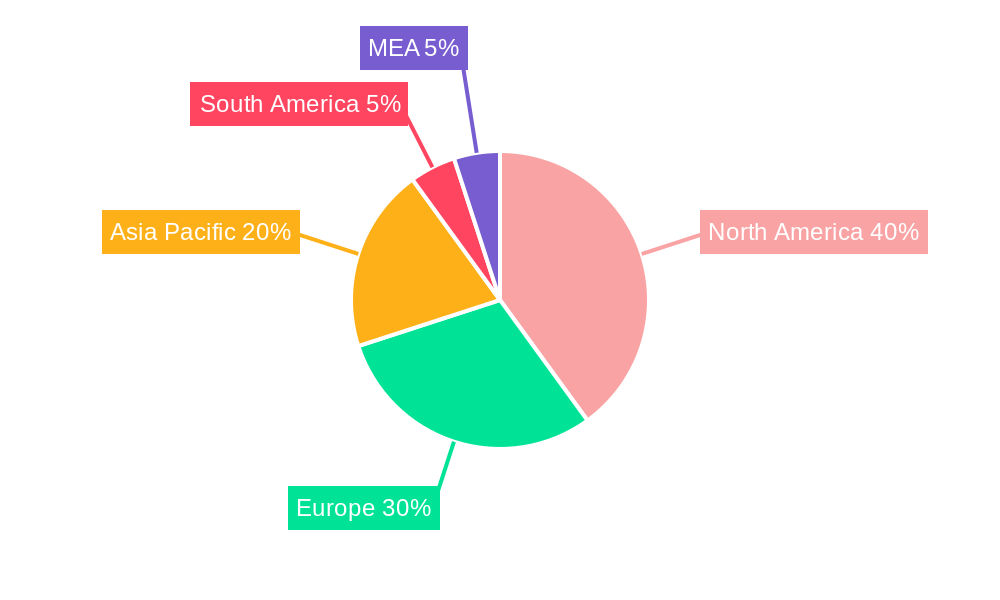
The Utility Billing Software market is experiencing robust growth, projected to reach \$5.76 billion in 2025 and maintain a Compound Annual Growth Rate (CAGR) of 7.95% from 2025 to 2033. This expansion is driven by several key factors. The increasing need for efficient and accurate billing processes within water, oil & gas, power distribution, and telecommunication sectors is a primary driver. Furthermore, the shift towards cloud-based solutions offers enhanced scalability, accessibility, and cost-effectiveness, fueling market adoption. Growing regulatory pressures to improve transparency and customer satisfaction are also encouraging utilities to adopt advanced billing systems. The market is segmented by deployment mode (cloud-based and on-premise) and end-user industry, with cloud-based solutions witnessing faster growth due to their flexibility and reduced infrastructure costs. North America currently holds a significant market share, driven by early adoption and technological advancements. However, Asia-Pacific is expected to exhibit substantial growth in the coming years, fueled by increasing infrastructure development and rising demand for modernized billing solutions in rapidly developing economies like India and China. Competition is relatively high with established players like Oracle Corporation alongside numerous specialized providers such as Banyon Data Systems Inc., Sigma Software Solutions Inc., and Jendev Corporation, continually innovating to meet evolving customer demands.
The market's growth trajectory is also influenced by several trends, including the integration of Artificial Intelligence (AI) and Machine Learning (ML) for improved fraud detection and predictive analytics. The increasing adoption of Internet of Things (IoT) devices for smart metering further enhances data collection and billing accuracy. However, the market also faces certain restraints, including high initial investment costs for implementing new software and the need for robust cybersecurity measures to protect sensitive customer data. Despite these challenges, the overall market outlook remains positive, with continued growth driven by the long-term need for efficient and reliable utility billing solutions across diverse industries and geographies. The ongoing digital transformation within the utility sector will be a crucial factor in shaping future market dynamics.
Utility Billing Software Market: A Comprehensive Report (2019-2033)
This in-depth report provides a comprehensive analysis of the Utility Billing Software Market, offering valuable insights for stakeholders across the industry. Covering the period from 2019 to 2033, with a focus on 2025, this report delves into market dynamics, competitive landscapes, technological advancements, and future growth opportunities. The market is expected to reach xx Million by 2033, growing at a CAGR of xx% during the forecast period (2025-2033).
Utility Billing Software Market Market Dynamics & Concentration
The Utility Billing Software Market is characterized by a dynamic interplay of factors influencing its growth and concentration. Market concentration is currently [insert market concentration metric, e.g., moderately concentrated, with the top 5 players holding xx% market share]. Innovation is a key driver, with continuous advancements in cloud-based solutions, AI-powered analytics, and enhanced security features shaping market competition. Stringent regulatory frameworks regarding data privacy and security significantly impact market operations. The market also witnesses competitive pressures from alternative billing methods and the emergence of innovative solutions. Mergers and acquisitions (M&A) activities are prevalent, with [insert number] M&A deals recorded in the past [time period], further shaping the market landscape. End-user trends, particularly the increasing adoption of digital technologies and the demand for improved billing efficiency, are driving market growth.
- Key Market Drivers: Technological advancements, regulatory compliance needs, increasing demand for improved efficiency and accuracy in billing.
- Key Challenges: Competition from established players and emerging startups, integration complexities with existing systems, and the need for continuous software updates and maintenance.
- Market Share Analysis: [Insert data on market share held by key players. Example: Company X - xx%, Company Y - xx%, etc.]
- M&A Activity: [Insert details on notable M&A activities and their impact on the market.]
Utility Billing Software Market Industry Trends & Analysis
The Utility Billing Software Market is experiencing significant growth driven by several factors. The increasing adoption of cloud-based solutions offers scalability and cost-effectiveness, driving market expansion. Technological disruptions, such as the integration of AI and machine learning for improved data analysis and predictive billing, are reshaping market dynamics. Consumer preferences are shifting towards user-friendly interfaces and mobile accessibility, prompting software developers to prioritize intuitive designs and mobile compatibility. Competitive dynamics are intense, with companies vying for market share through product innovation, strategic partnerships, and aggressive pricing strategies. The market penetration of cloud-based solutions is expected to reach xx% by 2033.
Leading Markets & Segments in Utility Billing Software Market
The [insert dominant region/country] region dominates the Utility Billing Software Market, driven by factors such as robust infrastructure, favorable government policies, and a high concentration of utility companies. Within segments, the cloud-based deployment mode is experiencing the fastest growth due to its flexibility and scalability. In terms of end-user industries, the Power Distribution sector is a major contributor, followed by the Water and Oil & Gas sectors.
- Key Drivers of Regional Dominance:
- [Dominant Region/Country]: [Specific economic factors, regulatory environment, technological infrastructure]
- Cloud-based Deployment: Scalability, cost-effectiveness, accessibility
- Power Distribution Sector: High volume of billing transactions, need for efficient and reliable systems
- Other End-user Industries Growth: Increased automation, improved efficiency, reduced operational costs.
Utility Billing Software Market Product Developments
Recent product developments focus on enhancing user experience, improving data security, and integrating advanced analytics capabilities. The integration of AI and machine learning is transforming billing processes, enabling automated meter reading, predictive billing, and fraud detection. These innovations cater to the growing demand for efficient, secure, and data-driven billing solutions, enhancing the competitive advantages of market players.
Key Drivers of Utility Billing Software Market Growth
Technological advancements, such as cloud computing and AI, are key drivers. Economic factors like the need for cost optimization and improved operational efficiency within utility companies fuel market demand. Favorable regulatory frameworks and government initiatives promoting digitalization within the utility sector further stimulate growth. For example, the increasing adoption of smart meters is creating a surge in demand for software capable of handling large datasets and complex billing processes.
Challenges in the Utility Billing Software Market Market
Integration with legacy systems presents a significant challenge for many utility companies. Cybersecurity threats and data privacy concerns are major hurdles. The high cost of implementation and maintenance can deter some smaller utility companies. Intense competition from both established players and new entrants poses a continuous challenge. The overall impact of these challenges is estimated to reduce the market growth by approximately xx% during the forecast period.
Emerging Opportunities in Utility Billing Software Market
The integration of blockchain technology for secure and transparent billing processes presents a significant opportunity. The rise of the Internet of Things (IoT) and its potential for seamless data integration offers further expansion. Strategic partnerships between software providers and utility companies can unlock synergies and drive mutual growth. Expanding into new geographical markets and developing tailored solutions for niche utility sectors offer significant potential.
Leading Players in the Utility Billing Software Market Sector
- Banyon Data Systems Inc
- Sigma Software Solutions Inc
- Jendev Corporation
- ePsolutions Inc
- Utilibill Pvt Ltd
- Jayhawk Software Inc
- Exceleron Softwares Inc
- PayStand Inc
- Oracle Corporation
- Harris Computer Systems
Key Milestones in Utility Billing Software Market Industry
- October 2022: Exceleron Softwares Inc. enhanced its MyUsage solution to support Amazon Web Services and tier-1 private cloud options, improving flexibility and scalability for utility customers.
- September 2022: Harris Computer Systems acquired AirVM Inc., adding a private cloud management platform and enhancing its billing data accuracy.
Strategic Outlook for Utility Billing Software Market Market
The Utility Billing Software Market is poised for continued growth, driven by technological innovations, increasing demand for efficient billing solutions, and favorable regulatory environments. Strategic partnerships, expansion into new markets, and continuous product development will be crucial for success. The market presents significant opportunities for companies that can effectively address the challenges and capitalize on emerging trends.
Utility Billing Software Market Segmentation
-
1. Deployment Mode
- 1.1. Cloud-based
- 1.2. On-premise
-
2. End-user Industry
- 2.1. Water
- 2.2. Oil & Gas
- 2.3. Power Distribution
- 2.4. Telecommunication
- 2.5. Other End-user Industries
Utility Billing Software Market Segmentation By Geography
-
1. North America
- 1.1. United States
- 1.2. Canada
-
2. Europe
- 2.1. Germany
- 2.2. United Kingdom
- 2.3. France
- 2.4. Rest of Europe
-
3. Asia Pacific
- 3.1. China
- 3.2. Japan
- 3.3. India
- 3.4. Rest of Asia Pacific
- 4. Rest of the World
Utility Billing Software Market REPORT HIGHLIGHTS
| Aspects | Details |
|---|---|
| Study Period | 2019-2033 |
| Base Year | 2024 |
| Estimated Year | 2025 |
| Forecast Period | 2025-2033 |
| Historical Period | 2019-2024 |
| Growth Rate | CAGR of 7.95% from 2019-2033 |
| Segmentation |
|
Table of Contents
- 1. Introduction
- 1.1. Research Scope
- 1.2. Market Segmentation
- 1.3. Research Methodology
- 1.4. Definitions and Assumptions
- 2. Executive Summary
- 2.1. Introduction
- 3. Market Dynamics
- 3.1. Introduction
- 3.2. Market Drivers
- 3.2.1. Improvement in Legacy Billing Systems and IT Infrastructure; Growing Investment in Smart Grid Technology
- 3.3. Market Restrains
- 3.3.1. Lack of Digital Skills Among End-user Industries
- 3.4. Market Trends
- 3.4.1. Power Distribution Industry Expected to Hold Significant Market Share
- 4. Market Factor Analysis
- 4.1. Porters Five Forces
- 4.2. Supply/Value Chain
- 4.3. PESTEL analysis
- 4.4. Market Entropy
- 4.5. Patent/Trademark Analysis
- 5. Global Utility Billing Software Market Analysis, Insights and Forecast, 2019-2031
- 5.1. Market Analysis, Insights and Forecast - by Deployment Mode
- 5.1.1. Cloud-based
- 5.1.2. On-premise
- 5.2. Market Analysis, Insights and Forecast - by End-user Industry
- 5.2.1. Water
- 5.2.2. Oil & Gas
- 5.2.3. Power Distribution
- 5.2.4. Telecommunication
- 5.2.5. Other End-user Industries
- 5.3. Market Analysis, Insights and Forecast - by Region
- 5.3.1. North America
- 5.3.2. Europe
- 5.3.3. Asia Pacific
- 5.3.4. Rest of the World
- 5.1. Market Analysis, Insights and Forecast - by Deployment Mode
- 6. North America Utility Billing Software Market Analysis, Insights and Forecast, 2019-2031
- 6.1. Market Analysis, Insights and Forecast - by Deployment Mode
- 6.1.1. Cloud-based
- 6.1.2. On-premise
- 6.2. Market Analysis, Insights and Forecast - by End-user Industry
- 6.2.1. Water
- 6.2.2. Oil & Gas
- 6.2.3. Power Distribution
- 6.2.4. Telecommunication
- 6.2.5. Other End-user Industries
- 6.1. Market Analysis, Insights and Forecast - by Deployment Mode
- 7. Europe Utility Billing Software Market Analysis, Insights and Forecast, 2019-2031
- 7.1. Market Analysis, Insights and Forecast - by Deployment Mode
- 7.1.1. Cloud-based
- 7.1.2. On-premise
- 7.2. Market Analysis, Insights and Forecast - by End-user Industry
- 7.2.1. Water
- 7.2.2. Oil & Gas
- 7.2.3. Power Distribution
- 7.2.4. Telecommunication
- 7.2.5. Other End-user Industries
- 7.1. Market Analysis, Insights and Forecast - by Deployment Mode
- 8. Asia Pacific Utility Billing Software Market Analysis, Insights and Forecast, 2019-2031
- 8.1. Market Analysis, Insights and Forecast - by Deployment Mode
- 8.1.1. Cloud-based
- 8.1.2. On-premise
- 8.2. Market Analysis, Insights and Forecast - by End-user Industry
- 8.2.1. Water
- 8.2.2. Oil & Gas
- 8.2.3. Power Distribution
- 8.2.4. Telecommunication
- 8.2.5. Other End-user Industries
- 8.1. Market Analysis, Insights and Forecast - by Deployment Mode
- 9. Rest of the World Utility Billing Software Market Analysis, Insights and Forecast, 2019-2031
- 9.1. Market Analysis, Insights and Forecast - by Deployment Mode
- 9.1.1. Cloud-based
- 9.1.2. On-premise
- 9.2. Market Analysis, Insights and Forecast - by End-user Industry
- 9.2.1. Water
- 9.2.2. Oil & Gas
- 9.2.3. Power Distribution
- 9.2.4. Telecommunication
- 9.2.5. Other End-user Industries
- 9.1. Market Analysis, Insights and Forecast - by Deployment Mode
- 10. North America Utility Billing Software Market Analysis, Insights and Forecast, 2019-2031
- 10.1. Market Analysis, Insights and Forecast - By Country/Sub-region
- 10.1.1 United States
- 10.1.2 Canada
- 10.1.3 Mexico
- 11. Europe Utility Billing Software Market Analysis, Insights and Forecast, 2019-2031
- 11.1. Market Analysis, Insights and Forecast - By Country/Sub-region
- 11.1.1 Germany
- 11.1.2 United Kingdom
- 11.1.3 France
- 11.1.4 Spain
- 11.1.5 Italy
- 11.1.6 Spain
- 11.1.7 Belgium
- 11.1.8 Netherland
- 11.1.9 Nordics
- 11.1.10 Rest of Europe
- 12. Asia Pacific Utility Billing Software Market Analysis, Insights and Forecast, 2019-2031
- 12.1. Market Analysis, Insights and Forecast - By Country/Sub-region
- 12.1.1 China
- 12.1.2 Japan
- 12.1.3 India
- 12.1.4 South Korea
- 12.1.5 Southeast Asia
- 12.1.6 Australia
- 12.1.7 Indonesia
- 12.1.8 Phillipes
- 12.1.9 Singapore
- 12.1.10 Thailandc
- 12.1.11 Rest of Asia Pacific
- 13. South America Utility Billing Software Market Analysis, Insights and Forecast, 2019-2031
- 13.1. Market Analysis, Insights and Forecast - By Country/Sub-region
- 13.1.1 Brazil
- 13.1.2 Argentina
- 13.1.3 Peru
- 13.1.4 Chile
- 13.1.5 Colombia
- 13.1.6 Ecuador
- 13.1.7 Venezuela
- 13.1.8 Rest of South America
- 14. North America Utility Billing Software Market Analysis, Insights and Forecast, 2019-2031
- 14.1. Market Analysis, Insights and Forecast - By Country/Sub-region
- 14.1.1 United States
- 14.1.2 Canada
- 14.1.3 Mexico
- 15. MEA Utility Billing Software Market Analysis, Insights and Forecast, 2019-2031
- 15.1. Market Analysis, Insights and Forecast - By Country/Sub-region
- 15.1.1 United Arab Emirates
- 15.1.2 Saudi Arabia
- 15.1.3 South Africa
- 15.1.4 Rest of Middle East and Africa
- 16. Competitive Analysis
- 16.1. Global Market Share Analysis 2024
- 16.2. Company Profiles
- 16.2.1 Banyon Data Systems Inc
- 16.2.1.1. Overview
- 16.2.1.2. Products
- 16.2.1.3. SWOT Analysis
- 16.2.1.4. Recent Developments
- 16.2.1.5. Financials (Based on Availability)
- 16.2.2 Sigma Software Solutions Inc
- 16.2.2.1. Overview
- 16.2.2.2. Products
- 16.2.2.3. SWOT Analysis
- 16.2.2.4. Recent Developments
- 16.2.2.5. Financials (Based on Availability)
- 16.2.3 Jendev Corporation
- 16.2.3.1. Overview
- 16.2.3.2. Products
- 16.2.3.3. SWOT Analysis
- 16.2.3.4. Recent Developments
- 16.2.3.5. Financials (Based on Availability)
- 16.2.4 ePsolutions Inc
- 16.2.4.1. Overview
- 16.2.4.2. Products
- 16.2.4.3. SWOT Analysis
- 16.2.4.4. Recent Developments
- 16.2.4.5. Financials (Based on Availability)
- 16.2.5 Utilibill Pvt Ltd
- 16.2.5.1. Overview
- 16.2.5.2. Products
- 16.2.5.3. SWOT Analysis
- 16.2.5.4. Recent Developments
- 16.2.5.5. Financials (Based on Availability)
- 16.2.6 Jayhawk Software Inc
- 16.2.6.1. Overview
- 16.2.6.2. Products
- 16.2.6.3. SWOT Analysis
- 16.2.6.4. Recent Developments
- 16.2.6.5. Financials (Based on Availability)
- 16.2.7 Exceleron Softwares Inc
- 16.2.7.1. Overview
- 16.2.7.2. Products
- 16.2.7.3. SWOT Analysis
- 16.2.7.4. Recent Developments
- 16.2.7.5. Financials (Based on Availability)
- 16.2.8 PayStand Inc
- 16.2.8.1. Overview
- 16.2.8.2. Products
- 16.2.8.3. SWOT Analysis
- 16.2.8.4. Recent Developments
- 16.2.8.5. Financials (Based on Availability)
- 16.2.9 Oracle Corporation*List Not Exhaustive
- 16.2.9.1. Overview
- 16.2.9.2. Products
- 16.2.9.3. SWOT Analysis
- 16.2.9.4. Recent Developments
- 16.2.9.5. Financials (Based on Availability)
- 16.2.10 Harris Computer Systems
- 16.2.10.1. Overview
- 16.2.10.2. Products
- 16.2.10.3. SWOT Analysis
- 16.2.10.4. Recent Developments
- 16.2.10.5. Financials (Based on Availability)
- 16.2.1 Banyon Data Systems Inc
List of Figures
- Figure 1: Global Utility Billing Software Market Revenue Breakdown (Million, %) by Region 2024 & 2032
- Figure 2: North America Utility Billing Software Market Revenue (Million), by Country 2024 & 2032
- Figure 3: North America Utility Billing Software Market Revenue Share (%), by Country 2024 & 2032
- Figure 4: Europe Utility Billing Software Market Revenue (Million), by Country 2024 & 2032
- Figure 5: Europe Utility Billing Software Market Revenue Share (%), by Country 2024 & 2032
- Figure 6: Asia Pacific Utility Billing Software Market Revenue (Million), by Country 2024 & 2032
- Figure 7: Asia Pacific Utility Billing Software Market Revenue Share (%), by Country 2024 & 2032
- Figure 8: South America Utility Billing Software Market Revenue (Million), by Country 2024 & 2032
- Figure 9: South America Utility Billing Software Market Revenue Share (%), by Country 2024 & 2032
- Figure 10: North America Utility Billing Software Market Revenue (Million), by Country 2024 & 2032
- Figure 11: North America Utility Billing Software Market Revenue Share (%), by Country 2024 & 2032
- Figure 12: MEA Utility Billing Software Market Revenue (Million), by Country 2024 & 2032
- Figure 13: MEA Utility Billing Software Market Revenue Share (%), by Country 2024 & 2032
- Figure 14: North America Utility Billing Software Market Revenue (Million), by Deployment Mode 2024 & 2032
- Figure 15: North America Utility Billing Software Market Revenue Share (%), by Deployment Mode 2024 & 2032
- Figure 16: North America Utility Billing Software Market Revenue (Million), by End-user Industry 2024 & 2032
- Figure 17: North America Utility Billing Software Market Revenue Share (%), by End-user Industry 2024 & 2032
- Figure 18: North America Utility Billing Software Market Revenue (Million), by Country 2024 & 2032
- Figure 19: North America Utility Billing Software Market Revenue Share (%), by Country 2024 & 2032
- Figure 20: Europe Utility Billing Software Market Revenue (Million), by Deployment Mode 2024 & 2032
- Figure 21: Europe Utility Billing Software Market Revenue Share (%), by Deployment Mode 2024 & 2032
- Figure 22: Europe Utility Billing Software Market Revenue (Million), by End-user Industry 2024 & 2032
- Figure 23: Europe Utility Billing Software Market Revenue Share (%), by End-user Industry 2024 & 2032
- Figure 24: Europe Utility Billing Software Market Revenue (Million), by Country 2024 & 2032
- Figure 25: Europe Utility Billing Software Market Revenue Share (%), by Country 2024 & 2032
- Figure 26: Asia Pacific Utility Billing Software Market Revenue (Million), by Deployment Mode 2024 & 2032
- Figure 27: Asia Pacific Utility Billing Software Market Revenue Share (%), by Deployment Mode 2024 & 2032
- Figure 28: Asia Pacific Utility Billing Software Market Revenue (Million), by End-user Industry 2024 & 2032
- Figure 29: Asia Pacific Utility Billing Software Market Revenue Share (%), by End-user Industry 2024 & 2032
- Figure 30: Asia Pacific Utility Billing Software Market Revenue (Million), by Country 2024 & 2032
- Figure 31: Asia Pacific Utility Billing Software Market Revenue Share (%), by Country 2024 & 2032
- Figure 32: Rest of the World Utility Billing Software Market Revenue (Million), by Deployment Mode 2024 & 2032
- Figure 33: Rest of the World Utility Billing Software Market Revenue Share (%), by Deployment Mode 2024 & 2032
- Figure 34: Rest of the World Utility Billing Software Market Revenue (Million), by End-user Industry 2024 & 2032
- Figure 35: Rest of the World Utility Billing Software Market Revenue Share (%), by End-user Industry 2024 & 2032
- Figure 36: Rest of the World Utility Billing Software Market Revenue (Million), by Country 2024 & 2032
- Figure 37: Rest of the World Utility Billing Software Market Revenue Share (%), by Country 2024 & 2032
List of Tables
- Table 1: Global Utility Billing Software Market Revenue Million Forecast, by Region 2019 & 2032
- Table 2: Global Utility Billing Software Market Revenue Million Forecast, by Deployment Mode 2019 & 2032
- Table 3: Global Utility Billing Software Market Revenue Million Forecast, by End-user Industry 2019 & 2032
- Table 4: Global Utility Billing Software Market Revenue Million Forecast, by Region 2019 & 2032
- Table 5: Global Utility Billing Software Market Revenue Million Forecast, by Country 2019 & 2032
- Table 6: United States Utility Billing Software Market Revenue (Million) Forecast, by Application 2019 & 2032
- Table 7: Canada Utility Billing Software Market Revenue (Million) Forecast, by Application 2019 & 2032
- Table 8: Mexico Utility Billing Software Market Revenue (Million) Forecast, by Application 2019 & 2032
- Table 9: Global Utility Billing Software Market Revenue Million Forecast, by Country 2019 & 2032
- Table 10: Germany Utility Billing Software Market Revenue (Million) Forecast, by Application 2019 & 2032
- Table 11: United Kingdom Utility Billing Software Market Revenue (Million) Forecast, by Application 2019 & 2032
- Table 12: France Utility Billing Software Market Revenue (Million) Forecast, by Application 2019 & 2032
- Table 13: Spain Utility Billing Software Market Revenue (Million) Forecast, by Application 2019 & 2032
- Table 14: Italy Utility Billing Software Market Revenue (Million) Forecast, by Application 2019 & 2032
- Table 15: Spain Utility Billing Software Market Revenue (Million) Forecast, by Application 2019 & 2032
- Table 16: Belgium Utility Billing Software Market Revenue (Million) Forecast, by Application 2019 & 2032
- Table 17: Netherland Utility Billing Software Market Revenue (Million) Forecast, by Application 2019 & 2032
- Table 18: Nordics Utility Billing Software Market Revenue (Million) Forecast, by Application 2019 & 2032
- Table 19: Rest of Europe Utility Billing Software Market Revenue (Million) Forecast, by Application 2019 & 2032
- Table 20: Global Utility Billing Software Market Revenue Million Forecast, by Country 2019 & 2032
- Table 21: China Utility Billing Software Market Revenue (Million) Forecast, by Application 2019 & 2032
- Table 22: Japan Utility Billing Software Market Revenue (Million) Forecast, by Application 2019 & 2032
- Table 23: India Utility Billing Software Market Revenue (Million) Forecast, by Application 2019 & 2032
- Table 24: South Korea Utility Billing Software Market Revenue (Million) Forecast, by Application 2019 & 2032
- Table 25: Southeast Asia Utility Billing Software Market Revenue (Million) Forecast, by Application 2019 & 2032
- Table 26: Australia Utility Billing Software Market Revenue (Million) Forecast, by Application 2019 & 2032
- Table 27: Indonesia Utility Billing Software Market Revenue (Million) Forecast, by Application 2019 & 2032
- Table 28: Phillipes Utility Billing Software Market Revenue (Million) Forecast, by Application 2019 & 2032
- Table 29: Singapore Utility Billing Software Market Revenue (Million) Forecast, by Application 2019 & 2032
- Table 30: Thailandc Utility Billing Software Market Revenue (Million) Forecast, by Application 2019 & 2032
- Table 31: Rest of Asia Pacific Utility Billing Software Market Revenue (Million) Forecast, by Application 2019 & 2032
- Table 32: Global Utility Billing Software Market Revenue Million Forecast, by Country 2019 & 2032
- Table 33: Brazil Utility Billing Software Market Revenue (Million) Forecast, by Application 2019 & 2032
- Table 34: Argentina Utility Billing Software Market Revenue (Million) Forecast, by Application 2019 & 2032
- Table 35: Peru Utility Billing Software Market Revenue (Million) Forecast, by Application 2019 & 2032
- Table 36: Chile Utility Billing Software Market Revenue (Million) Forecast, by Application 2019 & 2032
- Table 37: Colombia Utility Billing Software Market Revenue (Million) Forecast, by Application 2019 & 2032
- Table 38: Ecuador Utility Billing Software Market Revenue (Million) Forecast, by Application 2019 & 2032
- Table 39: Venezuela Utility Billing Software Market Revenue (Million) Forecast, by Application 2019 & 2032
- Table 40: Rest of South America Utility Billing Software Market Revenue (Million) Forecast, by Application 2019 & 2032
- Table 41: Global Utility Billing Software Market Revenue Million Forecast, by Country 2019 & 2032
- Table 42: United States Utility Billing Software Market Revenue (Million) Forecast, by Application 2019 & 2032
- Table 43: Canada Utility Billing Software Market Revenue (Million) Forecast, by Application 2019 & 2032
- Table 44: Mexico Utility Billing Software Market Revenue (Million) Forecast, by Application 2019 & 2032
- Table 45: Global Utility Billing Software Market Revenue Million Forecast, by Country 2019 & 2032
- Table 46: United Arab Emirates Utility Billing Software Market Revenue (Million) Forecast, by Application 2019 & 2032
- Table 47: Saudi Arabia Utility Billing Software Market Revenue (Million) Forecast, by Application 2019 & 2032
- Table 48: South Africa Utility Billing Software Market Revenue (Million) Forecast, by Application 2019 & 2032
- Table 49: Rest of Middle East and Africa Utility Billing Software Market Revenue (Million) Forecast, by Application 2019 & 2032
- Table 50: Global Utility Billing Software Market Revenue Million Forecast, by Deployment Mode 2019 & 2032
- Table 51: Global Utility Billing Software Market Revenue Million Forecast, by End-user Industry 2019 & 2032
- Table 52: Global Utility Billing Software Market Revenue Million Forecast, by Country 2019 & 2032
- Table 53: United States Utility Billing Software Market Revenue (Million) Forecast, by Application 2019 & 2032
- Table 54: Canada Utility Billing Software Market Revenue (Million) Forecast, by Application 2019 & 2032
- Table 55: Global Utility Billing Software Market Revenue Million Forecast, by Deployment Mode 2019 & 2032
- Table 56: Global Utility Billing Software Market Revenue Million Forecast, by End-user Industry 2019 & 2032
- Table 57: Global Utility Billing Software Market Revenue Million Forecast, by Country 2019 & 2032
- Table 58: Germany Utility Billing Software Market Revenue (Million) Forecast, by Application 2019 & 2032
- Table 59: United Kingdom Utility Billing Software Market Revenue (Million) Forecast, by Application 2019 & 2032
- Table 60: France Utility Billing Software Market Revenue (Million) Forecast, by Application 2019 & 2032
- Table 61: Rest of Europe Utility Billing Software Market Revenue (Million) Forecast, by Application 2019 & 2032
- Table 62: Global Utility Billing Software Market Revenue Million Forecast, by Deployment Mode 2019 & 2032
- Table 63: Global Utility Billing Software Market Revenue Million Forecast, by End-user Industry 2019 & 2032
- Table 64: Global Utility Billing Software Market Revenue Million Forecast, by Country 2019 & 2032
- Table 65: China Utility Billing Software Market Revenue (Million) Forecast, by Application 2019 & 2032
- Table 66: Japan Utility Billing Software Market Revenue (Million) Forecast, by Application 2019 & 2032
- Table 67: India Utility Billing Software Market Revenue (Million) Forecast, by Application 2019 & 2032
- Table 68: Rest of Asia Pacific Utility Billing Software Market Revenue (Million) Forecast, by Application 2019 & 2032
- Table 69: Global Utility Billing Software Market Revenue Million Forecast, by Deployment Mode 2019 & 2032
- Table 70: Global Utility Billing Software Market Revenue Million Forecast, by End-user Industry 2019 & 2032
- Table 71: Global Utility Billing Software Market Revenue Million Forecast, by Country 2019 & 2032
Frequently Asked Questions
1. What is the projected Compound Annual Growth Rate (CAGR) of the Utility Billing Software Market?
The projected CAGR is approximately 7.95%.
2. Which companies are prominent players in the Utility Billing Software Market?
Key companies in the market include Banyon Data Systems Inc, Sigma Software Solutions Inc, Jendev Corporation, ePsolutions Inc, Utilibill Pvt Ltd, Jayhawk Software Inc, Exceleron Softwares Inc, PayStand Inc, Oracle Corporation*List Not Exhaustive, Harris Computer Systems.
3. What are the main segments of the Utility Billing Software Market?
The market segments include Deployment Mode, End-user Industry.
4. Can you provide details about the market size?
The market size is estimated to be USD 5.76 Million as of 2022.
5. What are some drivers contributing to market growth?
Improvement in Legacy Billing Systems and IT Infrastructure; Growing Investment in Smart Grid Technology.
6. What are the notable trends driving market growth?
Power Distribution Industry Expected to Hold Significant Market Share.
7. Are there any restraints impacting market growth?
Lack of Digital Skills Among End-user Industries.
8. Can you provide examples of recent developments in the market?
October 2022 - Exceleron Softwares Inc. has announced that it has enhanced the MyUsage solution to support amazon web services along with tier -1 private cloud options that MyUsage hybrid cloud offerings provide customers with greater flexibility and scalability; this allows excelerons utility customers to select the hosting option that meets their security and back office requirements.
9. What pricing options are available for accessing the report?
Pricing options include single-user, multi-user, and enterprise licenses priced at USD 4750, USD 5250, and USD 8750 respectively.
10. Is the market size provided in terms of value or volume?
The market size is provided in terms of value, measured in Million.
11. Are there any specific market keywords associated with the report?
Yes, the market keyword associated with the report is "Utility Billing Software Market," which aids in identifying and referencing the specific market segment covered.
12. How do I determine which pricing option suits my needs best?
The pricing options vary based on user requirements and access needs. Individual users may opt for single-user licenses, while businesses requiring broader access may choose multi-user or enterprise licenses for cost-effective access to the report.
13. Are there any additional resources or data provided in the Utility Billing Software Market report?
While the report offers comprehensive insights, it's advisable to review the specific contents or supplementary materials provided to ascertain if additional resources or data are available.
14. How can I stay updated on further developments or reports in the Utility Billing Software Market?
To stay informed about further developments, trends, and reports in the Utility Billing Software Market, consider subscribing to industry newsletters, following relevant companies and organizations, or regularly checking reputable industry news sources and publications.
Methodology
Step 1 - Identification of Relevant Samples Size from Population Database


Step 2 - Approaches for Defining Global Market Size (Value, Volume* & Price*)

Note*: In applicable scenarios
Step 3 - Data Sources
Primary Research
- Web Analytics
- Survey Reports
- Research Institute
- Latest Research Reports
- Opinion Leaders
Secondary Research
- Annual Reports
- White Paper
- Latest Press Release
- Industry Association
- Paid Database
- Investor Presentations

Step 4 - Data Triangulation
Involves using different sources of information in order to increase the validity of a study
These sources are likely to be stakeholders in a program - participants, other researchers, program staff, other community members, and so on.
Then we put all data in single framework & apply various statistical tools to find out the dynamic on the market.
During the analysis stage, feedback from the stakeholder groups would be compared to determine areas of agreement as well as areas of divergence
