

Key Insights
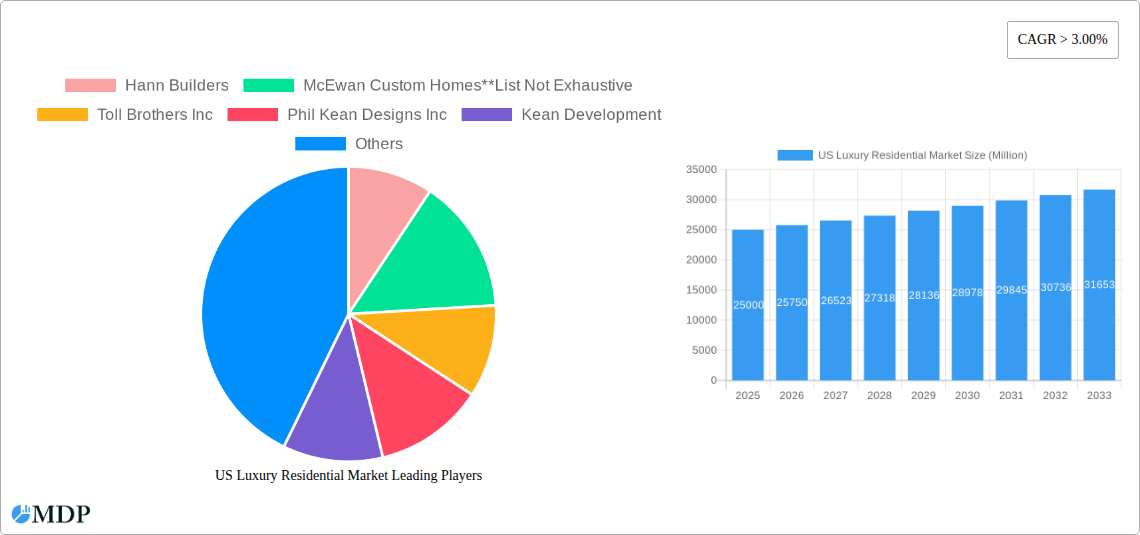
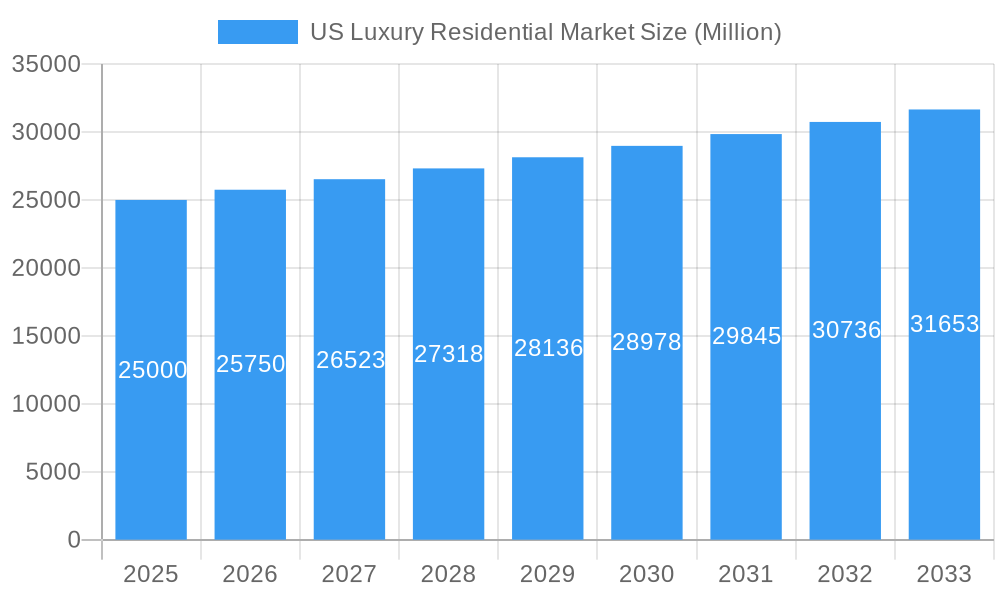
The US luxury residential market, encompassing apartments, condominiums, villas, and landed houses, is experiencing robust growth, projected to maintain a CAGR exceeding 3% from 2025 to 2033. This expansion is fueled by several key drivers. Firstly, a sustained increase in high-net-worth individuals (HNWIs) and ultra-high-net-worth individuals (UHNWIs) within the United States continues to drive demand for premium properties. Secondly, the ongoing shift towards remote work and a preference for larger, more luxurious living spaces are boosting sales in suburban and exurban areas, particularly in desirable locations such as those surrounding major metropolitan areas. Thirdly, low-interest rates (though potentially fluctuating) in recent years have made luxury mortgages more accessible, stimulating market activity. However, the market faces challenges. Rising construction costs and material shortages are placing upward pressure on prices, potentially impacting affordability. Furthermore, economic uncertainty and potential changes in government policy could affect future growth. Segmentation analysis reveals that New York, Los Angeles, and San Francisco remain dominant cities within this market, although other cities like Miami and Washington D.C. are exhibiting strong growth potential. Key players such as Toll Brothers Inc. and D R Horton, alongside smaller boutique firms like McEwan Custom Homes and Phil Kean Designs Inc., are vying for market share through innovative designs and high-end finishes. Regional variations exist, with the Northeast and West Coast currently exhibiting the strongest demand, but the Southeast and Southwest are also showing considerable potential for future expansion.
US Luxury Residential Market Market Size (In Billion)
The forecast period (2025-2033) is expected to witness continued growth, albeit at a potentially moderated pace due to external economic factors and potential regulatory changes. This will necessitate strategic adaptation by developers, focusing on sustainable building practices, targeted marketing to specific demographics, and leveraging technology to enhance the customer experience. Market segmentation by property type and location will prove critical in maximizing returns and capitalizing on emerging trends within different geographical segments. The strong presence of established and emerging builders indicates a healthy competitive landscape fostering innovation and driving improvements across the sector. Long-term projections suggest a consistently expanding market, making luxury residential real estate a compelling investment opportunity despite potential short-term fluctuations.
US Luxury Residential Market Company Market Share
US Luxury Residential Market Report: 2019-2033 Forecast
Uncover lucrative investment opportunities and strategic insights into the booming US luxury residential market with this comprehensive report. This in-depth analysis provides a detailed overview of market dynamics, trends, leading players (including Hann Builders, McEwan Custom Homes, Toll Brothers Inc, Phil Kean Designs Inc, and more), and future growth projections from 2019 to 2033. Ideal for real estate investors, developers, architects, and industry stakeholders seeking to navigate this high-value sector.
US Luxury Residential Market Market Dynamics & Concentration
The US luxury residential market, valued at $xx Million in 2024, is experiencing dynamic shifts driven by several key factors. Market concentration is moderate, with a few large players like Toll Brothers Inc. holding significant market share, while numerous smaller, specialized firms such as Hann Builders and McEwan Custom Homes cater to niche clientele. Innovation is fueled by technological advancements in smart home technology, sustainable building materials, and design customization. Regulatory frameworks, varying across states, influence construction costs and timelines. Product substitutes, like luxury rentals and co-living spaces, exert competitive pressure. End-user trends reveal a growing preference for sustainable, technologically advanced, and personalized luxury homes. M&A activity remains robust, with xx major deals recorded between 2019 and 2024, indicating consolidation and expansion within the sector.
- Market Share: Toll Brothers Inc. holds an estimated xx% market share in 2024. Hann Builders and McEwan Custom Homes collectively hold approximately xx%.
- M&A Activity: An estimated xx M&A deals occurred between 2019 and 2024, primarily driven by expansion strategies and access to new markets.
- Regulatory Landscape: Varying zoning laws and building codes across states impact development costs and timelines.
US Luxury Residential Market Industry Trends & Analysis
The US luxury residential market exhibits a robust growth trajectory, projected to reach $xx Million by 2033, with a CAGR of xx% during the forecast period (2025-2033). Several key factors drive this growth. Rising high-net-worth individual populations in major metropolitan areas fuel demand for exclusive properties. Technological disruptions, such as smart home integration and sustainable design, are becoming increasingly integral to luxury home offerings, enhancing market penetration. Consumer preferences shift towards personalized, spacious, and eco-friendly homes. Intense competitive dynamics among established players and emerging firms further shape market evolution. The market penetration of smart home technology in luxury residences is expected to reach xx% by 2033. This trend is significantly influencing buyer preferences and shaping the competitive landscape.
Leading Markets & Segments in US Luxury Residential Market
New York, Los Angeles, and San Francisco consistently dominate the US luxury residential market, representing a combined xx% market share in 2024.
By City:
- New York: High demand driven by strong economic activity, limited land availability, and a large concentration of high-net-worth individuals.
- Los Angeles: Desirable climate, iconic locations, and a thriving entertainment industry contribute to high demand.
- San Francisco: A robust technology sector and a limited housing supply drive premium pricing.
- Miami: International appeal, attractive lifestyle, and proximity to the ocean create a high-demand market.
- Washington D.C.: Political influence, high-income residents, and a desirable location attract significant investment.
By Type:
- Villas and Landed Houses: This segment holds the largest market share due to the preference for larger, private properties among high-net-worth buyers.
- Apartments and Condominiums: This segment is experiencing growth driven by demand for luxury amenities and convenient city locations.
US Luxury Residential Market Product Developments
Technological advancements are significantly shaping product development in the luxury residential market. Smart home integration, energy-efficient systems, sustainable building materials, and personalized design features are key trends. These innovations enhance the value proposition, appealing to discerning buyers seeking convenience, environmental responsibility, and bespoke living experiences. The integration of AI-powered security systems and personalized climate control is gaining significant traction.
Key Drivers of US Luxury Residential Market Growth
Several factors fuel the growth of the US luxury residential market. Robust economic conditions, particularly in major metropolitan areas, boost purchasing power among high-net-worth individuals. Favorable government policies and tax incentives in some regions stimulate investment in luxury housing developments. Technological advancements in building materials and smart home technology enhance the appeal of luxury residences.
Challenges in the US Luxury Residential Market Market
The US luxury residential market faces several challenges. High construction costs, labor shortages, and supply chain disruptions constrain development and increase project timelines. Stringent regulatory compliance requirements add to development complexity and expenses. Intense competition among established and emerging players puts downward pressure on profit margins. These factors collectively impact market growth and profitability.
Emerging Opportunities in US Luxury Residential Market
The long-term growth of the US luxury residential market hinges on several opportunities. The increasing adoption of sustainable building practices and smart home technologies offers significant potential. Strategic partnerships among developers, technology firms, and design companies can drive innovation and create unique market offerings. Expansion into emerging markets and niche segments can unlock new revenue streams and reduce reliance on traditional luxury hotspots.
Leading Players in the US Luxury Residential Market Sector
- Toll Brothers Inc
- Hann Builders
- McEwan Custom Homes
- Phil Kean Designs Inc
- Kean Development
- Calvis Wyant
- Wardell Builders
- D R Horton
- Haley Custom Homes
- Bob Thompson Homes
Key Milestones in US Luxury Residential Market Industry
- 2020: Increased adoption of virtual and augmented reality technologies in home design and marketing.
- 2021: Significant rise in demand for sustainable and energy-efficient luxury homes.
- 2022: Several large-scale luxury residential developments commenced in major metropolitan areas.
- 2023: Increased focus on incorporating smart home technology into luxury projects.
- 2024: Several mergers and acquisitions among luxury home builders.
Strategic Outlook for US Luxury Residential Market Market
The US luxury residential market presents substantial long-term growth potential. Strategic focus on technological integration, sustainability, and personalized experiences will be crucial for success. Expansion into secondary markets and exploration of niche segments, like ultra-luxury eco-homes, can unlock further opportunities. Embracing innovation and proactively adapting to evolving consumer preferences will ensure continued market leadership.
US Luxury Residential Market Segmentation
-
1. Type
- 1.1. Apartments and Condominiums
- 1.2. Villas and Landed Houses
-
2. City
- 2.1. New York
- 2.2. Los Angeles
- 2.3. San Francisco
- 2.4. Miami
- 2.5. Washington DC
- 2.6. Other Cities
US Luxury Residential Market Segmentation By Geography
-
1. North America
- 1.1. United States
- 1.2. Canada
- 1.3. Mexico
-
2. South America
- 2.1. Brazil
- 2.2. Argentina
- 2.3. Rest of South America
-
3. Europe
- 3.1. United Kingdom
- 3.2. Germany
- 3.3. France
- 3.4. Italy
- 3.5. Spain
- 3.6. Russia
- 3.7. Benelux
- 3.8. Nordics
- 3.9. Rest of Europe
-
4. Middle East & Africa
- 4.1. Turkey
- 4.2. Israel
- 4.3. GCC
- 4.4. North Africa
- 4.5. South Africa
- 4.6. Rest of Middle East & Africa
-
5. Asia Pacific
- 5.1. China
- 5.2. India
- 5.3. Japan
- 5.4. South Korea
- 5.5. ASEAN
- 5.6. Oceania
- 5.7. Rest of Asia Pacific
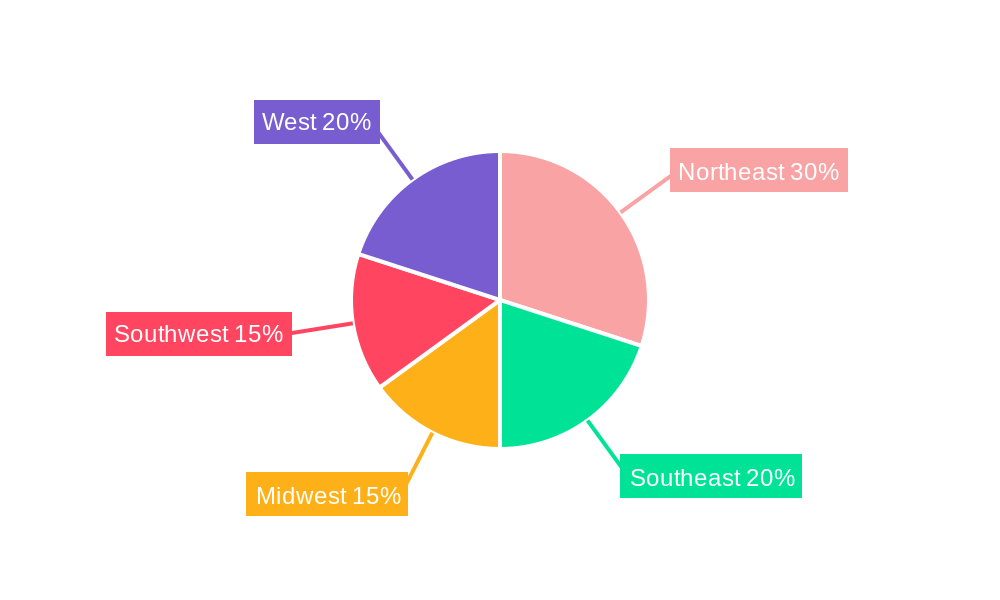
US Luxury Residential Market Regional Market Share
Geographic Coverage of US Luxury Residential Market
US Luxury Residential Market REPORT HIGHLIGHTS
| Aspects | Details |
|---|---|
| Study Period | 2020-2034 |
| Base Year | 2025 |
| Estimated Year | 2026 |
| Forecast Period | 2026-2034 |
| Historical Period | 2020-2025 |
| Growth Rate | CAGR of 6.7% from 2020-2034 |
| Segmentation |
|
Table of Contents
- 1. Introduction
- 1.1. Research Scope
- 1.2. Market Segmentation
- 1.3. Research Objective
- 1.4. Definitions and Assumptions
- 2. Executive Summary
- 2.1. Market Snapshot
- 3. Market Dynamics
- 3.1. Market Drivers
- 3.2. Market Restrains
- 3.3. Market Trends
- 3.4. Market Opportunities
- 4. Market Factor Analysis
- 4.1. Porters Five Forces
- 4.1.1. Bargaining Power of Suppliers
- 4.1.2. Bargaining Power of Buyers
- 4.1.3. Threat of New Entrants
- 4.1.4. Threat of Substitutes
- 4.1.5. Competitive Rivalry
- 4.2. PESTEL analysis
- 4.3. BCG Analysis
- 4.3.1. Stars (High Growth, High Market Share)
- 4.3.2. Cash Cows (Low Growth, High Market Share)
- 4.3.3. Question Mark (High Growth, Low Market Share)
- 4.3.4. Dogs (Low Growth, Low Market Share)
- 4.4. Ansoff Matrix Analysis
- 4.5. Supply Chain Analysis
- 4.6. Regulatory Landscape
- 4.7. Current Market Potential and Opportunity Assessment (TAM–SAM–SOM Framework)
- 4.8. MDP Analyst Note
- 4.1. Porters Five Forces
- 5. Market Analysis, Insights and Forecast 2021-2033
- 5.1. Market Analysis, Insights and Forecast - by Type
- 5.1.1. Apartments and Condominiums
- 5.1.2. Villas and Landed Houses
- 5.2. Market Analysis, Insights and Forecast - by City
- 5.2.1. New York
- 5.2.2. Los Angeles
- 5.2.3. San Francisco
- 5.2.4. Miami
- 5.2.5. Washington DC
- 5.2.6. Other Cities
- 5.3. Market Analysis, Insights and Forecast - by Region
- 5.3.1. North America
- 5.3.2. South America
- 5.3.3. Europe
- 5.3.4. Middle East & Africa
- 5.3.5. Asia Pacific
- 5.1. Market Analysis, Insights and Forecast - by Type
- 6. Global US Luxury Residential Market Analysis, Insights and Forecast, 2021-2033
- 6.1. Market Analysis, Insights and Forecast - by Type
- 6.1.1. Apartments and Condominiums
- 6.1.2. Villas and Landed Houses
- 6.2. Market Analysis, Insights and Forecast - by City
- 6.2.1. New York
- 6.2.2. Los Angeles
- 6.2.3. San Francisco
- 6.2.4. Miami
- 6.2.5. Washington DC
- 6.2.6. Other Cities
- 6.1. Market Analysis, Insights and Forecast - by Type
- 7. North America US Luxury Residential Market Analysis, Insights and Forecast, 2020-2032
- 7.1. Market Analysis, Insights and Forecast - by Type
- 7.1.1. Apartments and Condominiums
- 7.1.2. Villas and Landed Houses
- 7.2. Market Analysis, Insights and Forecast - by City
- 7.2.1. New York
- 7.2.2. Los Angeles
- 7.2.3. San Francisco
- 7.2.4. Miami
- 7.2.5. Washington DC
- 7.2.6. Other Cities
- 7.1. Market Analysis, Insights and Forecast - by Type
- 8. South America US Luxury Residential Market Analysis, Insights and Forecast, 2020-2032
- 8.1. Market Analysis, Insights and Forecast - by Type
- 8.1.1. Apartments and Condominiums
- 8.1.2. Villas and Landed Houses
- 8.2. Market Analysis, Insights and Forecast - by City
- 8.2.1. New York
- 8.2.2. Los Angeles
- 8.2.3. San Francisco
- 8.2.4. Miami
- 8.2.5. Washington DC
- 8.2.6. Other Cities
- 8.1. Market Analysis, Insights and Forecast - by Type
- 9. Europe US Luxury Residential Market Analysis, Insights and Forecast, 2020-2032
- 9.1. Market Analysis, Insights and Forecast - by Type
- 9.1.1. Apartments and Condominiums
- 9.1.2. Villas and Landed Houses
- 9.2. Market Analysis, Insights and Forecast - by City
- 9.2.1. New York
- 9.2.2. Los Angeles
- 9.2.3. San Francisco
- 9.2.4. Miami
- 9.2.5. Washington DC
- 9.2.6. Other Cities
- 9.1. Market Analysis, Insights and Forecast - by Type
- 10. Middle East & Africa US Luxury Residential Market Analysis, Insights and Forecast, 2020-2032
- 10.1. Market Analysis, Insights and Forecast - by Type
- 10.1.1. Apartments and Condominiums
- 10.1.2. Villas and Landed Houses
- 10.2. Market Analysis, Insights and Forecast - by City
- 10.2.1. New York
- 10.2.2. Los Angeles
- 10.2.3. San Francisco
- 10.2.4. Miami
- 10.2.5. Washington DC
- 10.2.6. Other Cities
- 10.1. Market Analysis, Insights and Forecast - by Type
- 11. Asia Pacific US Luxury Residential Market Analysis, Insights and Forecast, 2020-2032
- 11.1. Market Analysis, Insights and Forecast - by Type
- 11.1.1. Apartments and Condominiums
- 11.1.2. Villas and Landed Houses
- 11.2. Market Analysis, Insights and Forecast - by City
- 11.2.1. New York
- 11.2.2. Los Angeles
- 11.2.3. San Francisco
- 11.2.4. Miami
- 11.2.5. Washington DC
- 11.2.6. Other Cities
- 11.1. Market Analysis, Insights and Forecast - by Type
- 12. Competitive Analysis
- 12.1. Company Profiles
- 12.1.1 Hann Builders
- 12.1.1.1. Company Overview
- 12.1.1.2. Products
- 12.1.1.3. Company Financials
- 12.1.1.4. SWOT Analysis
- 12.1.2 McEwan Custom Homes**List Not Exhaustive
- 12.1.2.1. Company Overview
- 12.1.2.2. Products
- 12.1.2.3. Company Financials
- 12.1.2.4. SWOT Analysis
- 12.1.3 Toll Brothers Inc
- 12.1.3.1. Company Overview
- 12.1.3.2. Products
- 12.1.3.3. Company Financials
- 12.1.3.4. SWOT Analysis
- 12.1.4 Phil Kean Designs Inc
- 12.1.4.1. Company Overview
- 12.1.4.2. Products
- 12.1.4.3. Company Financials
- 12.1.4.4. SWOT Analysis
- 12.1.5 Kean Development
- 12.1.5.1. Company Overview
- 12.1.5.2. Products
- 12.1.5.3. Company Financials
- 12.1.5.4. SWOT Analysis
- 12.1.6 Calvis Wyant
- 12.1.6.1. Company Overview
- 12.1.6.2. Products
- 12.1.6.3. Company Financials
- 12.1.6.4. SWOT Analysis
- 12.1.7 Wardell Builders
- 12.1.7.1. Company Overview
- 12.1.7.2. Products
- 12.1.7.3. Company Financials
- 12.1.7.4. SWOT Analysis
- 12.1.8 D R Horton
- 12.1.8.1. Company Overview
- 12.1.8.2. Products
- 12.1.8.3. Company Financials
- 12.1.8.4. SWOT Analysis
- 12.1.9 Haley Custom Homes
- 12.1.9.1. Company Overview
- 12.1.9.2. Products
- 12.1.9.3. Company Financials
- 12.1.9.4. SWOT Analysis
- 12.1.10 Bob Thompson Homes
- 12.1.10.1. Company Overview
- 12.1.10.2. Products
- 12.1.10.3. Company Financials
- 12.1.10.4. SWOT Analysis
- 12.1.1 Hann Builders
- 12.2. Market Entropy
- 12.2.1 Company's Key Areas Served
- 12.2.2 Recent Developments
- 12.3. Company Market Share Analysis 2025
- 12.3.1 Top 5 Companies Market Share Analysis
- 12.3.2 Top 3 Companies Market Share Analysis
- 12.4. List of Potential Customers
- 13. Research Methodology
List of Figures
- Figure 1: Global US Luxury Residential Market Revenue Breakdown (billion, %) by Region 2025 & 2033
- Figure 2: North America US Luxury Residential Market Revenue (billion), by Type 2025 & 2033
- Figure 3: North America US Luxury Residential Market Revenue Share (%), by Type 2025 & 2033
- Figure 4: North America US Luxury Residential Market Revenue (billion), by City 2025 & 2033
- Figure 5: North America US Luxury Residential Market Revenue Share (%), by City 2025 & 2033
- Figure 6: North America US Luxury Residential Market Revenue (billion), by Country 2025 & 2033
- Figure 7: North America US Luxury Residential Market Revenue Share (%), by Country 2025 & 2033
- Figure 8: South America US Luxury Residential Market Revenue (billion), by Type 2025 & 2033
- Figure 9: South America US Luxury Residential Market Revenue Share (%), by Type 2025 & 2033
- Figure 10: South America US Luxury Residential Market Revenue (billion), by City 2025 & 2033
- Figure 11: South America US Luxury Residential Market Revenue Share (%), by City 2025 & 2033
- Figure 12: South America US Luxury Residential Market Revenue (billion), by Country 2025 & 2033
- Figure 13: South America US Luxury Residential Market Revenue Share (%), by Country 2025 & 2033
- Figure 14: Europe US Luxury Residential Market Revenue (billion), by Type 2025 & 2033
- Figure 15: Europe US Luxury Residential Market Revenue Share (%), by Type 2025 & 2033
- Figure 16: Europe US Luxury Residential Market Revenue (billion), by City 2025 & 2033
- Figure 17: Europe US Luxury Residential Market Revenue Share (%), by City 2025 & 2033
- Figure 18: Europe US Luxury Residential Market Revenue (billion), by Country 2025 & 2033
- Figure 19: Europe US Luxury Residential Market Revenue Share (%), by Country 2025 & 2033
- Figure 20: Middle East & Africa US Luxury Residential Market Revenue (billion), by Type 2025 & 2033
- Figure 21: Middle East & Africa US Luxury Residential Market Revenue Share (%), by Type 2025 & 2033
- Figure 22: Middle East & Africa US Luxury Residential Market Revenue (billion), by City 2025 & 2033
- Figure 23: Middle East & Africa US Luxury Residential Market Revenue Share (%), by City 2025 & 2033
- Figure 24: Middle East & Africa US Luxury Residential Market Revenue (billion), by Country 2025 & 2033
- Figure 25: Middle East & Africa US Luxury Residential Market Revenue Share (%), by Country 2025 & 2033
- Figure 26: Asia Pacific US Luxury Residential Market Revenue (billion), by Type 2025 & 2033
- Figure 27: Asia Pacific US Luxury Residential Market Revenue Share (%), by Type 2025 & 2033
- Figure 28: Asia Pacific US Luxury Residential Market Revenue (billion), by City 2025 & 2033
- Figure 29: Asia Pacific US Luxury Residential Market Revenue Share (%), by City 2025 & 2033
- Figure 30: Asia Pacific US Luxury Residential Market Revenue (billion), by Country 2025 & 2033
- Figure 31: Asia Pacific US Luxury Residential Market Revenue Share (%), by Country 2025 & 2033
List of Tables
- Table 1: Global US Luxury Residential Market Revenue billion Forecast, by Type 2020 & 2033
- Table 2: Global US Luxury Residential Market Revenue billion Forecast, by City 2020 & 2033
- Table 3: Global US Luxury Residential Market Revenue billion Forecast, by Region 2020 & 2033
- Table 4: Global US Luxury Residential Market Revenue billion Forecast, by Type 2020 & 2033
- Table 5: Global US Luxury Residential Market Revenue billion Forecast, by City 2020 & 2033
- Table 6: Global US Luxury Residential Market Revenue billion Forecast, by Country 2020 & 2033
- Table 7: United States US Luxury Residential Market Revenue (billion) Forecast, by Application 2020 & 2033
- Table 8: Canada US Luxury Residential Market Revenue (billion) Forecast, by Application 2020 & 2033
- Table 9: Mexico US Luxury Residential Market Revenue (billion) Forecast, by Application 2020 & 2033
- Table 10: Global US Luxury Residential Market Revenue billion Forecast, by Type 2020 & 2033
- Table 11: Global US Luxury Residential Market Revenue billion Forecast, by City 2020 & 2033
- Table 12: Global US Luxury Residential Market Revenue billion Forecast, by Country 2020 & 2033
- Table 13: Brazil US Luxury Residential Market Revenue (billion) Forecast, by Application 2020 & 2033
- Table 14: Argentina US Luxury Residential Market Revenue (billion) Forecast, by Application 2020 & 2033
- Table 15: Rest of South America US Luxury Residential Market Revenue (billion) Forecast, by Application 2020 & 2033
- Table 16: Global US Luxury Residential Market Revenue billion Forecast, by Type 2020 & 2033
- Table 17: Global US Luxury Residential Market Revenue billion Forecast, by City 2020 & 2033
- Table 18: Global US Luxury Residential Market Revenue billion Forecast, by Country 2020 & 2033
- Table 19: United Kingdom US Luxury Residential Market Revenue (billion) Forecast, by Application 2020 & 2033
- Table 20: Germany US Luxury Residential Market Revenue (billion) Forecast, by Application 2020 & 2033
- Table 21: France US Luxury Residential Market Revenue (billion) Forecast, by Application 2020 & 2033
- Table 22: Italy US Luxury Residential Market Revenue (billion) Forecast, by Application 2020 & 2033
- Table 23: Spain US Luxury Residential Market Revenue (billion) Forecast, by Application 2020 & 2033
- Table 24: Russia US Luxury Residential Market Revenue (billion) Forecast, by Application 2020 & 2033
- Table 25: Benelux US Luxury Residential Market Revenue (billion) Forecast, by Application 2020 & 2033
- Table 26: Nordics US Luxury Residential Market Revenue (billion) Forecast, by Application 2020 & 2033
- Table 27: Rest of Europe US Luxury Residential Market Revenue (billion) Forecast, by Application 2020 & 2033
- Table 28: Global US Luxury Residential Market Revenue billion Forecast, by Type 2020 & 2033
- Table 29: Global US Luxury Residential Market Revenue billion Forecast, by City 2020 & 2033
- Table 30: Global US Luxury Residential Market Revenue billion Forecast, by Country 2020 & 2033
- Table 31: Turkey US Luxury Residential Market Revenue (billion) Forecast, by Application 2020 & 2033
- Table 32: Israel US Luxury Residential Market Revenue (billion) Forecast, by Application 2020 & 2033
- Table 33: GCC US Luxury Residential Market Revenue (billion) Forecast, by Application 2020 & 2033
- Table 34: North Africa US Luxury Residential Market Revenue (billion) Forecast, by Application 2020 & 2033
- Table 35: South Africa US Luxury Residential Market Revenue (billion) Forecast, by Application 2020 & 2033
- Table 36: Rest of Middle East & Africa US Luxury Residential Market Revenue (billion) Forecast, by Application 2020 & 2033
- Table 37: Global US Luxury Residential Market Revenue billion Forecast, by Type 2020 & 2033
- Table 38: Global US Luxury Residential Market Revenue billion Forecast, by City 2020 & 2033
- Table 39: Global US Luxury Residential Market Revenue billion Forecast, by Country 2020 & 2033
- Table 40: China US Luxury Residential Market Revenue (billion) Forecast, by Application 2020 & 2033
- Table 41: India US Luxury Residential Market Revenue (billion) Forecast, by Application 2020 & 2033
- Table 42: Japan US Luxury Residential Market Revenue (billion) Forecast, by Application 2020 & 2033
- Table 43: South Korea US Luxury Residential Market Revenue (billion) Forecast, by Application 2020 & 2033
- Table 44: ASEAN US Luxury Residential Market Revenue (billion) Forecast, by Application 2020 & 2033
- Table 45: Oceania US Luxury Residential Market Revenue (billion) Forecast, by Application 2020 & 2033
- Table 46: Rest of Asia Pacific US Luxury Residential Market Revenue (billion) Forecast, by Application 2020 & 2033
Frequently Asked Questions
1. What is the projected Compound Annual Growth Rate (CAGR) of the US Luxury Residential Market?
The projected CAGR is approximately 6.7%.
2. Which companies are prominent players in the US Luxury Residential Market?
Key companies in the market include Hann Builders, McEwan Custom Homes**List Not Exhaustive, Toll Brothers Inc, Phil Kean Designs Inc, Kean Development, Calvis Wyant, Wardell Builders, D R Horton, Haley Custom Homes, Bob Thompson Homes.
3. What are the main segments of the US Luxury Residential Market?
The market segments include Type, City.
4. Can you provide details about the market size?
The market size is estimated to be USD 285.6 billion as of 2022.
5. What are some drivers contributing to market growth?
Energy efficiency in construction; Flexibility and customization options.
6. What are the notable trends driving market growth?
Home Automation Becoming a Pre-requisite for Luxury Real Estate.
7. Are there any restraints impacting market growth?
Limited availability of suitable land for construction; Lower quality compared to traditional construction.
8. Can you provide examples of recent developments in the market?
N/A
9. What pricing options are available for accessing the report?
Pricing options include single-user, multi-user, and enterprise licenses priced at USD 3800, USD 4500, and USD 5800 respectively.
10. Is the market size provided in terms of value or volume?
The market size is provided in terms of value, measured in billion.
11. Are there any specific market keywords associated with the report?
Yes, the market keyword associated with the report is "US Luxury Residential Market," which aids in identifying and referencing the specific market segment covered.
12. How do I determine which pricing option suits my needs best?
The pricing options vary based on user requirements and access needs. Individual users may opt for single-user licenses, while businesses requiring broader access may choose multi-user or enterprise licenses for cost-effective access to the report.
13. Are there any additional resources or data provided in the US Luxury Residential Market report?
While the report offers comprehensive insights, it's advisable to review the specific contents or supplementary materials provided to ascertain if additional resources or data are available.
14. How can I stay updated on further developments or reports in the US Luxury Residential Market?
To stay informed about further developments, trends, and reports in the US Luxury Residential Market, consider subscribing to industry newsletters, following relevant companies and organizations, or regularly checking reputable industry news sources and publications.
Methodology
Step 1 - Identification of Relevant Samples Size from Population Database


Step 2 - Approaches for Defining Global Market Size (Value, Volume* & Price*)

Note*: In applicable scenarios
Step 3 - Data Sources
Primary Research
- Web Analytics
- Survey Reports
- Research Institute
- Latest Research Reports
- Opinion Leaders
Secondary Research
- Annual Reports
- White Paper
- Latest Press Release
- Industry Association
- Paid Database
- Investor Presentations

Step 4 - Data Triangulation
Involves using different sources of information in order to increase the validity of a study
These sources are likely to be stakeholders in a program - participants, other researchers, program staff, other community members, and so on.
Then we put all data in single framework & apply various statistical tools to find out the dynamic on the market.
During the analysis stage, feedback from the stakeholder groups would be compared to determine areas of agreement as well as areas of divergence