

Key Insights
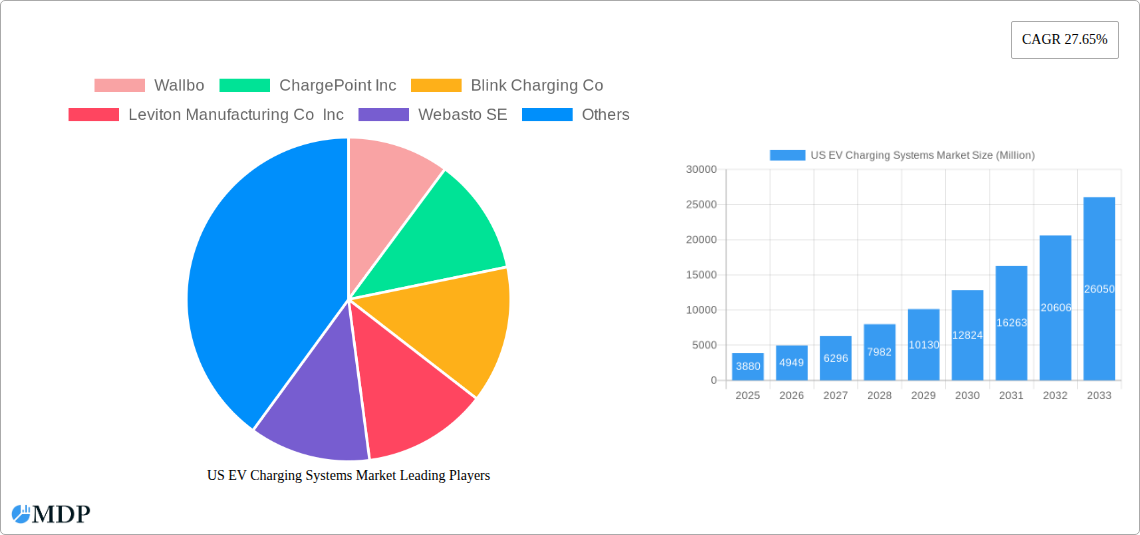
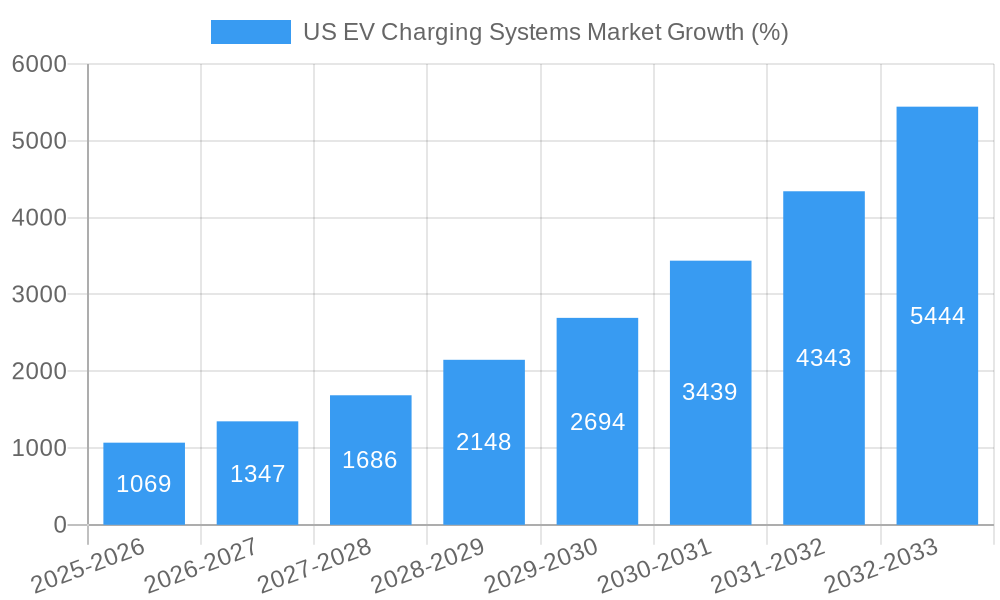
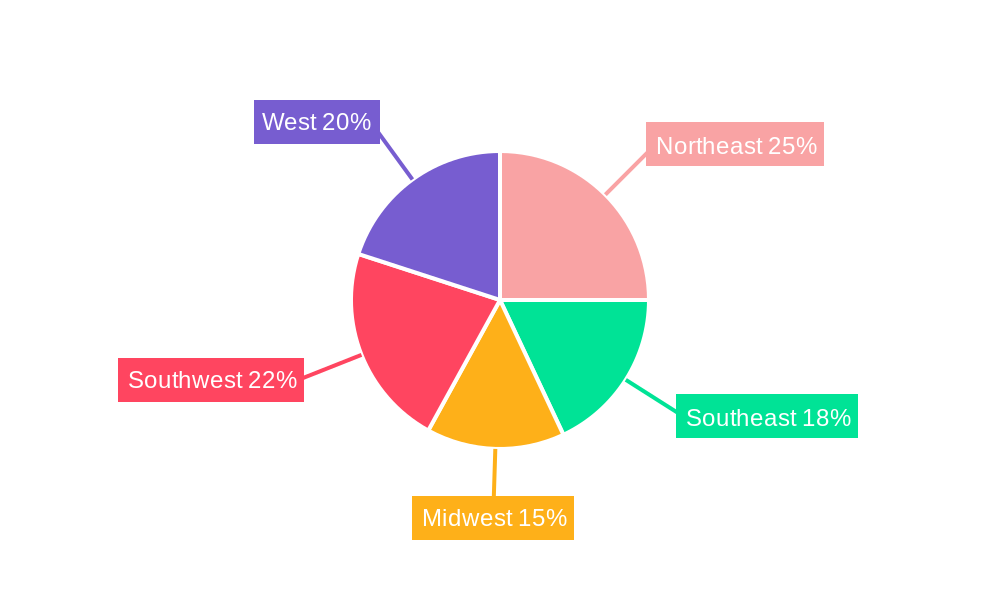
The US EV charging systems market is experiencing robust growth, driven by the increasing adoption of electric vehicles (EVs) and supportive government policies aimed at reducing carbon emissions. The market, valued at $3.88 billion in 2025, is projected to expand significantly over the forecast period (2025-2033), with a compound annual growth rate (CAGR) of 27.65%. This growth is fueled by several key factors. Firstly, the rising awareness of environmental concerns and the decreasing cost of EVs are making them increasingly attractive to consumers. Secondly, substantial investments in charging infrastructure, particularly in densely populated areas and along major highways, are improving the convenience and accessibility of EV charging. Furthermore, technological advancements in charging systems, leading to faster charging speeds and improved efficiency (e.g., the rise of rapid charging systems), are further accelerating market adoption. The market is segmented by application type (public, private residential, and commercial), equipment type (charging stations, inverters, chargers, etc.), vehicle type (passenger cars and commercial vehicles), and charging system type (slow, fast, and rapid charging). Competition is fierce among established players like ChargePoint, Blink Charging, and Tesla, as well as emerging companies, leading to innovation and price competitiveness. The geographical distribution of the market is significant, with regional variations driven by factors such as EV adoption rates, government incentives, and the density of existing infrastructure. The Northeast and West regions are expected to lead in market share due to higher EV penetration and supportive policies.
However, market growth is not without challenges. The high initial investment costs associated with installing charging stations, particularly for rapid charging systems, can hinder widespread adoption, especially in less densely populated areas. Furthermore, inconsistencies in charging standards and interoperability issues among different charging systems remain a barrier to seamless EV charging experiences. Addressing these challenges through government subsidies, standardization efforts, and technological advancements in grid integration and smart charging technologies will be crucial for sustaining the market's strong growth trajectory. The forecast period (2025-2033) presents significant opportunities for investors and stakeholders to capitalize on this rapidly expanding market segment, especially as advancements in battery technology and the overall increase in EV sales continuously drive demand.
US EV Charging Systems Market: A Comprehensive Report (2019-2033)
This comprehensive report provides an in-depth analysis of the US EV charging systems market, offering invaluable insights for stakeholders across the industry. From market dynamics and leading players to emerging opportunities and future growth projections, this report covers all key aspects of this rapidly evolving sector. The study period spans from 2019 to 2033, with 2025 serving as the base and estimated year.
US EV Charging Systems Market Market Dynamics & Concentration
The US EV charging systems market is experiencing significant growth driven by increasing EV adoption, supportive government policies, and technological advancements. Market concentration is moderate, with several key players vying for market share. Innovation is a key driver, with companies constantly developing faster, more efficient, and smarter charging solutions. The regulatory framework, while supportive, is still evolving, presenting both opportunities and challenges. Product substitution is minimal, as the focus is on improving existing technologies rather than replacing them entirely. End-user trends show a preference for convenient, fast-charging options, both at home and in public spaces. M&A activity has been robust, with several strategic acquisitions aimed at expanding market reach and technological capabilities.
- Market Share: The top 5 players hold approximately xx% of the market share in 2025, with ChargePoint Inc and Blink Charging Co among the leading players.
- M&A Deal Counts: An estimated xx M&A deals occurred in the US EV charging systems market between 2019 and 2024. These transactions primarily focused on expanding geographical reach and acquiring specialized technologies.
- Innovation Drivers: Advancements in battery technology, charging speed, and smart charging capabilities are key factors driving innovation.
- Regulatory Frameworks: Federal and state-level incentives and regulations are significantly influencing market expansion. The NEVI program is a prime example of this influence.
- End-User Trends: Consumer demand is shifting towards faster charging speeds, increased reliability, and seamless integration with smart home and grid technologies.
US EV Charging Systems Market Industry Trends & Analysis
The US EV charging systems market exhibits a robust growth trajectory, propelled by several key factors. The market is experiencing significant expansion due to the increasing adoption of electric vehicles (EVs) across the country. Technological advancements, particularly in fast and rapid charging technologies, are further boosting market growth. Consumer preferences are shifting towards convenient and reliable charging solutions, which is driving innovation and investment in public and private charging infrastructure. Competitive dynamics are intense, with established players and new entrants vying for market share through product differentiation, strategic partnerships, and technological advancements. The market is expected to witness a Compound Annual Growth Rate (CAGR) of xx% during the forecast period (2025-2033). Market penetration is projected to reach xx% by 2033, indicating a substantial increase in EV charging infrastructure deployment.
Leading Markets & Segments in US EV Charging Systems Market
The US EV charging systems market is geographically diverse, with significant growth potential across various regions. However, California and other states with strong EV adoption policies currently hold leading positions. By application type, the public charging segment is expanding rapidly, driven by government initiatives and increasing EV ownership. Within equipment types, charging stations/pillars dominate the market due to their widespread use. Passenger cars account for the largest share of the vehicle type segment, with the commercial vehicle segment expected to experience faster growth. Fast and rapid charging systems are witnessing higher demand due to their convenience and reduced charging times.
- Key Drivers (by Segment):
- Public Charging: Government funding initiatives (NEVI program), growing EV adoption, and increasing urban density.
- Private Charging (Residential): Homeowners' preferences for convenient charging solutions, coupled with increasing EV sales.
- Private Charging (Commercial): Growing adoption by businesses to attract customers and improve employee satisfaction.
- Charging Stations/Pillars: Ease of installation and broad applicability in various locations.
- Fast & Rapid Charging Systems: Reduced charging time, suitable for long-distance travel and public charging needs.
- Passenger Cars: The dominant vehicle type fueling market demand.
US EV Charging Systems Market Product Developments
Recent advancements in EV charging systems focus on improving charging speed, efficiency, and user experience. Smart charging technologies enable optimized energy management and grid integration. DC fast chargers are becoming increasingly prevalent, offering significantly reduced charging times. Manufacturers are also focusing on improving the durability and reliability of charging equipment. These product developments directly address the market's need for fast, reliable, and cost-effective charging solutions. The market is moving towards standardization to ensure interoperability between different charging systems.
Key Drivers of US EV Charging Systems Market Growth
Several key factors are propelling the growth of the US EV charging systems market. These include:
- Government Initiatives: Substantial funding from programs like the NEVI program is bolstering infrastructure development.
- Technological Advancements: Continuous innovation in charging technology is leading to faster charging speeds and improved efficiency.
- Rising EV Adoption: The increasing sales of electric vehicles directly increases demand for charging infrastructure.
- Expanding Charging Network: The creation of a robust national network facilitates wider EV adoption.
Challenges in the US EV Charging Systems Market Market
Despite the significant growth opportunities, the US EV charging systems market faces several challenges:
- Interoperability Issues: Lack of standardization can hamper seamless charging experiences across various networks.
- Infrastructure Gaps: Uneven distribution of charging stations, particularly in rural areas, limits market expansion.
- High Initial Investment Costs: The cost of installing and maintaining charging infrastructure can be a barrier for some stakeholders.
- Grid Capacity Constraints: Integrating large numbers of chargers requires sufficient grid capacity upgrades in many areas.
Emerging Opportunities in US EV Charging Systems Market
Long-term growth in the US EV charging systems market will be driven by several emerging opportunities:
- Smart Charging Technologies: Integration of AI and machine learning for optimized energy management and demand response.
- Vehicle-to-Grid (V2G) Technology: Utilizing EVs as distributed energy resources to support the power grid.
- Strategic Partnerships: Collaborations between charging providers, automakers, and energy companies will facilitate market expansion.
- Expansion into Rural Areas: Addressing the infrastructure gap in underserved regions will unlock significant growth potential.
Leading Players in the US EV Charging Systems Market Sector
- Wallbox
- ChargePoint Inc
- Blink Charging Co
- Leviton Manufacturing Co Inc
- Webasto SE
- Siemens AG
- Schneider Electric SE
- ABB Group
- Tesla Inc
- EVBox Group
- EvoCharge Inc
- Eaton Corporation
Key Milestones in US EV Charging Systems Market Industry
- March 2024: Wallbox launches Pulsar Pro North America and Supernova 180 DC fast charger, enhancing residential and commercial charging options and fast-charging infrastructure.
- January 2024: The US government announces a USD 623 million investment to expand EV charging points nationwide, focusing on rapid chargers and hydrogen fuel chargers.
- January 2024: The US Transportation Department allocates USD 148.8 million to repair and replace 4,500 EV charging stations across 20 states as part of the NEVI program.
Strategic Outlook for US EV Charging Systems Market Market
The US EV charging systems market is poised for substantial growth over the next decade. Continued government support, technological innovation, and increased EV adoption will be key drivers of this expansion. Strategic partnerships, focusing on integrating charging infrastructure with smart grids and energy management systems, will be crucial for success. The market presents significant opportunities for companies that can deliver reliable, efficient, and user-friendly charging solutions.
US EV Charging Systems Market Segmentation
-
1. Application Type
- 1.1. Public
- 1.2. Private (Residential and Commercial)
-
2. Equipment Type
- 2.1. Pillar/Charging Station/Dock
- 2.2. Inverter
-
2.3. Charger
- 2.3.1. AC Charger
- 2.3.2. DC Charger
- 2.4. Others (Cord, Port, etc.)
-
3. Vehicle Type
- 3.1. Passenger Cars
- 3.2. Commercial Vehicles
-
4. Charging System Type
- 4.1. Slow Charging Systems
- 4.2. Fast Charging Systems
- 4.3. Rapid Charging Systems
US EV Charging Systems Market Segmentation By Geography
-
1. North America
- 1.1. United States
- 1.2. Canada
- 1.3. Mexico
-
2. South America
- 2.1. Brazil
- 2.2. Argentina
- 2.3. Rest of South America
-
3. Europe
- 3.1. United Kingdom
- 3.2. Germany
- 3.3. France
- 3.4. Italy
- 3.5. Spain
- 3.6. Russia
- 3.7. Benelux
- 3.8. Nordics
- 3.9. Rest of Europe
-
4. Middle East & Africa
- 4.1. Turkey
- 4.2. Israel
- 4.3. GCC
- 4.4. North Africa
- 4.5. South Africa
- 4.6. Rest of Middle East & Africa
-
5. Asia Pacific
- 5.1. China
- 5.2. India
- 5.3. Japan
- 5.4. South Korea
- 5.5. ASEAN
- 5.6. Oceania
- 5.7. Rest of Asia Pacific
US EV Charging Systems Market REPORT HIGHLIGHTS
| Aspects | Details |
|---|---|
| Study Period | 2019-2033 |
| Base Year | 2024 |
| Estimated Year | 2025 |
| Forecast Period | 2025-2033 |
| Historical Period | 2019-2024 |
| Growth Rate | CAGR of 27.65% from 2019-2033 |
| Segmentation |
|
Table of Contents
- 1. Introduction
- 1.1. Research Scope
- 1.2. Market Segmentation
- 1.3. Research Methodology
- 1.4. Definitions and Assumptions
- 2. Executive Summary
- 2.1. Introduction
- 3. Market Dynamics
- 3.1. Introduction
- 3.2. Market Drivers
- 3.2.1. Aggressive Government Focus to Promote the Adoption of Electric Vehicles Fosters the Growth of the Market
- 3.3. Market Restrains
- 3.3.1. High Cost of Setting Up EV Charging Stations Hampers the Growth of the Market
- 3.4. Market Trends
- 3.4.1. Passengers Cars Segment to Gain Traction during the Forecast Period
- 4. Market Factor Analysis
- 4.1. Porters Five Forces
- 4.2. Supply/Value Chain
- 4.3. PESTEL analysis
- 4.4. Market Entropy
- 4.5. Patent/Trademark Analysis
- 5. Global US EV Charging Systems Market Analysis, Insights and Forecast, 2019-2031
- 5.1. Market Analysis, Insights and Forecast - by Application Type
- 5.1.1. Public
- 5.1.2. Private (Residential and Commercial)
- 5.2. Market Analysis, Insights and Forecast - by Equipment Type
- 5.2.1. Pillar/Charging Station/Dock
- 5.2.2. Inverter
- 5.2.3. Charger
- 5.2.3.1. AC Charger
- 5.2.3.2. DC Charger
- 5.2.4. Others (Cord, Port, etc.)
- 5.3. Market Analysis, Insights and Forecast - by Vehicle Type
- 5.3.1. Passenger Cars
- 5.3.2. Commercial Vehicles
- 5.4. Market Analysis, Insights and Forecast - by Charging System Type
- 5.4.1. Slow Charging Systems
- 5.4.2. Fast Charging Systems
- 5.4.3. Rapid Charging Systems
- 5.5. Market Analysis, Insights and Forecast - by Region
- 5.5.1. North America
- 5.5.2. South America
- 5.5.3. Europe
- 5.5.4. Middle East & Africa
- 5.5.5. Asia Pacific
- 5.1. Market Analysis, Insights and Forecast - by Application Type
- 6. North America US EV Charging Systems Market Analysis, Insights and Forecast, 2019-2031
- 6.1. Market Analysis, Insights and Forecast - by Application Type
- 6.1.1. Public
- 6.1.2. Private (Residential and Commercial)
- 6.2. Market Analysis, Insights and Forecast - by Equipment Type
- 6.2.1. Pillar/Charging Station/Dock
- 6.2.2. Inverter
- 6.2.3. Charger
- 6.2.3.1. AC Charger
- 6.2.3.2. DC Charger
- 6.2.4. Others (Cord, Port, etc.)
- 6.3. Market Analysis, Insights and Forecast - by Vehicle Type
- 6.3.1. Passenger Cars
- 6.3.2. Commercial Vehicles
- 6.4. Market Analysis, Insights and Forecast - by Charging System Type
- 6.4.1. Slow Charging Systems
- 6.4.2. Fast Charging Systems
- 6.4.3. Rapid Charging Systems
- 6.1. Market Analysis, Insights and Forecast - by Application Type
- 7. South America US EV Charging Systems Market Analysis, Insights and Forecast, 2019-2031
- 7.1. Market Analysis, Insights and Forecast - by Application Type
- 7.1.1. Public
- 7.1.2. Private (Residential and Commercial)
- 7.2. Market Analysis, Insights and Forecast - by Equipment Type
- 7.2.1. Pillar/Charging Station/Dock
- 7.2.2. Inverter
- 7.2.3. Charger
- 7.2.3.1. AC Charger
- 7.2.3.2. DC Charger
- 7.2.4. Others (Cord, Port, etc.)
- 7.3. Market Analysis, Insights and Forecast - by Vehicle Type
- 7.3.1. Passenger Cars
- 7.3.2. Commercial Vehicles
- 7.4. Market Analysis, Insights and Forecast - by Charging System Type
- 7.4.1. Slow Charging Systems
- 7.4.2. Fast Charging Systems
- 7.4.3. Rapid Charging Systems
- 7.1. Market Analysis, Insights and Forecast - by Application Type
- 8. Europe US EV Charging Systems Market Analysis, Insights and Forecast, 2019-2031
- 8.1. Market Analysis, Insights and Forecast - by Application Type
- 8.1.1. Public
- 8.1.2. Private (Residential and Commercial)
- 8.2. Market Analysis, Insights and Forecast - by Equipment Type
- 8.2.1. Pillar/Charging Station/Dock
- 8.2.2. Inverter
- 8.2.3. Charger
- 8.2.3.1. AC Charger
- 8.2.3.2. DC Charger
- 8.2.4. Others (Cord, Port, etc.)
- 8.3. Market Analysis, Insights and Forecast - by Vehicle Type
- 8.3.1. Passenger Cars
- 8.3.2. Commercial Vehicles
- 8.4. Market Analysis, Insights and Forecast - by Charging System Type
- 8.4.1. Slow Charging Systems
- 8.4.2. Fast Charging Systems
- 8.4.3. Rapid Charging Systems
- 8.1. Market Analysis, Insights and Forecast - by Application Type
- 9. Middle East & Africa US EV Charging Systems Market Analysis, Insights and Forecast, 2019-2031
- 9.1. Market Analysis, Insights and Forecast - by Application Type
- 9.1.1. Public
- 9.1.2. Private (Residential and Commercial)
- 9.2. Market Analysis, Insights and Forecast - by Equipment Type
- 9.2.1. Pillar/Charging Station/Dock
- 9.2.2. Inverter
- 9.2.3. Charger
- 9.2.3.1. AC Charger
- 9.2.3.2. DC Charger
- 9.2.4. Others (Cord, Port, etc.)
- 9.3. Market Analysis, Insights and Forecast - by Vehicle Type
- 9.3.1. Passenger Cars
- 9.3.2. Commercial Vehicles
- 9.4. Market Analysis, Insights and Forecast - by Charging System Type
- 9.4.1. Slow Charging Systems
- 9.4.2. Fast Charging Systems
- 9.4.3. Rapid Charging Systems
- 9.1. Market Analysis, Insights and Forecast - by Application Type
- 10. Asia Pacific US EV Charging Systems Market Analysis, Insights and Forecast, 2019-2031
- 10.1. Market Analysis, Insights and Forecast - by Application Type
- 10.1.1. Public
- 10.1.2. Private (Residential and Commercial)
- 10.2. Market Analysis, Insights and Forecast - by Equipment Type
- 10.2.1. Pillar/Charging Station/Dock
- 10.2.2. Inverter
- 10.2.3. Charger
- 10.2.3.1. AC Charger
- 10.2.3.2. DC Charger
- 10.2.4. Others (Cord, Port, etc.)
- 10.3. Market Analysis, Insights and Forecast - by Vehicle Type
- 10.3.1. Passenger Cars
- 10.3.2. Commercial Vehicles
- 10.4. Market Analysis, Insights and Forecast - by Charging System Type
- 10.4.1. Slow Charging Systems
- 10.4.2. Fast Charging Systems
- 10.4.3. Rapid Charging Systems
- 10.1. Market Analysis, Insights and Forecast - by Application Type
- 11. Northeast US EV Charging Systems Market Analysis, Insights and Forecast, 2019-2031
- 12. Southeast US EV Charging Systems Market Analysis, Insights and Forecast, 2019-2031
- 13. Midwest US EV Charging Systems Market Analysis, Insights and Forecast, 2019-2031
- 14. Southwest US EV Charging Systems Market Analysis, Insights and Forecast, 2019-2031
- 15. West US EV Charging Systems Market Analysis, Insights and Forecast, 2019-2031
- 16. Competitive Analysis
- 16.1. Global Market Share Analysis 2024
- 16.2. Company Profiles
- 16.2.1 Wallbo
- 16.2.1.1. Overview
- 16.2.1.2. Products
- 16.2.1.3. SWOT Analysis
- 16.2.1.4. Recent Developments
- 16.2.1.5. Financials (Based on Availability)
- 16.2.2 ChargePoint Inc
- 16.2.2.1. Overview
- 16.2.2.2. Products
- 16.2.2.3. SWOT Analysis
- 16.2.2.4. Recent Developments
- 16.2.2.5. Financials (Based on Availability)
- 16.2.3 Blink Charging Co
- 16.2.3.1. Overview
- 16.2.3.2. Products
- 16.2.3.3. SWOT Analysis
- 16.2.3.4. Recent Developments
- 16.2.3.5. Financials (Based on Availability)
- 16.2.4 Leviton Manufacturing Co Inc
- 16.2.4.1. Overview
- 16.2.4.2. Products
- 16.2.4.3. SWOT Analysis
- 16.2.4.4. Recent Developments
- 16.2.4.5. Financials (Based on Availability)
- 16.2.5 Webasto SE
- 16.2.5.1. Overview
- 16.2.5.2. Products
- 16.2.5.3. SWOT Analysis
- 16.2.5.4. Recent Developments
- 16.2.5.5. Financials (Based on Availability)
- 16.2.6 Siemens AG
- 16.2.6.1. Overview
- 16.2.6.2. Products
- 16.2.6.3. SWOT Analysis
- 16.2.6.4. Recent Developments
- 16.2.6.5. Financials (Based on Availability)
- 16.2.7 Schneider Electric SE
- 16.2.7.1. Overview
- 16.2.7.2. Products
- 16.2.7.3. SWOT Analysis
- 16.2.7.4. Recent Developments
- 16.2.7.5. Financials (Based on Availability)
- 16.2.8 ABB Group
- 16.2.8.1. Overview
- 16.2.8.2. Products
- 16.2.8.3. SWOT Analysis
- 16.2.8.4. Recent Developments
- 16.2.8.5. Financials (Based on Availability)
- 16.2.9 Tesla Inc
- 16.2.9.1. Overview
- 16.2.9.2. Products
- 16.2.9.3. SWOT Analysis
- 16.2.9.4. Recent Developments
- 16.2.9.5. Financials (Based on Availability)
- 16.2.10 EVBox Group
- 16.2.10.1. Overview
- 16.2.10.2. Products
- 16.2.10.3. SWOT Analysis
- 16.2.10.4. Recent Developments
- 16.2.10.5. Financials (Based on Availability)
- 16.2.11 EvoCharge Inc
- 16.2.11.1. Overview
- 16.2.11.2. Products
- 16.2.11.3. SWOT Analysis
- 16.2.11.4. Recent Developments
- 16.2.11.5. Financials (Based on Availability)
- 16.2.12 Eaton Corporation
- 16.2.12.1. Overview
- 16.2.12.2. Products
- 16.2.12.3. SWOT Analysis
- 16.2.12.4. Recent Developments
- 16.2.12.5. Financials (Based on Availability)
- 16.2.1 Wallbo
List of Figures
- Figure 1: Global US EV Charging Systems Market Revenue Breakdown (Million, %) by Region 2024 & 2032
- Figure 2: United states US EV Charging Systems Market Revenue (Million), by Country 2024 & 2032
- Figure 3: United states US EV Charging Systems Market Revenue Share (%), by Country 2024 & 2032
- Figure 4: North America US EV Charging Systems Market Revenue (Million), by Application Type 2024 & 2032
- Figure 5: North America US EV Charging Systems Market Revenue Share (%), by Application Type 2024 & 2032
- Figure 6: North America US EV Charging Systems Market Revenue (Million), by Equipment Type 2024 & 2032
- Figure 7: North America US EV Charging Systems Market Revenue Share (%), by Equipment Type 2024 & 2032
- Figure 8: North America US EV Charging Systems Market Revenue (Million), by Vehicle Type 2024 & 2032
- Figure 9: North America US EV Charging Systems Market Revenue Share (%), by Vehicle Type 2024 & 2032
- Figure 10: North America US EV Charging Systems Market Revenue (Million), by Charging System Type 2024 & 2032
- Figure 11: North America US EV Charging Systems Market Revenue Share (%), by Charging System Type 2024 & 2032
- Figure 12: North America US EV Charging Systems Market Revenue (Million), by Country 2024 & 2032
- Figure 13: North America US EV Charging Systems Market Revenue Share (%), by Country 2024 & 2032
- Figure 14: South America US EV Charging Systems Market Revenue (Million), by Application Type 2024 & 2032
- Figure 15: South America US EV Charging Systems Market Revenue Share (%), by Application Type 2024 & 2032
- Figure 16: South America US EV Charging Systems Market Revenue (Million), by Equipment Type 2024 & 2032
- Figure 17: South America US EV Charging Systems Market Revenue Share (%), by Equipment Type 2024 & 2032
- Figure 18: South America US EV Charging Systems Market Revenue (Million), by Vehicle Type 2024 & 2032
- Figure 19: South America US EV Charging Systems Market Revenue Share (%), by Vehicle Type 2024 & 2032
- Figure 20: South America US EV Charging Systems Market Revenue (Million), by Charging System Type 2024 & 2032
- Figure 21: South America US EV Charging Systems Market Revenue Share (%), by Charging System Type 2024 & 2032
- Figure 22: South America US EV Charging Systems Market Revenue (Million), by Country 2024 & 2032
- Figure 23: South America US EV Charging Systems Market Revenue Share (%), by Country 2024 & 2032
- Figure 24: Europe US EV Charging Systems Market Revenue (Million), by Application Type 2024 & 2032
- Figure 25: Europe US EV Charging Systems Market Revenue Share (%), by Application Type 2024 & 2032
- Figure 26: Europe US EV Charging Systems Market Revenue (Million), by Equipment Type 2024 & 2032
- Figure 27: Europe US EV Charging Systems Market Revenue Share (%), by Equipment Type 2024 & 2032
- Figure 28: Europe US EV Charging Systems Market Revenue (Million), by Vehicle Type 2024 & 2032
- Figure 29: Europe US EV Charging Systems Market Revenue Share (%), by Vehicle Type 2024 & 2032
- Figure 30: Europe US EV Charging Systems Market Revenue (Million), by Charging System Type 2024 & 2032
- Figure 31: Europe US EV Charging Systems Market Revenue Share (%), by Charging System Type 2024 & 2032
- Figure 32: Europe US EV Charging Systems Market Revenue (Million), by Country 2024 & 2032
- Figure 33: Europe US EV Charging Systems Market Revenue Share (%), by Country 2024 & 2032
- Figure 34: Middle East & Africa US EV Charging Systems Market Revenue (Million), by Application Type 2024 & 2032
- Figure 35: Middle East & Africa US EV Charging Systems Market Revenue Share (%), by Application Type 2024 & 2032
- Figure 36: Middle East & Africa US EV Charging Systems Market Revenue (Million), by Equipment Type 2024 & 2032
- Figure 37: Middle East & Africa US EV Charging Systems Market Revenue Share (%), by Equipment Type 2024 & 2032
- Figure 38: Middle East & Africa US EV Charging Systems Market Revenue (Million), by Vehicle Type 2024 & 2032
- Figure 39: Middle East & Africa US EV Charging Systems Market Revenue Share (%), by Vehicle Type 2024 & 2032
- Figure 40: Middle East & Africa US EV Charging Systems Market Revenue (Million), by Charging System Type 2024 & 2032
- Figure 41: Middle East & Africa US EV Charging Systems Market Revenue Share (%), by Charging System Type 2024 & 2032
- Figure 42: Middle East & Africa US EV Charging Systems Market Revenue (Million), by Country 2024 & 2032
- Figure 43: Middle East & Africa US EV Charging Systems Market Revenue Share (%), by Country 2024 & 2032
- Figure 44: Asia Pacific US EV Charging Systems Market Revenue (Million), by Application Type 2024 & 2032
- Figure 45: Asia Pacific US EV Charging Systems Market Revenue Share (%), by Application Type 2024 & 2032
- Figure 46: Asia Pacific US EV Charging Systems Market Revenue (Million), by Equipment Type 2024 & 2032
- Figure 47: Asia Pacific US EV Charging Systems Market Revenue Share (%), by Equipment Type 2024 & 2032
- Figure 48: Asia Pacific US EV Charging Systems Market Revenue (Million), by Vehicle Type 2024 & 2032
- Figure 49: Asia Pacific US EV Charging Systems Market Revenue Share (%), by Vehicle Type 2024 & 2032
- Figure 50: Asia Pacific US EV Charging Systems Market Revenue (Million), by Charging System Type 2024 & 2032
- Figure 51: Asia Pacific US EV Charging Systems Market Revenue Share (%), by Charging System Type 2024 & 2032
- Figure 52: Asia Pacific US EV Charging Systems Market Revenue (Million), by Country 2024 & 2032
- Figure 53: Asia Pacific US EV Charging Systems Market Revenue Share (%), by Country 2024 & 2032
List of Tables
- Table 1: Global US EV Charging Systems Market Revenue Million Forecast, by Region 2019 & 2032
- Table 2: Global US EV Charging Systems Market Revenue Million Forecast, by Application Type 2019 & 2032
- Table 3: Global US EV Charging Systems Market Revenue Million Forecast, by Equipment Type 2019 & 2032
- Table 4: Global US EV Charging Systems Market Revenue Million Forecast, by Vehicle Type 2019 & 2032
- Table 5: Global US EV Charging Systems Market Revenue Million Forecast, by Charging System Type 2019 & 2032
- Table 6: Global US EV Charging Systems Market Revenue Million Forecast, by Region 2019 & 2032
- Table 7: Global US EV Charging Systems Market Revenue Million Forecast, by Country 2019 & 2032
- Table 8: Northeast US EV Charging Systems Market Revenue (Million) Forecast, by Application 2019 & 2032
- Table 9: Southeast US EV Charging Systems Market Revenue (Million) Forecast, by Application 2019 & 2032
- Table 10: Midwest US EV Charging Systems Market Revenue (Million) Forecast, by Application 2019 & 2032
- Table 11: Southwest US EV Charging Systems Market Revenue (Million) Forecast, by Application 2019 & 2032
- Table 12: West US EV Charging Systems Market Revenue (Million) Forecast, by Application 2019 & 2032
- Table 13: Global US EV Charging Systems Market Revenue Million Forecast, by Application Type 2019 & 2032
- Table 14: Global US EV Charging Systems Market Revenue Million Forecast, by Equipment Type 2019 & 2032
- Table 15: Global US EV Charging Systems Market Revenue Million Forecast, by Vehicle Type 2019 & 2032
- Table 16: Global US EV Charging Systems Market Revenue Million Forecast, by Charging System Type 2019 & 2032
- Table 17: Global US EV Charging Systems Market Revenue Million Forecast, by Country 2019 & 2032
- Table 18: United States US EV Charging Systems Market Revenue (Million) Forecast, by Application 2019 & 2032
- Table 19: Canada US EV Charging Systems Market Revenue (Million) Forecast, by Application 2019 & 2032
- Table 20: Mexico US EV Charging Systems Market Revenue (Million) Forecast, by Application 2019 & 2032
- Table 21: Global US EV Charging Systems Market Revenue Million Forecast, by Application Type 2019 & 2032
- Table 22: Global US EV Charging Systems Market Revenue Million Forecast, by Equipment Type 2019 & 2032
- Table 23: Global US EV Charging Systems Market Revenue Million Forecast, by Vehicle Type 2019 & 2032
- Table 24: Global US EV Charging Systems Market Revenue Million Forecast, by Charging System Type 2019 & 2032
- Table 25: Global US EV Charging Systems Market Revenue Million Forecast, by Country 2019 & 2032
- Table 26: Brazil US EV Charging Systems Market Revenue (Million) Forecast, by Application 2019 & 2032
- Table 27: Argentina US EV Charging Systems Market Revenue (Million) Forecast, by Application 2019 & 2032
- Table 28: Rest of South America US EV Charging Systems Market Revenue (Million) Forecast, by Application 2019 & 2032
- Table 29: Global US EV Charging Systems Market Revenue Million Forecast, by Application Type 2019 & 2032
- Table 30: Global US EV Charging Systems Market Revenue Million Forecast, by Equipment Type 2019 & 2032
- Table 31: Global US EV Charging Systems Market Revenue Million Forecast, by Vehicle Type 2019 & 2032
- Table 32: Global US EV Charging Systems Market Revenue Million Forecast, by Charging System Type 2019 & 2032
- Table 33: Global US EV Charging Systems Market Revenue Million Forecast, by Country 2019 & 2032
- Table 34: United Kingdom US EV Charging Systems Market Revenue (Million) Forecast, by Application 2019 & 2032
- Table 35: Germany US EV Charging Systems Market Revenue (Million) Forecast, by Application 2019 & 2032
- Table 36: France US EV Charging Systems Market Revenue (Million) Forecast, by Application 2019 & 2032
- Table 37: Italy US EV Charging Systems Market Revenue (Million) Forecast, by Application 2019 & 2032
- Table 38: Spain US EV Charging Systems Market Revenue (Million) Forecast, by Application 2019 & 2032
- Table 39: Russia US EV Charging Systems Market Revenue (Million) Forecast, by Application 2019 & 2032
- Table 40: Benelux US EV Charging Systems Market Revenue (Million) Forecast, by Application 2019 & 2032
- Table 41: Nordics US EV Charging Systems Market Revenue (Million) Forecast, by Application 2019 & 2032
- Table 42: Rest of Europe US EV Charging Systems Market Revenue (Million) Forecast, by Application 2019 & 2032
- Table 43: Global US EV Charging Systems Market Revenue Million Forecast, by Application Type 2019 & 2032
- Table 44: Global US EV Charging Systems Market Revenue Million Forecast, by Equipment Type 2019 & 2032
- Table 45: Global US EV Charging Systems Market Revenue Million Forecast, by Vehicle Type 2019 & 2032
- Table 46: Global US EV Charging Systems Market Revenue Million Forecast, by Charging System Type 2019 & 2032
- Table 47: Global US EV Charging Systems Market Revenue Million Forecast, by Country 2019 & 2032
- Table 48: Turkey US EV Charging Systems Market Revenue (Million) Forecast, by Application 2019 & 2032
- Table 49: Israel US EV Charging Systems Market Revenue (Million) Forecast, by Application 2019 & 2032
- Table 50: GCC US EV Charging Systems Market Revenue (Million) Forecast, by Application 2019 & 2032
- Table 51: North Africa US EV Charging Systems Market Revenue (Million) Forecast, by Application 2019 & 2032
- Table 52: South Africa US EV Charging Systems Market Revenue (Million) Forecast, by Application 2019 & 2032
- Table 53: Rest of Middle East & Africa US EV Charging Systems Market Revenue (Million) Forecast, by Application 2019 & 2032
- Table 54: Global US EV Charging Systems Market Revenue Million Forecast, by Application Type 2019 & 2032
- Table 55: Global US EV Charging Systems Market Revenue Million Forecast, by Equipment Type 2019 & 2032
- Table 56: Global US EV Charging Systems Market Revenue Million Forecast, by Vehicle Type 2019 & 2032
- Table 57: Global US EV Charging Systems Market Revenue Million Forecast, by Charging System Type 2019 & 2032
- Table 58: Global US EV Charging Systems Market Revenue Million Forecast, by Country 2019 & 2032
- Table 59: China US EV Charging Systems Market Revenue (Million) Forecast, by Application 2019 & 2032
- Table 60: India US EV Charging Systems Market Revenue (Million) Forecast, by Application 2019 & 2032
- Table 61: Japan US EV Charging Systems Market Revenue (Million) Forecast, by Application 2019 & 2032
- Table 62: South Korea US EV Charging Systems Market Revenue (Million) Forecast, by Application 2019 & 2032
- Table 63: ASEAN US EV Charging Systems Market Revenue (Million) Forecast, by Application 2019 & 2032
- Table 64: Oceania US EV Charging Systems Market Revenue (Million) Forecast, by Application 2019 & 2032
- Table 65: Rest of Asia Pacific US EV Charging Systems Market Revenue (Million) Forecast, by Application 2019 & 2032
Frequently Asked Questions
1. What is the projected Compound Annual Growth Rate (CAGR) of the US EV Charging Systems Market?
The projected CAGR is approximately 27.65%.
2. Which companies are prominent players in the US EV Charging Systems Market?
Key companies in the market include Wallbo, ChargePoint Inc, Blink Charging Co, Leviton Manufacturing Co Inc, Webasto SE, Siemens AG, Schneider Electric SE, ABB Group, Tesla Inc, EVBox Group, EvoCharge Inc, Eaton Corporation.
3. What are the main segments of the US EV Charging Systems Market?
The market segments include Application Type, Equipment Type, Vehicle Type, Charging System Type.
4. Can you provide details about the market size?
The market size is estimated to be USD 3.88 Million as of 2022.
5. What are some drivers contributing to market growth?
Aggressive Government Focus to Promote the Adoption of Electric Vehicles Fosters the Growth of the Market.
6. What are the notable trends driving market growth?
Passengers Cars Segment to Gain Traction during the Forecast Period.
7. Are there any restraints impacting market growth?
High Cost of Setting Up EV Charging Stations Hampers the Growth of the Market.
8. Can you provide examples of recent developments in the market?
In March 2024, Wallbox announced the delivery of its smart chargers, Pulsar Pro North America, designed specifically for residential and commercial properties, which will be available to customers from the United States. Apart from the latest innovation, Wallbox also launched Supernova 180, its DC-fast EV charger, to assist in improving the state of the fast charging ecosystem in the United States.
9. What pricing options are available for accessing the report?
Pricing options include single-user, multi-user, and enterprise licenses priced at USD 3800, USD 4500, and USD 5800 respectively.
10. Is the market size provided in terms of value or volume?
The market size is provided in terms of value, measured in Million.
11. Are there any specific market keywords associated with the report?
Yes, the market keyword associated with the report is "US EV Charging Systems Market," which aids in identifying and referencing the specific market segment covered.
12. How do I determine which pricing option suits my needs best?
The pricing options vary based on user requirements and access needs. Individual users may opt for single-user licenses, while businesses requiring broader access may choose multi-user or enterprise licenses for cost-effective access to the report.
13. Are there any additional resources or data provided in the US EV Charging Systems Market report?
While the report offers comprehensive insights, it's advisable to review the specific contents or supplementary materials provided to ascertain if additional resources or data are available.
14. How can I stay updated on further developments or reports in the US EV Charging Systems Market?
To stay informed about further developments, trends, and reports in the US EV Charging Systems Market, consider subscribing to industry newsletters, following relevant companies and organizations, or regularly checking reputable industry news sources and publications.
Methodology
Step 1 - Identification of Relevant Samples Size from Population Database


Step 2 - Approaches for Defining Global Market Size (Value, Volume* & Price*)

Note*: In applicable scenarios
Step 3 - Data Sources
Primary Research
- Web Analytics
- Survey Reports
- Research Institute
- Latest Research Reports
- Opinion Leaders
Secondary Research
- Annual Reports
- White Paper
- Latest Press Release
- Industry Association
- Paid Database
- Investor Presentations

Step 4 - Data Triangulation
Involves using different sources of information in order to increase the validity of a study
These sources are likely to be stakeholders in a program - participants, other researchers, program staff, other community members, and so on.
Then we put all data in single framework & apply various statistical tools to find out the dynamic on the market.
During the analysis stage, feedback from the stakeholder groups would be compared to determine areas of agreement as well as areas of divergence
