

Key Insights
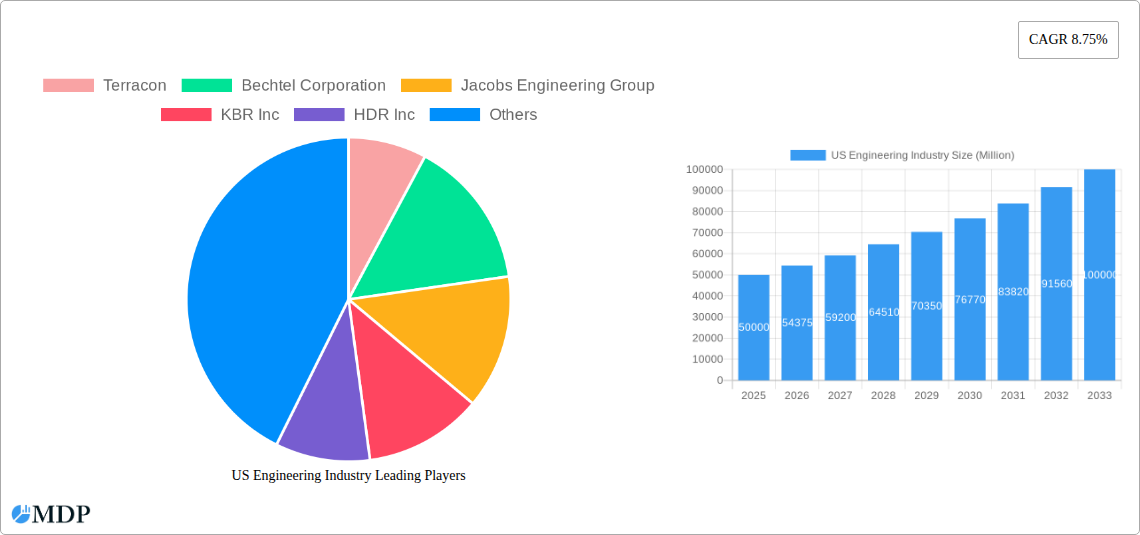
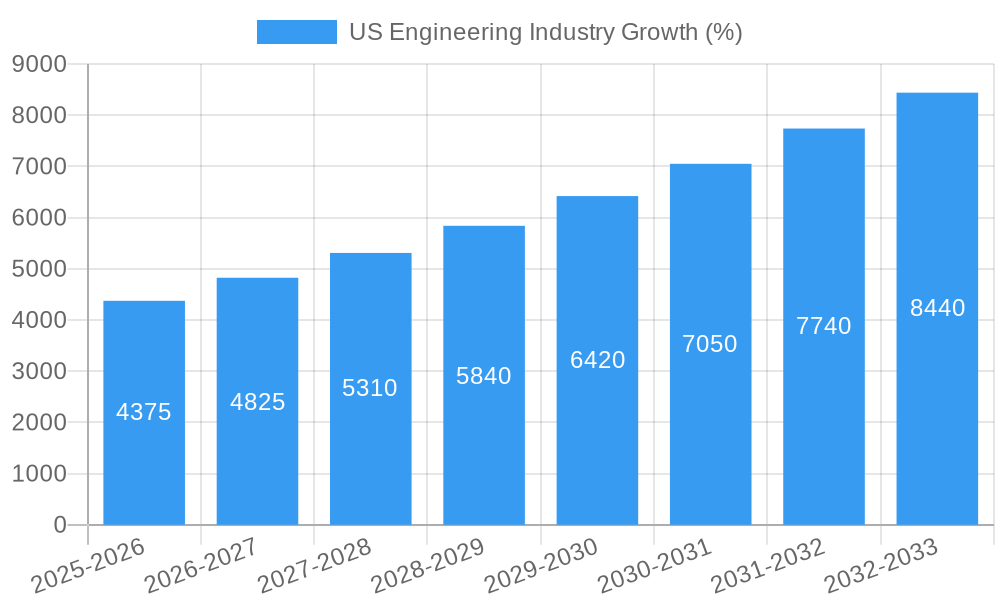
The US engineering industry, a cornerstone of national infrastructure and technological advancement, is experiencing robust growth, projected to maintain a Compound Annual Growth Rate (CAGR) of 8.75% from 2025 to 2033. This expansion is fueled by several key drivers. Significant investments in infrastructure projects, spurred by government initiatives and private sector spending, are creating substantial demand for engineering services across various disciplines. Furthermore, the burgeoning renewable energy sector, particularly in areas like wind and solar power, necessitates extensive engineering expertise for design, construction, and maintenance. The ongoing digital transformation within the industry, encompassing the adoption of Building Information Modeling (BIM) and other advanced technologies, is enhancing efficiency and driving further growth. Finally, increasing urbanization and the need for sustainable infrastructure solutions are also contributing factors. Regional variations exist, with the West and Northeast regions expected to exhibit particularly strong growth due to concentrated technological hubs and large-scale infrastructure developments.
However, the industry faces certain challenges. Supply chain disruptions and skilled labor shortages pose significant headwinds, impacting project timelines and costs. Furthermore, fluctuating material prices and regulatory complexities can influence profitability and investment decisions. Despite these restraints, the long-term outlook for the US engineering industry remains positive, driven by consistent demand across diverse end-user industries, including construction, oil & gas, manufacturing, utilities, and transportation. The continued focus on infrastructure modernization and technological innovation will shape the industry's trajectory in the coming years, presenting both opportunities and challenges for engineering firms of all sizes. Competition is intense, with major players like Bechtel, AECOM, and Jacobs Engineering Group vying for market share, while smaller, specialized firms carve out niches within specific engineering disciplines and geographic locations.
US Engineering Industry Market Report: 2019-2033 Forecast
This comprehensive report provides an in-depth analysis of the US Engineering industry, offering invaluable insights for stakeholders seeking to navigate the evolving landscape. With a focus on market dynamics, key players, and future trends, this report covers the period from 2019 to 2033, with a base year of 2025 and a forecast period spanning 2025-2033. The report leverages robust data analysis to uncover actionable opportunities and challenges, empowering informed decision-making. This detailed analysis encompasses key market segments, including Civil, Mechanical, Electrical, and Environmental engineering disciplines, across diverse end-user industries like Construction, Oil & Gas, Manufacturing, Utilities, and Transportation. The report highlights leading players such as Bechtel Corporation, AECOM, and Jacobs Engineering Group, providing a 360-degree view of this dynamic sector.
High-impact keywords: US Engineering Industry, Market Report, Market Analysis, Market Forecast, 2019-2033, Engineering Disciplines, Civil Engineering, Mechanical Engineering, Electrical Engineering, Environmental Engineering, Construction, Oil & Gas, Manufacturing, Utilities, Transportation, Bechtel, AECOM, Jacobs Engineering, Market Size, Market Share, Market Growth, Industry Trends, Competitive Landscape.
US Engineering Industry Market Dynamics & Concentration
The US Engineering industry exhibits a moderately concentrated market structure, with a handful of large multinational firms controlling a significant portion of the overall market share. In 2024, the top 10 firms collectively held an estimated xx% market share. Market concentration is influenced by several factors, including significant barriers to entry (high capital requirements, specialized expertise), economies of scale, and extensive client relationships cultivated over decades.
- Innovation Drivers: Technological advancements in areas such as Building Information Modeling (BIM), automation, and sustainable engineering practices are driving innovation and shaping market competition.
- Regulatory Frameworks: Stringent environmental regulations and safety standards play a crucial role in shaping industry practices and influencing project costs. The increasing emphasis on sustainability is also driving demand for environmentally friendly engineering solutions.
- Product Substitutes: While direct substitutes are limited, technological advancements are constantly pushing the boundaries of traditional engineering solutions. This creates a dynamic environment that requires continuous adaptation and innovation.
- End-User Trends: Growth in infrastructure development, particularly in renewable energy and transportation sectors, is a major driver of industry growth. The increasing adoption of digital technologies by end-users is transforming the engineering workflow and collaboration methods.
- M&A Activities: The past five years have seen a significant number of mergers and acquisitions (M&As), primarily driven by strategic expansion and the consolidation of market share. An estimated xx M&A deals were recorded between 2019 and 2024, with an estimated total transaction value of $xx Million.
US Engineering Industry Industry Trends & Analysis
The US Engineering industry is experiencing robust growth driven by several key factors. The compound annual growth rate (CAGR) for the period 2019-2024 was estimated at xx%, and this momentum is expected to continue, with a projected CAGR of xx% from 2025 to 2033. This growth is fueled by increasing government spending on infrastructure projects, rising demand for renewable energy solutions, and the ongoing expansion of manufacturing and industrial sectors. Technological disruptions, such as the widespread adoption of digital engineering tools and the rise of automation, are transforming project delivery methods and enhancing efficiency. Consumer preferences are shifting towards sustainable and environmentally friendly engineering solutions, creating new opportunities for companies that can cater to these demands. The industry is characterized by intense competition, with firms constantly vying for market share through innovation, strategic partnerships, and geographic expansion. Market penetration rates vary significantly across different engineering disciplines and end-user industries.
Leading Markets & Segments in US Engineering Industry
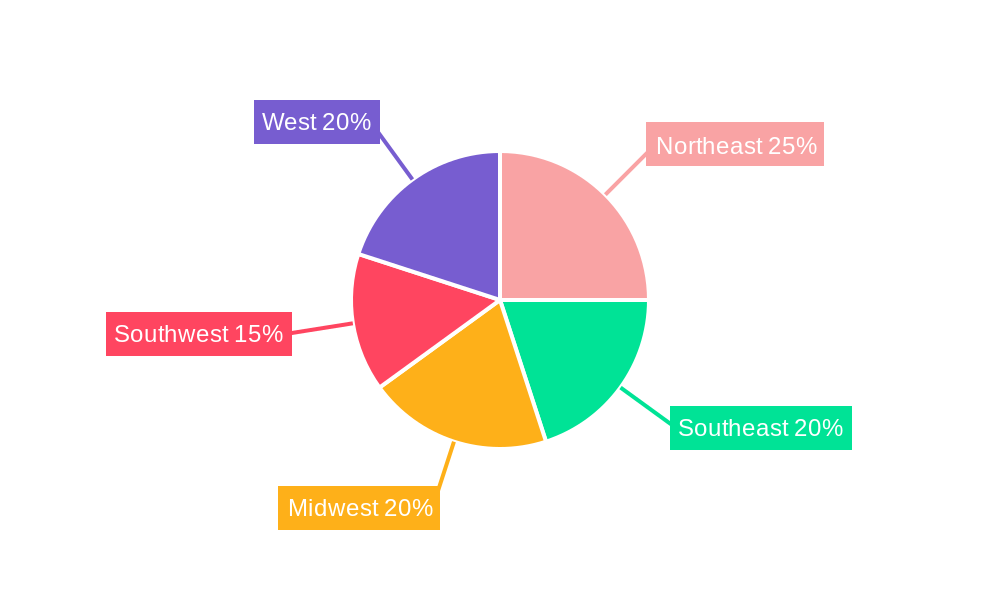
The West and Northeast regions dominate the US Engineering market, driven by robust construction activity, particularly in large-scale infrastructure projects and high-density urban developments.
Key Drivers for West Region Dominance:
- High levels of private and public sector investment in infrastructure.
- Strong growth in the technology and renewable energy sectors.
- Presence of major engineering firms and a skilled workforce.
Key Drivers for Northeast Region Dominance:
- Significant infrastructure rehabilitation and expansion projects.
- Strong presence of large industrial and manufacturing companies.
- High population density leading to robust demand for engineering services.
Within engineering disciplines, Civil engineering commands the largest market share, followed by Mechanical and Electrical engineering. The Construction and Oil & Gas sectors are the largest end-users of engineering services, owing to substantial investments in infrastructure development and energy projects.
US Engineering Industry Product Developments
Recent product innovations center around digital engineering solutions, including BIM software, advanced simulation tools, and data analytics platforms, enhancing project design, construction management, and operational efficiency. The integration of artificial intelligence (AI) and machine learning (ML) is gaining traction, promising to optimize resource allocation and predict potential risks. These advancements offer significant competitive advantages by improving project delivery times, reducing costs, and ensuring compliance with environmental regulations.
Key Drivers of US Engineering Industry Growth
The robust growth of the US engineering industry is driven by several interconnected factors: significant government spending on infrastructure modernization, particularly within transportation and energy sectors; technological advancements in design, construction, and project management; and increasing demand from the manufacturing, oil & gas, and renewable energy industries. These drivers are further amplified by a growing population and urbanization, placing increased pressure on existing infrastructure and spurring demand for new solutions.
Challenges in the US Engineering Industry Market
The US Engineering industry faces notable challenges, including a persistent skills gap, creating difficulties in finding and retaining qualified engineers; supply chain disruptions affecting the timely delivery of materials and equipment; and intense competition for projects, requiring firms to constantly innovate and optimize pricing strategies. These hurdles impact profitability and project timelines, potentially leading to cost overruns. Regulatory compliance requirements also impose additional costs and complexities, placing further strain on profit margins.
Emerging Opportunities in US Engineering Industry
The US Engineering industry presents significant long-term growth opportunities. The increasing adoption of sustainable engineering practices, driven by stricter environmental regulations, creates substantial demand for green infrastructure solutions. The integration of digital technologies, particularly AI and IoT (Internet of Things), offers opportunities for enhanced efficiency and process automation. Strategic partnerships, both domestically and internationally, will further expand market reach and unlock new avenues for growth.
Leading Players in the US Engineering Industry Sector
- Terracon
- Bechtel Corporation
- Jacobs Engineering Group
- KBR Inc
- HDR Inc
- Fluor Corporation
- Jensen Hughes
- AECOM
- Black & Veatch Holding Company
- ECS Group of Companies
Key Milestones in US Engineering Industry Industry
- November 2021: Bechtel selected for a multi-year initiative to build new dry docks and shipyard infrastructure at Pearl Harbor and Puget Sound, representing a significant USD xx Million investment in naval infrastructure.
- May 2022: AECOM awarded a USD 400 Million contract for environmental remediation services under the Navy's CLEAN program, highlighting growth in the environmental engineering sector.
Strategic Outlook for US Engineering Industry Market
The US Engineering industry's future looks bright, with sustained growth projected through 2033. Continued investment in infrastructure, coupled with ongoing technological advancements, will drive significant demand for engineering services. Companies that embrace digital transformation, prioritize sustainable practices, and build strong strategic partnerships will be best positioned to capture market share and thrive in this dynamic environment. The focus on resilient infrastructure and adapting to climate change presents a significant opportunity for growth and innovation.
US Engineering Industry Segmentation
-
1. Engineering Disciplines
- 1.1. Civil
- 1.2. Mechanical
- 1.3. Electrical
- 1.4. Environmental
-
2. End-user Industry
- 2.1. Construction
- 2.2. Oil & Gas
- 2.3. Manufacturing
- 2.4. Utilities
- 2.5. Transportation
- 2.6. Other End-user Industries
US Engineering Industry Segmentation By Geography
-
1. North America
- 1.1. United States
- 1.2. Canada
- 1.3. Mexico
-
2. South America
- 2.1. Brazil
- 2.2. Argentina
- 2.3. Rest of South America
-
3. Europe
- 3.1. United Kingdom
- 3.2. Germany
- 3.3. France
- 3.4. Italy
- 3.5. Spain
- 3.6. Russia
- 3.7. Benelux
- 3.8. Nordics
- 3.9. Rest of Europe
-
4. Middle East & Africa
- 4.1. Turkey
- 4.2. Israel
- 4.3. GCC
- 4.4. North Africa
- 4.5. South Africa
- 4.6. Rest of Middle East & Africa
-
5. Asia Pacific
- 5.1. China
- 5.2. India
- 5.3. Japan
- 5.4. South Korea
- 5.5. ASEAN
- 5.6. Oceania
- 5.7. Rest of Asia Pacific
US Engineering Industry REPORT HIGHLIGHTS
| Aspects | Details |
|---|---|
| Study Period | 2019-2033 |
| Base Year | 2024 |
| Estimated Year | 2025 |
| Forecast Period | 2025-2033 |
| Historical Period | 2019-2024 |
| Growth Rate | CAGR of 8.75% from 2019-2033 |
| Segmentation |
|
Table of Contents
- 1. Introduction
- 1.1. Research Scope
- 1.2. Market Segmentation
- 1.3. Research Methodology
- 1.4. Definitions and Assumptions
- 2. Executive Summary
- 2.1. Introduction
- 3. Market Dynamics
- 3.1. Introduction
- 3.2. Market Drivers
- 3.2.1. Increasing demand due to a growing private investment in large-scale projects and recovery in natural gas and oil prices likely to propel demand from industrial customers; Technological advancements have aided in reducing lead time and resource overheads
- 3.3. Market Restrains
- 3.3.1. Market susceptibility to changes in macro-environment as well as regulatory landscape
- 3.4. Market Trends
- 3.4.1. Civil Engineering Services is Expected to Register a Significant Growth
- 4. Market Factor Analysis
- 4.1. Porters Five Forces
- 4.2. Supply/Value Chain
- 4.3. PESTEL analysis
- 4.4. Market Entropy
- 4.5. Patent/Trademark Analysis
- 5. Global US Engineering Industry Analysis, Insights and Forecast, 2019-2031
- 5.1. Market Analysis, Insights and Forecast - by Engineering Disciplines
- 5.1.1. Civil
- 5.1.2. Mechanical
- 5.1.3. Electrical
- 5.1.4. Environmental
- 5.2. Market Analysis, Insights and Forecast - by End-user Industry
- 5.2.1. Construction
- 5.2.2. Oil & Gas
- 5.2.3. Manufacturing
- 5.2.4. Utilities
- 5.2.5. Transportation
- 5.2.6. Other End-user Industries
- 5.3. Market Analysis, Insights and Forecast - by Region
- 5.3.1. North America
- 5.3.2. South America
- 5.3.3. Europe
- 5.3.4. Middle East & Africa
- 5.3.5. Asia Pacific
- 5.1. Market Analysis, Insights and Forecast - by Engineering Disciplines
- 6. North America US Engineering Industry Analysis, Insights and Forecast, 2019-2031
- 6.1. Market Analysis, Insights and Forecast - by Engineering Disciplines
- 6.1.1. Civil
- 6.1.2. Mechanical
- 6.1.3. Electrical
- 6.1.4. Environmental
- 6.2. Market Analysis, Insights and Forecast - by End-user Industry
- 6.2.1. Construction
- 6.2.2. Oil & Gas
- 6.2.3. Manufacturing
- 6.2.4. Utilities
- 6.2.5. Transportation
- 6.2.6. Other End-user Industries
- 6.1. Market Analysis, Insights and Forecast - by Engineering Disciplines
- 7. South America US Engineering Industry Analysis, Insights and Forecast, 2019-2031
- 7.1. Market Analysis, Insights and Forecast - by Engineering Disciplines
- 7.1.1. Civil
- 7.1.2. Mechanical
- 7.1.3. Electrical
- 7.1.4. Environmental
- 7.2. Market Analysis, Insights and Forecast - by End-user Industry
- 7.2.1. Construction
- 7.2.2. Oil & Gas
- 7.2.3. Manufacturing
- 7.2.4. Utilities
- 7.2.5. Transportation
- 7.2.6. Other End-user Industries
- 7.1. Market Analysis, Insights and Forecast - by Engineering Disciplines
- 8. Europe US Engineering Industry Analysis, Insights and Forecast, 2019-2031
- 8.1. Market Analysis, Insights and Forecast - by Engineering Disciplines
- 8.1.1. Civil
- 8.1.2. Mechanical
- 8.1.3. Electrical
- 8.1.4. Environmental
- 8.2. Market Analysis, Insights and Forecast - by End-user Industry
- 8.2.1. Construction
- 8.2.2. Oil & Gas
- 8.2.3. Manufacturing
- 8.2.4. Utilities
- 8.2.5. Transportation
- 8.2.6. Other End-user Industries
- 8.1. Market Analysis, Insights and Forecast - by Engineering Disciplines
- 9. Middle East & Africa US Engineering Industry Analysis, Insights and Forecast, 2019-2031
- 9.1. Market Analysis, Insights and Forecast - by Engineering Disciplines
- 9.1.1. Civil
- 9.1.2. Mechanical
- 9.1.3. Electrical
- 9.1.4. Environmental
- 9.2. Market Analysis, Insights and Forecast - by End-user Industry
- 9.2.1. Construction
- 9.2.2. Oil & Gas
- 9.2.3. Manufacturing
- 9.2.4. Utilities
- 9.2.5. Transportation
- 9.2.6. Other End-user Industries
- 9.1. Market Analysis, Insights and Forecast - by Engineering Disciplines
- 10. Asia Pacific US Engineering Industry Analysis, Insights and Forecast, 2019-2031
- 10.1. Market Analysis, Insights and Forecast - by Engineering Disciplines
- 10.1.1. Civil
- 10.1.2. Mechanical
- 10.1.3. Electrical
- 10.1.4. Environmental
- 10.2. Market Analysis, Insights and Forecast - by End-user Industry
- 10.2.1. Construction
- 10.2.2. Oil & Gas
- 10.2.3. Manufacturing
- 10.2.4. Utilities
- 10.2.5. Transportation
- 10.2.6. Other End-user Industries
- 10.1. Market Analysis, Insights and Forecast - by Engineering Disciplines
- 11. Northeast US Engineering Industry Analysis, Insights and Forecast, 2019-2031
- 12. Southeast US Engineering Industry Analysis, Insights and Forecast, 2019-2031
- 13. Midwest US Engineering Industry Analysis, Insights and Forecast, 2019-2031
- 14. Southwest US Engineering Industry Analysis, Insights and Forecast, 2019-2031
- 15. West US Engineering Industry Analysis, Insights and Forecast, 2019-2031
- 16. Competitive Analysis
- 16.1. Global Market Share Analysis 2024
- 16.2. Company Profiles
- 16.2.1 Terracon
- 16.2.1.1. Overview
- 16.2.1.2. Products
- 16.2.1.3. SWOT Analysis
- 16.2.1.4. Recent Developments
- 16.2.1.5. Financials (Based on Availability)
- 16.2.2 Bechtel Corporation
- 16.2.2.1. Overview
- 16.2.2.2. Products
- 16.2.2.3. SWOT Analysis
- 16.2.2.4. Recent Developments
- 16.2.2.5. Financials (Based on Availability)
- 16.2.3 Jacobs Engineering Group
- 16.2.3.1. Overview
- 16.2.3.2. Products
- 16.2.3.3. SWOT Analysis
- 16.2.3.4. Recent Developments
- 16.2.3.5. Financials (Based on Availability)
- 16.2.4 KBR Inc
- 16.2.4.1. Overview
- 16.2.4.2. Products
- 16.2.4.3. SWOT Analysis
- 16.2.4.4. Recent Developments
- 16.2.4.5. Financials (Based on Availability)
- 16.2.5 HDR Inc
- 16.2.5.1. Overview
- 16.2.5.2. Products
- 16.2.5.3. SWOT Analysis
- 16.2.5.4. Recent Developments
- 16.2.5.5. Financials (Based on Availability)
- 16.2.6 Fluor Corporation
- 16.2.6.1. Overview
- 16.2.6.2. Products
- 16.2.6.3. SWOT Analysis
- 16.2.6.4. Recent Developments
- 16.2.6.5. Financials (Based on Availability)
- 16.2.7 Jensen Hughes
- 16.2.7.1. Overview
- 16.2.7.2. Products
- 16.2.7.3. SWOT Analysis
- 16.2.7.4. Recent Developments
- 16.2.7.5. Financials (Based on Availability)
- 16.2.8 AECOM
- 16.2.8.1. Overview
- 16.2.8.2. Products
- 16.2.8.3. SWOT Analysis
- 16.2.8.4. Recent Developments
- 16.2.8.5. Financials (Based on Availability)
- 16.2.9 Black & Veatch Holding Company
- 16.2.9.1. Overview
- 16.2.9.2. Products
- 16.2.9.3. SWOT Analysis
- 16.2.9.4. Recent Developments
- 16.2.9.5. Financials (Based on Availability)
- 16.2.10 ECS Group of Companies
- 16.2.10.1. Overview
- 16.2.10.2. Products
- 16.2.10.3. SWOT Analysis
- 16.2.10.4. Recent Developments
- 16.2.10.5. Financials (Based on Availability)
- 16.2.1 Terracon
List of Figures
- Figure 1: Global US Engineering Industry Revenue Breakdown (Million, %) by Region 2024 & 2032
- Figure 2: Global US Engineering Industry Volume Breakdown (K Unit, %) by Region 2024 & 2032
- Figure 3: United states US Engineering Industry Revenue (Million), by Country 2024 & 2032
- Figure 4: United states US Engineering Industry Volume (K Unit), by Country 2024 & 2032
- Figure 5: United states US Engineering Industry Revenue Share (%), by Country 2024 & 2032
- Figure 6: United states US Engineering Industry Volume Share (%), by Country 2024 & 2032
- Figure 7: North America US Engineering Industry Revenue (Million), by Engineering Disciplines 2024 & 2032
- Figure 8: North America US Engineering Industry Volume (K Unit), by Engineering Disciplines 2024 & 2032
- Figure 9: North America US Engineering Industry Revenue Share (%), by Engineering Disciplines 2024 & 2032
- Figure 10: North America US Engineering Industry Volume Share (%), by Engineering Disciplines 2024 & 2032
- Figure 11: North America US Engineering Industry Revenue (Million), by End-user Industry 2024 & 2032
- Figure 12: North America US Engineering Industry Volume (K Unit), by End-user Industry 2024 & 2032
- Figure 13: North America US Engineering Industry Revenue Share (%), by End-user Industry 2024 & 2032
- Figure 14: North America US Engineering Industry Volume Share (%), by End-user Industry 2024 & 2032
- Figure 15: North America US Engineering Industry Revenue (Million), by Country 2024 & 2032
- Figure 16: North America US Engineering Industry Volume (K Unit), by Country 2024 & 2032
- Figure 17: North America US Engineering Industry Revenue Share (%), by Country 2024 & 2032
- Figure 18: North America US Engineering Industry Volume Share (%), by Country 2024 & 2032
- Figure 19: South America US Engineering Industry Revenue (Million), by Engineering Disciplines 2024 & 2032
- Figure 20: South America US Engineering Industry Volume (K Unit), by Engineering Disciplines 2024 & 2032
- Figure 21: South America US Engineering Industry Revenue Share (%), by Engineering Disciplines 2024 & 2032
- Figure 22: South America US Engineering Industry Volume Share (%), by Engineering Disciplines 2024 & 2032
- Figure 23: South America US Engineering Industry Revenue (Million), by End-user Industry 2024 & 2032
- Figure 24: South America US Engineering Industry Volume (K Unit), by End-user Industry 2024 & 2032
- Figure 25: South America US Engineering Industry Revenue Share (%), by End-user Industry 2024 & 2032
- Figure 26: South America US Engineering Industry Volume Share (%), by End-user Industry 2024 & 2032
- Figure 27: South America US Engineering Industry Revenue (Million), by Country 2024 & 2032
- Figure 28: South America US Engineering Industry Volume (K Unit), by Country 2024 & 2032
- Figure 29: South America US Engineering Industry Revenue Share (%), by Country 2024 & 2032
- Figure 30: South America US Engineering Industry Volume Share (%), by Country 2024 & 2032
- Figure 31: Europe US Engineering Industry Revenue (Million), by Engineering Disciplines 2024 & 2032
- Figure 32: Europe US Engineering Industry Volume (K Unit), by Engineering Disciplines 2024 & 2032
- Figure 33: Europe US Engineering Industry Revenue Share (%), by Engineering Disciplines 2024 & 2032
- Figure 34: Europe US Engineering Industry Volume Share (%), by Engineering Disciplines 2024 & 2032
- Figure 35: Europe US Engineering Industry Revenue (Million), by End-user Industry 2024 & 2032
- Figure 36: Europe US Engineering Industry Volume (K Unit), by End-user Industry 2024 & 2032
- Figure 37: Europe US Engineering Industry Revenue Share (%), by End-user Industry 2024 & 2032
- Figure 38: Europe US Engineering Industry Volume Share (%), by End-user Industry 2024 & 2032
- Figure 39: Europe US Engineering Industry Revenue (Million), by Country 2024 & 2032
- Figure 40: Europe US Engineering Industry Volume (K Unit), by Country 2024 & 2032
- Figure 41: Europe US Engineering Industry Revenue Share (%), by Country 2024 & 2032
- Figure 42: Europe US Engineering Industry Volume Share (%), by Country 2024 & 2032
- Figure 43: Middle East & Africa US Engineering Industry Revenue (Million), by Engineering Disciplines 2024 & 2032
- Figure 44: Middle East & Africa US Engineering Industry Volume (K Unit), by Engineering Disciplines 2024 & 2032
- Figure 45: Middle East & Africa US Engineering Industry Revenue Share (%), by Engineering Disciplines 2024 & 2032
- Figure 46: Middle East & Africa US Engineering Industry Volume Share (%), by Engineering Disciplines 2024 & 2032
- Figure 47: Middle East & Africa US Engineering Industry Revenue (Million), by End-user Industry 2024 & 2032
- Figure 48: Middle East & Africa US Engineering Industry Volume (K Unit), by End-user Industry 2024 & 2032
- Figure 49: Middle East & Africa US Engineering Industry Revenue Share (%), by End-user Industry 2024 & 2032
- Figure 50: Middle East & Africa US Engineering Industry Volume Share (%), by End-user Industry 2024 & 2032
- Figure 51: Middle East & Africa US Engineering Industry Revenue (Million), by Country 2024 & 2032
- Figure 52: Middle East & Africa US Engineering Industry Volume (K Unit), by Country 2024 & 2032
- Figure 53: Middle East & Africa US Engineering Industry Revenue Share (%), by Country 2024 & 2032
- Figure 54: Middle East & Africa US Engineering Industry Volume Share (%), by Country 2024 & 2032
- Figure 55: Asia Pacific US Engineering Industry Revenue (Million), by Engineering Disciplines 2024 & 2032
- Figure 56: Asia Pacific US Engineering Industry Volume (K Unit), by Engineering Disciplines 2024 & 2032
- Figure 57: Asia Pacific US Engineering Industry Revenue Share (%), by Engineering Disciplines 2024 & 2032
- Figure 58: Asia Pacific US Engineering Industry Volume Share (%), by Engineering Disciplines 2024 & 2032
- Figure 59: Asia Pacific US Engineering Industry Revenue (Million), by End-user Industry 2024 & 2032
- Figure 60: Asia Pacific US Engineering Industry Volume (K Unit), by End-user Industry 2024 & 2032
- Figure 61: Asia Pacific US Engineering Industry Revenue Share (%), by End-user Industry 2024 & 2032
- Figure 62: Asia Pacific US Engineering Industry Volume Share (%), by End-user Industry 2024 & 2032
- Figure 63: Asia Pacific US Engineering Industry Revenue (Million), by Country 2024 & 2032
- Figure 64: Asia Pacific US Engineering Industry Volume (K Unit), by Country 2024 & 2032
- Figure 65: Asia Pacific US Engineering Industry Revenue Share (%), by Country 2024 & 2032
- Figure 66: Asia Pacific US Engineering Industry Volume Share (%), by Country 2024 & 2032
List of Tables
- Table 1: Global US Engineering Industry Revenue Million Forecast, by Region 2019 & 2032
- Table 2: Global US Engineering Industry Volume K Unit Forecast, by Region 2019 & 2032
- Table 3: Global US Engineering Industry Revenue Million Forecast, by Engineering Disciplines 2019 & 2032
- Table 4: Global US Engineering Industry Volume K Unit Forecast, by Engineering Disciplines 2019 & 2032
- Table 5: Global US Engineering Industry Revenue Million Forecast, by End-user Industry 2019 & 2032
- Table 6: Global US Engineering Industry Volume K Unit Forecast, by End-user Industry 2019 & 2032
- Table 7: Global US Engineering Industry Revenue Million Forecast, by Region 2019 & 2032
- Table 8: Global US Engineering Industry Volume K Unit Forecast, by Region 2019 & 2032
- Table 9: Global US Engineering Industry Revenue Million Forecast, by Country 2019 & 2032
- Table 10: Global US Engineering Industry Volume K Unit Forecast, by Country 2019 & 2032
- Table 11: Northeast US Engineering Industry Revenue (Million) Forecast, by Application 2019 & 2032
- Table 12: Northeast US Engineering Industry Volume (K Unit) Forecast, by Application 2019 & 2032
- Table 13: Southeast US Engineering Industry Revenue (Million) Forecast, by Application 2019 & 2032
- Table 14: Southeast US Engineering Industry Volume (K Unit) Forecast, by Application 2019 & 2032
- Table 15: Midwest US Engineering Industry Revenue (Million) Forecast, by Application 2019 & 2032
- Table 16: Midwest US Engineering Industry Volume (K Unit) Forecast, by Application 2019 & 2032
- Table 17: Southwest US Engineering Industry Revenue (Million) Forecast, by Application 2019 & 2032
- Table 18: Southwest US Engineering Industry Volume (K Unit) Forecast, by Application 2019 & 2032
- Table 19: West US Engineering Industry Revenue (Million) Forecast, by Application 2019 & 2032
- Table 20: West US Engineering Industry Volume (K Unit) Forecast, by Application 2019 & 2032
- Table 21: Global US Engineering Industry Revenue Million Forecast, by Engineering Disciplines 2019 & 2032
- Table 22: Global US Engineering Industry Volume K Unit Forecast, by Engineering Disciplines 2019 & 2032
- Table 23: Global US Engineering Industry Revenue Million Forecast, by End-user Industry 2019 & 2032
- Table 24: Global US Engineering Industry Volume K Unit Forecast, by End-user Industry 2019 & 2032
- Table 25: Global US Engineering Industry Revenue Million Forecast, by Country 2019 & 2032
- Table 26: Global US Engineering Industry Volume K Unit Forecast, by Country 2019 & 2032
- Table 27: United States US Engineering Industry Revenue (Million) Forecast, by Application 2019 & 2032
- Table 28: United States US Engineering Industry Volume (K Unit) Forecast, by Application 2019 & 2032
- Table 29: Canada US Engineering Industry Revenue (Million) Forecast, by Application 2019 & 2032
- Table 30: Canada US Engineering Industry Volume (K Unit) Forecast, by Application 2019 & 2032
- Table 31: Mexico US Engineering Industry Revenue (Million) Forecast, by Application 2019 & 2032
- Table 32: Mexico US Engineering Industry Volume (K Unit) Forecast, by Application 2019 & 2032
- Table 33: Global US Engineering Industry Revenue Million Forecast, by Engineering Disciplines 2019 & 2032
- Table 34: Global US Engineering Industry Volume K Unit Forecast, by Engineering Disciplines 2019 & 2032
- Table 35: Global US Engineering Industry Revenue Million Forecast, by End-user Industry 2019 & 2032
- Table 36: Global US Engineering Industry Volume K Unit Forecast, by End-user Industry 2019 & 2032
- Table 37: Global US Engineering Industry Revenue Million Forecast, by Country 2019 & 2032
- Table 38: Global US Engineering Industry Volume K Unit Forecast, by Country 2019 & 2032
- Table 39: Brazil US Engineering Industry Revenue (Million) Forecast, by Application 2019 & 2032
- Table 40: Brazil US Engineering Industry Volume (K Unit) Forecast, by Application 2019 & 2032
- Table 41: Argentina US Engineering Industry Revenue (Million) Forecast, by Application 2019 & 2032
- Table 42: Argentina US Engineering Industry Volume (K Unit) Forecast, by Application 2019 & 2032
- Table 43: Rest of South America US Engineering Industry Revenue (Million) Forecast, by Application 2019 & 2032
- Table 44: Rest of South America US Engineering Industry Volume (K Unit) Forecast, by Application 2019 & 2032
- Table 45: Global US Engineering Industry Revenue Million Forecast, by Engineering Disciplines 2019 & 2032
- Table 46: Global US Engineering Industry Volume K Unit Forecast, by Engineering Disciplines 2019 & 2032
- Table 47: Global US Engineering Industry Revenue Million Forecast, by End-user Industry 2019 & 2032
- Table 48: Global US Engineering Industry Volume K Unit Forecast, by End-user Industry 2019 & 2032
- Table 49: Global US Engineering Industry Revenue Million Forecast, by Country 2019 & 2032
- Table 50: Global US Engineering Industry Volume K Unit Forecast, by Country 2019 & 2032
- Table 51: United Kingdom US Engineering Industry Revenue (Million) Forecast, by Application 2019 & 2032
- Table 52: United Kingdom US Engineering Industry Volume (K Unit) Forecast, by Application 2019 & 2032
- Table 53: Germany US Engineering Industry Revenue (Million) Forecast, by Application 2019 & 2032
- Table 54: Germany US Engineering Industry Volume (K Unit) Forecast, by Application 2019 & 2032
- Table 55: France US Engineering Industry Revenue (Million) Forecast, by Application 2019 & 2032
- Table 56: France US Engineering Industry Volume (K Unit) Forecast, by Application 2019 & 2032
- Table 57: Italy US Engineering Industry Revenue (Million) Forecast, by Application 2019 & 2032
- Table 58: Italy US Engineering Industry Volume (K Unit) Forecast, by Application 2019 & 2032
- Table 59: Spain US Engineering Industry Revenue (Million) Forecast, by Application 2019 & 2032
- Table 60: Spain US Engineering Industry Volume (K Unit) Forecast, by Application 2019 & 2032
- Table 61: Russia US Engineering Industry Revenue (Million) Forecast, by Application 2019 & 2032
- Table 62: Russia US Engineering Industry Volume (K Unit) Forecast, by Application 2019 & 2032
- Table 63: Benelux US Engineering Industry Revenue (Million) Forecast, by Application 2019 & 2032
- Table 64: Benelux US Engineering Industry Volume (K Unit) Forecast, by Application 2019 & 2032
- Table 65: Nordics US Engineering Industry Revenue (Million) Forecast, by Application 2019 & 2032
- Table 66: Nordics US Engineering Industry Volume (K Unit) Forecast, by Application 2019 & 2032
- Table 67: Rest of Europe US Engineering Industry Revenue (Million) Forecast, by Application 2019 & 2032
- Table 68: Rest of Europe US Engineering Industry Volume (K Unit) Forecast, by Application 2019 & 2032
- Table 69: Global US Engineering Industry Revenue Million Forecast, by Engineering Disciplines 2019 & 2032
- Table 70: Global US Engineering Industry Volume K Unit Forecast, by Engineering Disciplines 2019 & 2032
- Table 71: Global US Engineering Industry Revenue Million Forecast, by End-user Industry 2019 & 2032
- Table 72: Global US Engineering Industry Volume K Unit Forecast, by End-user Industry 2019 & 2032
- Table 73: Global US Engineering Industry Revenue Million Forecast, by Country 2019 & 2032
- Table 74: Global US Engineering Industry Volume K Unit Forecast, by Country 2019 & 2032
- Table 75: Turkey US Engineering Industry Revenue (Million) Forecast, by Application 2019 & 2032
- Table 76: Turkey US Engineering Industry Volume (K Unit) Forecast, by Application 2019 & 2032
- Table 77: Israel US Engineering Industry Revenue (Million) Forecast, by Application 2019 & 2032
- Table 78: Israel US Engineering Industry Volume (K Unit) Forecast, by Application 2019 & 2032
- Table 79: GCC US Engineering Industry Revenue (Million) Forecast, by Application 2019 & 2032
- Table 80: GCC US Engineering Industry Volume (K Unit) Forecast, by Application 2019 & 2032
- Table 81: North Africa US Engineering Industry Revenue (Million) Forecast, by Application 2019 & 2032
- Table 82: North Africa US Engineering Industry Volume (K Unit) Forecast, by Application 2019 & 2032
- Table 83: South Africa US Engineering Industry Revenue (Million) Forecast, by Application 2019 & 2032
- Table 84: South Africa US Engineering Industry Volume (K Unit) Forecast, by Application 2019 & 2032
- Table 85: Rest of Middle East & Africa US Engineering Industry Revenue (Million) Forecast, by Application 2019 & 2032
- Table 86: Rest of Middle East & Africa US Engineering Industry Volume (K Unit) Forecast, by Application 2019 & 2032
- Table 87: Global US Engineering Industry Revenue Million Forecast, by Engineering Disciplines 2019 & 2032
- Table 88: Global US Engineering Industry Volume K Unit Forecast, by Engineering Disciplines 2019 & 2032
- Table 89: Global US Engineering Industry Revenue Million Forecast, by End-user Industry 2019 & 2032
- Table 90: Global US Engineering Industry Volume K Unit Forecast, by End-user Industry 2019 & 2032
- Table 91: Global US Engineering Industry Revenue Million Forecast, by Country 2019 & 2032
- Table 92: Global US Engineering Industry Volume K Unit Forecast, by Country 2019 & 2032
- Table 93: China US Engineering Industry Revenue (Million) Forecast, by Application 2019 & 2032
- Table 94: China US Engineering Industry Volume (K Unit) Forecast, by Application 2019 & 2032
- Table 95: India US Engineering Industry Revenue (Million) Forecast, by Application 2019 & 2032
- Table 96: India US Engineering Industry Volume (K Unit) Forecast, by Application 2019 & 2032
- Table 97: Japan US Engineering Industry Revenue (Million) Forecast, by Application 2019 & 2032
- Table 98: Japan US Engineering Industry Volume (K Unit) Forecast, by Application 2019 & 2032
- Table 99: South Korea US Engineering Industry Revenue (Million) Forecast, by Application 2019 & 2032
- Table 100: South Korea US Engineering Industry Volume (K Unit) Forecast, by Application 2019 & 2032
- Table 101: ASEAN US Engineering Industry Revenue (Million) Forecast, by Application 2019 & 2032
- Table 102: ASEAN US Engineering Industry Volume (K Unit) Forecast, by Application 2019 & 2032
- Table 103: Oceania US Engineering Industry Revenue (Million) Forecast, by Application 2019 & 2032
- Table 104: Oceania US Engineering Industry Volume (K Unit) Forecast, by Application 2019 & 2032
- Table 105: Rest of Asia Pacific US Engineering Industry Revenue (Million) Forecast, by Application 2019 & 2032
- Table 106: Rest of Asia Pacific US Engineering Industry Volume (K Unit) Forecast, by Application 2019 & 2032
Frequently Asked Questions
1. What is the projected Compound Annual Growth Rate (CAGR) of the US Engineering Industry?
The projected CAGR is approximately 8.75%.
2. Which companies are prominent players in the US Engineering Industry?
Key companies in the market include Terracon, Bechtel Corporation, Jacobs Engineering Group, KBR Inc, HDR Inc, Fluor Corporation, Jensen Hughes, AECOM, Black & Veatch Holding Company, ECS Group of Companies.
3. What are the main segments of the US Engineering Industry?
The market segments include Engineering Disciplines, End-user Industry.
4. Can you provide details about the market size?
The market size is estimated to be USD XX Million as of 2022.
5. What are some drivers contributing to market growth?
Increasing demand due to a growing private investment in large-scale projects and recovery in natural gas and oil prices likely to propel demand from industrial customers; Technological advancements have aided in reducing lead time and resource overheads.
6. What are the notable trends driving market growth?
Civil Engineering Services is Expected to Register a Significant Growth.
7. Are there any restraints impacting market growth?
Market susceptibility to changes in macro-environment as well as regulatory landscape.
8. Can you provide examples of recent developments in the market?
May 2022 - The Naval Facilities Engineering Systems Command (NAVFAC) Atlantic has awarded AECOM's Resolution Consultants joint venture with EnSafe a solitary, indefinite-delivery, indefinite-quantity (IDIQ) contract to deliver architecture and engineering services for the Comprehensive Long-Term Environmental Action Navy (CLEAN) program. The joint venture will conduct environmental research, investigations, and designs that solve major environmental concerns under the contract, which has a USD 400 million budget.
9. What pricing options are available for accessing the report?
Pricing options include single-user, multi-user, and enterprise licenses priced at USD 3800, USD 4500, and USD 5800 respectively.
10. Is the market size provided in terms of value or volume?
The market size is provided in terms of value, measured in Million and volume, measured in K Unit.
11. Are there any specific market keywords associated with the report?
Yes, the market keyword associated with the report is "US Engineering Industry," which aids in identifying and referencing the specific market segment covered.
12. How do I determine which pricing option suits my needs best?
The pricing options vary based on user requirements and access needs. Individual users may opt for single-user licenses, while businesses requiring broader access may choose multi-user or enterprise licenses for cost-effective access to the report.
13. Are there any additional resources or data provided in the US Engineering Industry report?
While the report offers comprehensive insights, it's advisable to review the specific contents or supplementary materials provided to ascertain if additional resources or data are available.
14. How can I stay updated on further developments or reports in the US Engineering Industry?
To stay informed about further developments, trends, and reports in the US Engineering Industry, consider subscribing to industry newsletters, following relevant companies and organizations, or regularly checking reputable industry news sources and publications.
Methodology
Step 1 - Identification of Relevant Samples Size from Population Database


Step 2 - Approaches for Defining Global Market Size (Value, Volume* & Price*)

Note*: In applicable scenarios
Step 3 - Data Sources
Primary Research
- Web Analytics
- Survey Reports
- Research Institute
- Latest Research Reports
- Opinion Leaders
Secondary Research
- Annual Reports
- White Paper
- Latest Press Release
- Industry Association
- Paid Database
- Investor Presentations

Step 4 - Data Triangulation
Involves using different sources of information in order to increase the validity of a study
These sources are likely to be stakeholders in a program - participants, other researchers, program staff, other community members, and so on.
Then we put all data in single framework & apply various statistical tools to find out the dynamic on the market.
During the analysis stage, feedback from the stakeholder groups would be compared to determine areas of agreement as well as areas of divergence
