

Key Insights
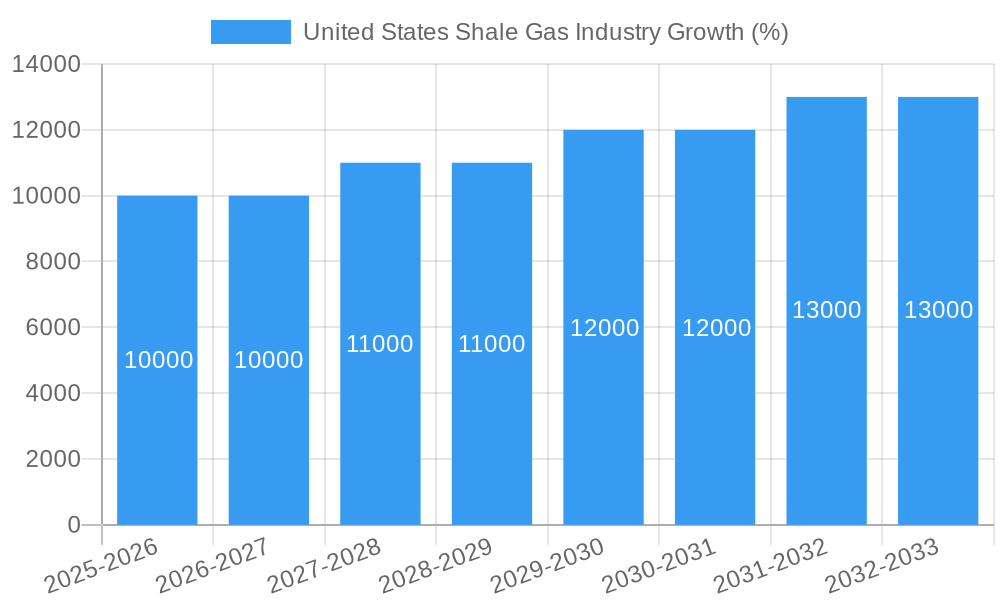
The United States shale gas industry is experiencing robust growth, driven by several key factors. The relatively low production costs compared to other natural gas sources, coupled with ongoing technological advancements in horizontal drilling and hydraulic fracturing, continue to enhance profitability and expansion. Increased demand for natural gas both domestically and for export, particularly to countries seeking cleaner energy alternatives, fuels this growth. While environmental concerns surrounding methane emissions and water usage remain challenges, the industry is actively implementing mitigation strategies and embracing more sustainable practices to address these issues. Government regulations and policies play a significant role, influencing exploration, production, and transportation, with fluctuations in these policies potentially impacting the market trajectory. Competition among major players like Shell, ExxonMobil, Chevron, and ConocoPhillips, along with service providers such as Baker Hughes, shapes pricing and innovation within the sector. Considering a CAGR of over 3.50%, and a 2025 market value in the multi-billion dollar range (a reasonable estimation based on publicly available data on the overall North American natural gas market size and the significant US share), the shale gas industry is projected to maintain a strong growth trajectory through 2033.
The forecast for the US shale gas market suggests continued expansion, but at a potentially moderating pace beyond the initial period of rapid growth. Factors such as global energy price volatility, economic fluctuations, and evolving environmental regulations could introduce some uncertainty. However, the increasing integration of renewable energy sources alongside natural gas (as a bridging fuel) creates a potentially enduring market for shale gas, albeit one that may require adaptation to the changing energy landscape. Further technological advancements in efficiency and emissions reduction will be crucial for the industry's long-term sustainability and continued competitiveness. The geographical distribution of shale gas reserves and pipeline infrastructure also plays a critical role in determining regional growth patterns within the United States. The focus will likely shift towards optimizing existing infrastructure and exploring new reserves strategically, rather than simply pursuing rapid expansion.
United States Shale Gas Industry: A Comprehensive Market Report (2019-2033)
This comprehensive report provides an in-depth analysis of the United States shale gas industry, covering market dynamics, industry trends, leading players, and future outlook. The study period spans 2019-2033, with 2025 serving as the base and estimated year. This report is crucial for investors, industry professionals, and policymakers seeking to understand this dynamic and evolving sector. The report leverages rigorous research and data analysis to provide actionable insights into the shale gas and shale oil segments, focusing on key players like Shell PLC, Exxon Mobil Corporation, Chevron Corporation, ConocoPhillips Company, Murphy Oil Corporation, Baker Hughes Company, and TotalEnergies SE. Discover crucial market trends, growth drivers, challenges, and opportunities shaping the future of the US shale gas industry.
United States Shale Gas Industry Market Dynamics & Concentration
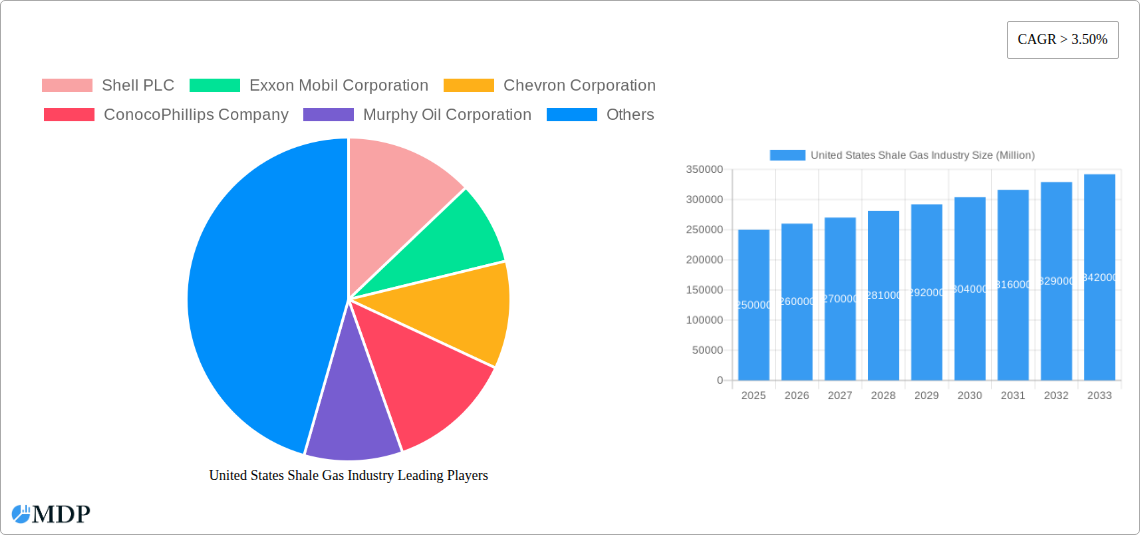
The US shale gas industry exhibits a moderately concentrated market structure, with a handful of major integrated oil and gas companies controlling a significant share of production. Market concentration is influenced by factors such as economies of scale, access to capital, and technological capabilities. Innovation in hydraulic fracturing and horizontal drilling has been a key driver of growth, while regulatory frameworks (including environmental regulations and permitting processes) significantly impact operational costs and expansion plans. Product substitutes, such as renewable energy sources, pose a growing competitive threat, pushing companies towards diversification. End-user trends, particularly shifting demands from industrial and power generation sectors, also shape market dynamics. Mergers and acquisitions (M&A) activity is a significant aspect of industry consolidation. Recent years have witnessed several large-scale transactions, including Shell PLC's $9.5 Billion sale of Permian Basin assets.
- Market Share: The top 5 companies hold an estimated xx% of the market share in 2025.
- M&A Deal Counts: An estimated xx major M&A deals occurred between 2019 and 2024.
United States Shale Gas Industry Industry Trends & Analysis
The US shale gas industry has witnessed significant growth over the past decade, driven primarily by technological advancements in drilling and extraction. However, growth rates have fluctuated in recent years due to factors such as oil price volatility and evolving regulatory landscapes. The industry is characterized by intense competition, with companies constantly striving for operational efficiency and cost reduction. Consumer preferences towards cleaner energy sources present a challenge, forcing companies to explore diversification strategies. This includes investments in carbon capture, utilization, and storage (CCUS) technologies. The Compound Annual Growth Rate (CAGR) for the forecast period (2025-2033) is projected to be xx%, with market penetration expected to reach xx% by 2033. Technological disruptions, such as advancements in automation and data analytics, are transforming operational processes, enhancing efficiency, and reducing costs.
Leading Markets & Segments in United States Shale Gas Industry
The Permian Basin remains the dominant region for shale gas and shale oil production in the US, driven by favorable geological conditions, extensive existing infrastructure, and a supportive regulatory environment. The economic policies supporting energy production in this region, coupled with efficient transportation networks and access to skilled labor, contribute significantly to its dominance.
- Key Drivers for Permian Basin Dominance:
- Favorable geological formations
- Well-established infrastructure
- Supportive regulatory environment
- Access to capital and skilled labor
- Economies of scale
Shale gas production slightly outpaces shale oil production in overall volume, although both segments experience significant fluctuations based on market demand and prices. A detailed analysis reveals that the Permian Basin accounts for approximately xx% of total US shale gas production and xx% of total US shale oil production in 2025.
United States Shale Gas Industry Product Developments
Recent product developments focus on enhancing extraction efficiency, reducing environmental impact, and improving the quality of produced gas. This includes innovations in drilling techniques, water management technologies, and methane emission reduction strategies. These advancements contribute to increased production, lower costs, and a reduced environmental footprint, enhancing the competitiveness of US shale gas in the global energy market. The industry is also seeing the development of technologies for processing shale gas into higher-value products like petrochemicals.
Key Drivers of United States Shale Gas Industry Growth
Technological advancements in horizontal drilling and hydraulic fracturing have revolutionized shale gas extraction, unlocking vast reserves previously inaccessible. Favorable government policies that support domestic energy production, coupled with robust demand from the power generation and industrial sectors, contribute to industry growth. Consistent investment in research and development further enhances efficiency and reduces costs, driving expansion.
Challenges in the United States Shale Gas Industry Market
The industry faces challenges including stringent environmental regulations, requiring significant investments in emission reduction technologies. Fluctuations in oil and gas prices create price volatility, impacting profitability. Supply chain disruptions, particularly for specialized equipment and materials, can impact operations. Intense competition among producers puts downward pressure on prices and margins. Regulatory uncertainty regarding permitting and leasing creates delays and increases costs. These factors, in aggregate, could reduce the CAGR by approximately xx% by 2033.
Emerging Opportunities in United States Shale Gas Industry
The growing demand for natural gas as a cleaner-burning fossil fuel presents significant opportunities. Technological innovations in carbon capture and storage (CCS) are opening pathways for reducing the industry's environmental impact. Strategic partnerships among producers, technology providers, and infrastructure developers are fostering collaboration and innovation. Expansion into new shale gas basins with untapped resources holds potential for future growth.
Leading Players in the United States Shale Gas Industry Sector
- Shell PLC
- Exxon Mobil Corporation
- Chevron Corporation
- ConocoPhillips Company
- Murphy Oil Corporation
- Baker Hughes Company
- TotalEnergies SE
Key Milestones in United States Shale Gas Industry Industry
- September 2021: Shell PLC sold its Permian Basin assets to ConocoPhillips for USD 9.5 Billion, signifying a strategic shift towards clean energy.
- January 2022: Oil India Ltd exited a US shale oil venture, selling its 20% stake for USD 25 Million, highlighting the evolving investment landscape.
Strategic Outlook for United States Shale Gas Industry Market
The US shale gas industry is poised for continued growth, driven by technological advancements and consistent demand. Strategic opportunities lie in optimizing operational efficiency, investing in CCS technologies, and exploring new resource plays. Successful companies will need to navigate regulatory complexities, manage price volatility, and adapt to evolving consumer preferences for cleaner energy sources. The industry's long-term potential depends on its ability to balance economic growth with environmental sustainability.
United States Shale Gas Industry Segmentation
-
1. Type
- 1.1. Shale Gas
- 1.2. Shale Oil
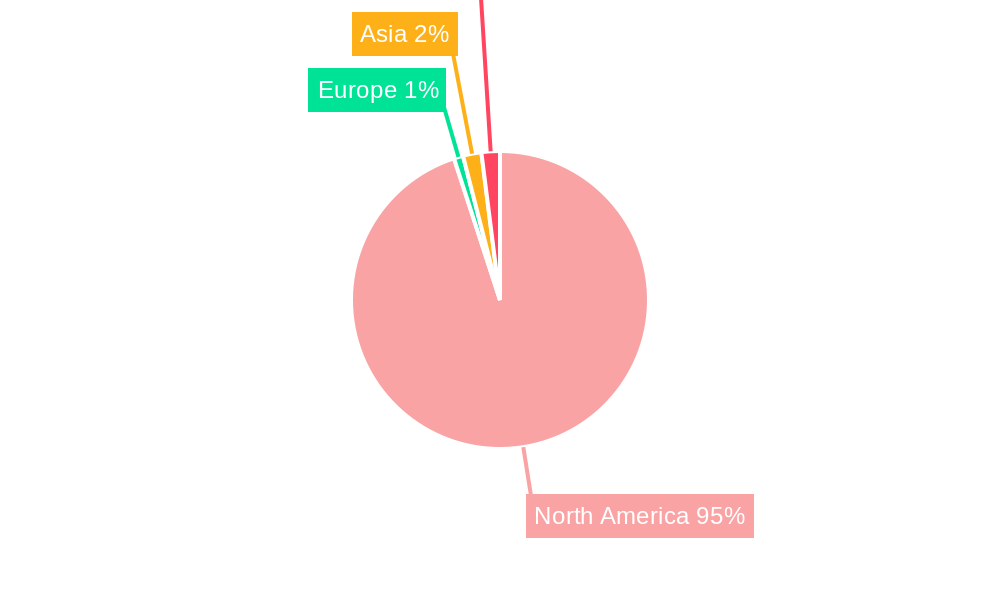
United States Shale Gas Industry Segmentation By Geography
- 1. United States
United States Shale Gas Industry REPORT HIGHLIGHTS
| Aspects | Details |
|---|---|
| Study Period | 2019-2033 |
| Base Year | 2024 |
| Estimated Year | 2025 |
| Forecast Period | 2025-2033 |
| Historical Period | 2019-2024 |
| Growth Rate | CAGR of > 3.50% from 2019-2033 |
| Segmentation |
|
Table of Contents
- 1. Introduction
- 1.1. Research Scope
- 1.2. Market Segmentation
- 1.3. Research Methodology
- 1.4. Definitions and Assumptions
- 2. Executive Summary
- 2.1. Introduction
- 3. Market Dynamics
- 3.1. Introduction
- 3.2. Market Drivers
- 3.2.1. 4.; Modernization and Upgrades of Existing Military Aircraft Fleets4.; Increasing Defense Budgets
- 3.3. Market Restrains
- 3.3.1. 4.; Shift Toward Unmanned Aircraft
- 3.4. Market Trends
- 3.4.1. Shale Gas to Dominate the Market
- 4. Market Factor Analysis
- 4.1. Porters Five Forces
- 4.2. Supply/Value Chain
- 4.3. PESTEL analysis
- 4.4. Market Entropy
- 4.5. Patent/Trademark Analysis
- 5. United States Shale Gas Industry Analysis, Insights and Forecast, 2019-2031
- 5.1. Market Analysis, Insights and Forecast - by Type
- 5.1.1. Shale Gas
- 5.1.2. Shale Oil
- 5.2. Market Analysis, Insights and Forecast - by Region
- 5.2.1. United States
- 5.1. Market Analysis, Insights and Forecast - by Type
- 6. United States United States Shale Gas Industry Analysis, Insights and Forecast, 2019-2031
- 7. Canada United States Shale Gas Industry Analysis, Insights and Forecast, 2019-2031
- 8. Mexico United States Shale Gas Industry Analysis, Insights and Forecast, 2019-2031
- 9. Rest of North America United States Shale Gas Industry Analysis, Insights and Forecast, 2019-2031
- 10. Competitive Analysis
- 10.1. Market Share Analysis 2024
- 10.2. Company Profiles
- 10.2.1 Shell PLC
- 10.2.1.1. Overview
- 10.2.1.2. Products
- 10.2.1.3. SWOT Analysis
- 10.2.1.4. Recent Developments
- 10.2.1.5. Financials (Based on Availability)
- 10.2.2 Exxon Mobil Corporation
- 10.2.2.1. Overview
- 10.2.2.2. Products
- 10.2.2.3. SWOT Analysis
- 10.2.2.4. Recent Developments
- 10.2.2.5. Financials (Based on Availability)
- 10.2.3 Chevron Corporation
- 10.2.3.1. Overview
- 10.2.3.2. Products
- 10.2.3.3. SWOT Analysis
- 10.2.3.4. Recent Developments
- 10.2.3.5. Financials (Based on Availability)
- 10.2.4 ConocoPhillips Company
- 10.2.4.1. Overview
- 10.2.4.2. Products
- 10.2.4.3. SWOT Analysis
- 10.2.4.4. Recent Developments
- 10.2.4.5. Financials (Based on Availability)
- 10.2.5 Murphy Oil Corporation
- 10.2.5.1. Overview
- 10.2.5.2. Products
- 10.2.5.3. SWOT Analysis
- 10.2.5.4. Recent Developments
- 10.2.5.5. Financials (Based on Availability)
- 10.2.6 Baker Hughes Company
- 10.2.6.1. Overview
- 10.2.6.2. Products
- 10.2.6.3. SWOT Analysis
- 10.2.6.4. Recent Developments
- 10.2.6.5. Financials (Based on Availability)
- 10.2.7 TotalEnergies SE
- 10.2.7.1. Overview
- 10.2.7.2. Products
- 10.2.7.3. SWOT Analysis
- 10.2.7.4. Recent Developments
- 10.2.7.5. Financials (Based on Availability)
- 10.2.1 Shell PLC
List of Figures
- Figure 1: United States Shale Gas Industry Revenue Breakdown (Million, %) by Product 2024 & 2032
- Figure 2: United States Shale Gas Industry Share (%) by Company 2024
List of Tables
- Table 1: United States Shale Gas Industry Revenue Million Forecast, by Region 2019 & 2032
- Table 2: United States Shale Gas Industry Volume Trillion Forecast, by Region 2019 & 2032
- Table 3: United States Shale Gas Industry Revenue Million Forecast, by Type 2019 & 2032
- Table 4: United States Shale Gas Industry Volume Trillion Forecast, by Type 2019 & 2032
- Table 5: United States Shale Gas Industry Revenue Million Forecast, by Region 2019 & 2032
- Table 6: United States Shale Gas Industry Volume Trillion Forecast, by Region 2019 & 2032
- Table 7: United States Shale Gas Industry Revenue Million Forecast, by Country 2019 & 2032
- Table 8: United States Shale Gas Industry Volume Trillion Forecast, by Country 2019 & 2032
- Table 9: United States United States Shale Gas Industry Revenue (Million) Forecast, by Application 2019 & 2032
- Table 10: United States United States Shale Gas Industry Volume (Trillion) Forecast, by Application 2019 & 2032
- Table 11: Canada United States Shale Gas Industry Revenue (Million) Forecast, by Application 2019 & 2032
- Table 12: Canada United States Shale Gas Industry Volume (Trillion) Forecast, by Application 2019 & 2032
- Table 13: Mexico United States Shale Gas Industry Revenue (Million) Forecast, by Application 2019 & 2032
- Table 14: Mexico United States Shale Gas Industry Volume (Trillion) Forecast, by Application 2019 & 2032
- Table 15: Rest of North America United States Shale Gas Industry Revenue (Million) Forecast, by Application 2019 & 2032
- Table 16: Rest of North America United States Shale Gas Industry Volume (Trillion) Forecast, by Application 2019 & 2032
- Table 17: United States Shale Gas Industry Revenue Million Forecast, by Type 2019 & 2032
- Table 18: United States Shale Gas Industry Volume Trillion Forecast, by Type 2019 & 2032
- Table 19: United States Shale Gas Industry Revenue Million Forecast, by Country 2019 & 2032
- Table 20: United States Shale Gas Industry Volume Trillion Forecast, by Country 2019 & 2032
Frequently Asked Questions
1. What is the projected Compound Annual Growth Rate (CAGR) of the United States Shale Gas Industry?
The projected CAGR is approximately > 3.50%.
2. Which companies are prominent players in the United States Shale Gas Industry?
Key companies in the market include Shell PLC, Exxon Mobil Corporation, Chevron Corporation, ConocoPhillips Company, Murphy Oil Corporation, Baker Hughes Company, TotalEnergies SE.
3. What are the main segments of the United States Shale Gas Industry?
The market segments include Type.
4. Can you provide details about the market size?
The market size is estimated to be USD XX Million as of 2022.
5. What are some drivers contributing to market growth?
4.; Modernization and Upgrades of Existing Military Aircraft Fleets4.; Increasing Defense Budgets.
6. What are the notable trends driving market growth?
Shale Gas to Dominate the Market.
7. Are there any restraints impacting market growth?
4.; Shift Toward Unmanned Aircraft.
8. Can you provide examples of recent developments in the market?
In January 2022, Oil India Ltd (OIL) exited from a US shale oil venture, selling its 20% stake to its venture partner for USD 25 million. The company had divested its entire stake in Niobrara shale asset, US.
9. What pricing options are available for accessing the report?
Pricing options include single-user, multi-user, and enterprise licenses priced at USD 3800, USD 4500, and USD 5800 respectively.
10. Is the market size provided in terms of value or volume?
The market size is provided in terms of value, measured in Million and volume, measured in Trillion.
11. Are there any specific market keywords associated with the report?
Yes, the market keyword associated with the report is "United States Shale Gas Industry," which aids in identifying and referencing the specific market segment covered.
12. How do I determine which pricing option suits my needs best?
The pricing options vary based on user requirements and access needs. Individual users may opt for single-user licenses, while businesses requiring broader access may choose multi-user or enterprise licenses for cost-effective access to the report.
13. Are there any additional resources or data provided in the United States Shale Gas Industry report?
While the report offers comprehensive insights, it's advisable to review the specific contents or supplementary materials provided to ascertain if additional resources or data are available.
14. How can I stay updated on further developments or reports in the United States Shale Gas Industry?
To stay informed about further developments, trends, and reports in the United States Shale Gas Industry, consider subscribing to industry newsletters, following relevant companies and organizations, or regularly checking reputable industry news sources and publications.
Methodology
Step 1 - Identification of Relevant Samples Size from Population Database


Step 2 - Approaches for Defining Global Market Size (Value, Volume* & Price*)

Note*: In applicable scenarios
Step 3 - Data Sources
Primary Research
- Web Analytics
- Survey Reports
- Research Institute
- Latest Research Reports
- Opinion Leaders
Secondary Research
- Annual Reports
- White Paper
- Latest Press Release
- Industry Association
- Paid Database
- Investor Presentations

Step 4 - Data Triangulation
Involves using different sources of information in order to increase the validity of a study
These sources are likely to be stakeholders in a program - participants, other researchers, program staff, other community members, and so on.
Then we put all data in single framework & apply various statistical tools to find out the dynamic on the market.
During the analysis stage, feedback from the stakeholder groups would be compared to determine areas of agreement as well as areas of divergence
