

Key Insights
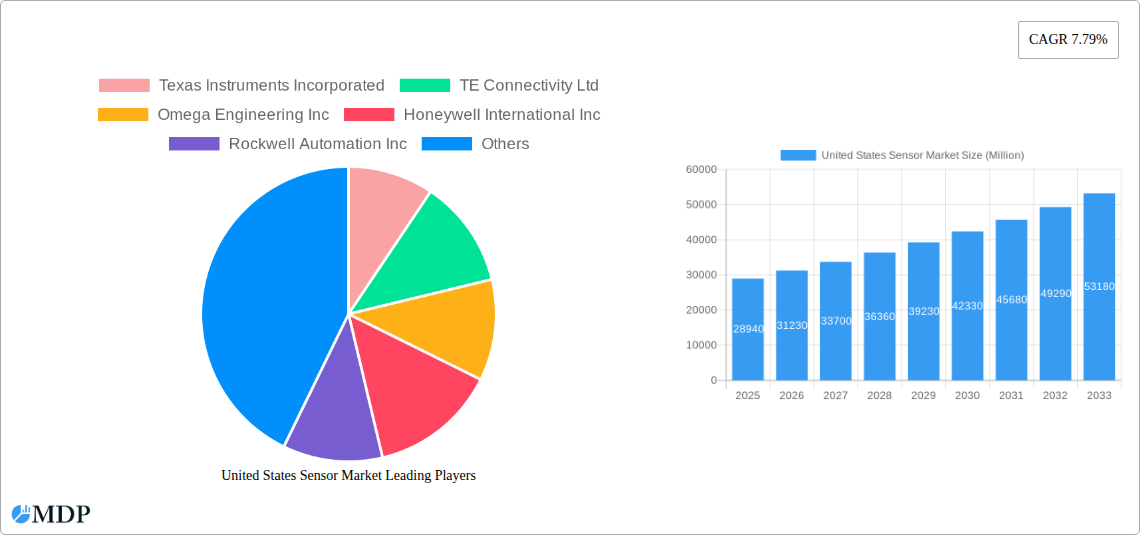
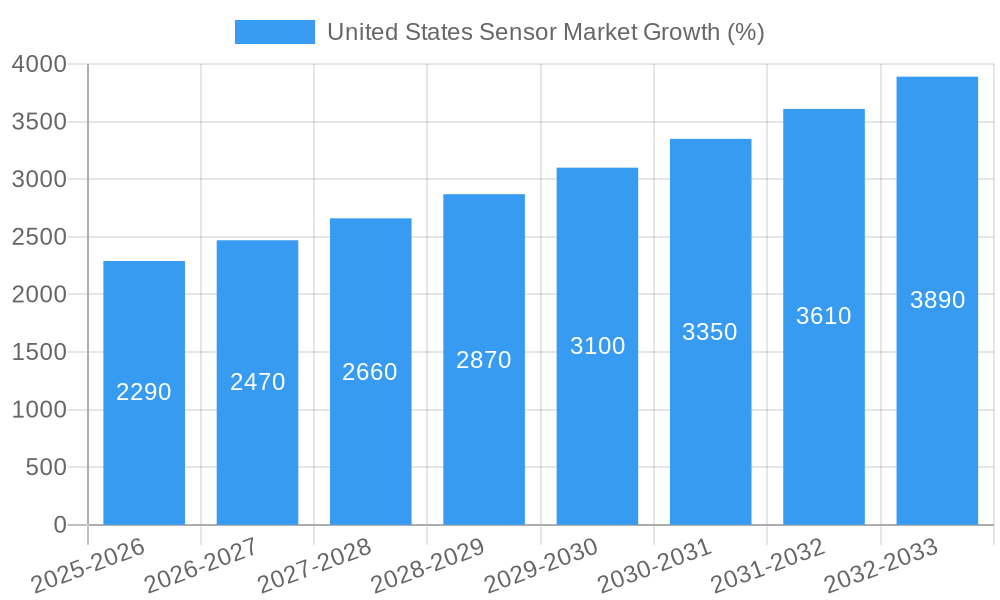
The United States sensor market, valued at $28.94 billion in 2025, is projected to experience robust growth, driven by increasing automation across various industries, the burgeoning Internet of Things (IoT) ecosystem, and the rising demand for advanced sensor technologies in automotive, healthcare, and industrial applications. A Compound Annual Growth Rate (CAGR) of 7.79% from 2025 to 2033 indicates a significant expansion, reaching an estimated market value exceeding $55 billion by 2033. This growth is fueled by technological advancements leading to smaller, more energy-efficient, and cost-effective sensors, enabling wider deployment across diverse applications. The market's segmentation likely includes various sensor types (e.g., temperature, pressure, image, gas), each exhibiting varying growth trajectories based on specific industry demands. Key players like Texas Instruments, TE Connectivity, and Honeywell are strategically investing in R&D and expanding their product portfolios to cater to this expanding market. Furthermore, the increasing adoption of AI and machine learning enhances the analytical capabilities derived from sensor data, further bolstering market growth.
Growth restraints might include the high initial investment costs associated with implementing sensor technology and the potential challenges related to data security and privacy as the volume of sensor data increases. Nevertheless, the overall market outlook remains positive, driven by the long-term trends of automation, digitalization, and the ongoing need for real-time data across diverse sectors. The competitive landscape is characterized by established players alongside innovative startups, resulting in continuous product improvement and the introduction of disruptive technologies. This dynamic interplay between established players and emerging technologies promises further market expansion and opportunities for both established companies and new entrants.
United States Sensor Market: A Comprehensive Analysis (2019-2033)
This in-depth report provides a comprehensive analysis of the United States sensor market, offering invaluable insights for industry stakeholders, investors, and strategic decision-makers. Covering the period from 2019 to 2033, with a focus on the base year 2025, this report unveils market dynamics, industry trends, leading players, and future growth opportunities. The market is projected to reach xx Million by 2033, exhibiting a CAGR of xx% during the forecast period (2025-2033).
United States Sensor Market Market Dynamics & Concentration
This section analyzes the competitive landscape, innovation drivers, regulatory influences, and market evolution within the US sensor market. The market exhibits a moderately concentrated structure, with key players such as Texas Instruments Incorporated, TE Connectivity Ltd, and Honeywell International Inc holding significant market share. However, the presence of numerous smaller, specialized companies indicates a dynamic and competitive environment.
Market Concentration: The Herfindahl-Hirschman Index (HHI) is estimated at xx, suggesting a moderately concentrated market. The top 5 players collectively hold an estimated xx% market share in 2025.
Innovation Drivers: Continuous advancements in sensor technology, particularly in miniaturization, improved accuracy, and enhanced connectivity (e.g., IoT integration), are driving market expansion. Government initiatives promoting automation and smart infrastructure further fuel innovation.
Regulatory Frameworks: Stringent regulatory compliance requirements, particularly concerning data privacy and safety standards across various industries (automotive, healthcare, industrial automation), influence market growth and necessitate investments in compliance-focused sensor technologies.
Product Substitutes: The emergence of alternative sensing technologies (e.g., LiDAR, advanced imaging systems) presents both opportunities and challenges for established sensor manufacturers. The report analyzes these competitive threats and their potential impact on market share.
End-User Trends: Increasing demand for automation, digitization, and data-driven decision-making across diverse sectors, including automotive, healthcare, manufacturing, and consumer electronics, creates substantial growth opportunities for sensor manufacturers.
M&A Activities: The US sensor market witnessed xx M&A deals between 2019 and 2024, indicating a trend of consolidation and strategic partnerships among industry players. These activities aim to expand product portfolios, enhance technological capabilities, and gain access to new markets.
United States Sensor Market Industry Trends & Analysis
This section delves into the key trends shaping the US sensor market. Market growth is primarily driven by the rising adoption of automation, IoT, and advanced technologies across various end-user industries. Technological disruptions, such as the emergence of 5G and AI-powered sensor solutions, are transforming market dynamics and presenting new opportunities. Consumer preferences increasingly favor miniaturized, high-precision, energy-efficient sensors with enhanced connectivity capabilities. Intense competition necessitates continuous innovation and cost optimization strategies. The market exhibits a significant growth trajectory with a projected CAGR of xx% from 2025 to 2033, driven by robust demand across major end-use segments. Market penetration for advanced sensor technologies, such as MEMS sensors and image sensors, is steadily increasing, reflecting a shift toward sophisticated sensing solutions.
Leading Markets & Segments in United States Sensor Market
The automotive sector is currently the dominant segment within the US sensor market, owing to the rapid adoption of advanced driver-assistance systems (ADAS) and autonomous vehicle technologies. The manufacturing sector also presents substantial growth potential, driven by automation and Industry 4.0 initiatives.
Key Drivers of Automotive Segment Dominance:
- High demand for ADAS features like parking assistance, lane departure warning, and adaptive cruise control.
- Increasing adoption of autonomous vehicles.
- Stringent safety regulations mandating advanced sensor technologies.
Key Drivers of Manufacturing Segment Growth:
- Growing implementation of smart factories and automation initiatives.
- Demand for improved process control and efficiency.
- Government incentives supporting industrial automation.
The report conducts in-depth analysis of the leading regions and segments within the United States, highlighting factors influencing market dominance and growth projections.
United States Sensor Market Product Developments
Recent product innovations demonstrate a clear trend towards miniaturization, improved accuracy, enhanced connectivity (e.g., wireless communication protocols), and power efficiency. New sensor applications are emerging in areas such as environmental monitoring, healthcare diagnostics, and smart home devices. Companies are focusing on developing sensors with improved integration capabilities and advanced data processing functionalities to offer comprehensive solutions.
Key Drivers of United States Sensor Market Growth
The US sensor market is propelled by technological advancements in sensor technology (e.g., MEMS, LiDAR), increased automation across industries, burgeoning IoT adoption, and supportive government policies emphasizing smart infrastructure development. Strong economic growth further fuels demand, while stringent regulations regarding safety and environmental monitoring drive the need for advanced sensor solutions. The rising popularity of connected devices and the growth of AI/ML applications also contribute significantly.
Challenges in the United States Sensor Market Market
Challenges include supply chain disruptions impacting component availability and pricing, intense competition among established and emerging players, and the complexity of integrating diverse sensor technologies within larger systems. Regulatory hurdles and compliance requirements pose additional obstacles, requiring significant investments in testing and certification. Fluctuations in raw material costs also impact profitability.
Emerging Opportunities in United States Sensor Market
The integration of AI and machine learning with sensor data provides enormous growth opportunities, enabling advanced analytics and predictive maintenance capabilities. Strategic partnerships across industries and the exploration of new applications in areas like precision agriculture and smart cities promise significant long-term growth. The expansion into emerging markets and the development of specialized sensor solutions catering to niche applications also present lucrative opportunities.
Leading Players in the United States Sensor Market Sector
- Texas Instruments Incorporated
- TE Connectivity Ltd
- Omega Engineering Inc
- Honeywell International Inc
- Rockwell Automation Inc
- Siemens AG
- STMicroelectronics Inc
- AMS Osram AG
- NXP Semiconductors NV
- Infineon Technologies AG
- Bosch Sensortec GmbH
- Sick AG
- ABB Limited
- Omron Corporation
- Allegro MicroSystems Inc
Key Milestones in United States Sensor Market Industry
- January 2024: Texas Instruments (TI) unveiled AWR2544, a 77GHz millimeter-wave radar sensor chip, boosting autonomy in ADAS.
- April 2024: TE Connectivity (TE) launched two wireless pressure sensors (65xxN and 69xxN) for periodic condition monitoring, leveraging BLE 5.3 technology.
Strategic Outlook for United States Sensor Market Market
The US sensor market is poised for substantial growth, driven by technological advancements, increasing automation, and expanding applications across diverse sectors. Strategic opportunities lie in developing innovative sensor solutions, fostering strategic partnerships, and capitalizing on emerging technologies like AI and 5G. Companies focusing on innovation, cost-effectiveness, and market diversification are expected to thrive in this dynamic and competitive market.
United States Sensor Market Segmentation
-
1. Product Type
- 1.1. Pressure
- 1.2. Level
- 1.3. Flow
- 1.4. Proximity
- 1.5. Environmental
- 1.6. Chemical
- 1.7. Inertial
-
1.8. Magnetic
- 1.8.1. Hall Effect Sensors
- 1.8.2. Other Magnetic Sensors
- 1.9. Position Sensors
- 1.10. Current Sensors
- 1.11. Other Types
-
2. Mode of Operation
- 2.1. Optical
- 2.2. Electrical Resistance
- 2.3. Biosensor
- 2.4. Piezoresistive
- 2.5. Image
- 2.6. Capacitive
- 2.7. Piezoelectric
- 2.8. Lidar
- 2.9. Radar
- 2.10. Other Modes of Operation
-
3. End-user Industry
- 3.1. Automotive
- 3.2. Consumer Electronics
- 3.3. Energy
- 3.4. Industrial and Other
- 3.5. Medical and Wellness
- 3.6. Construction, Agriculture and Mining
- 3.7. Aerospace
- 3.8. Robotics
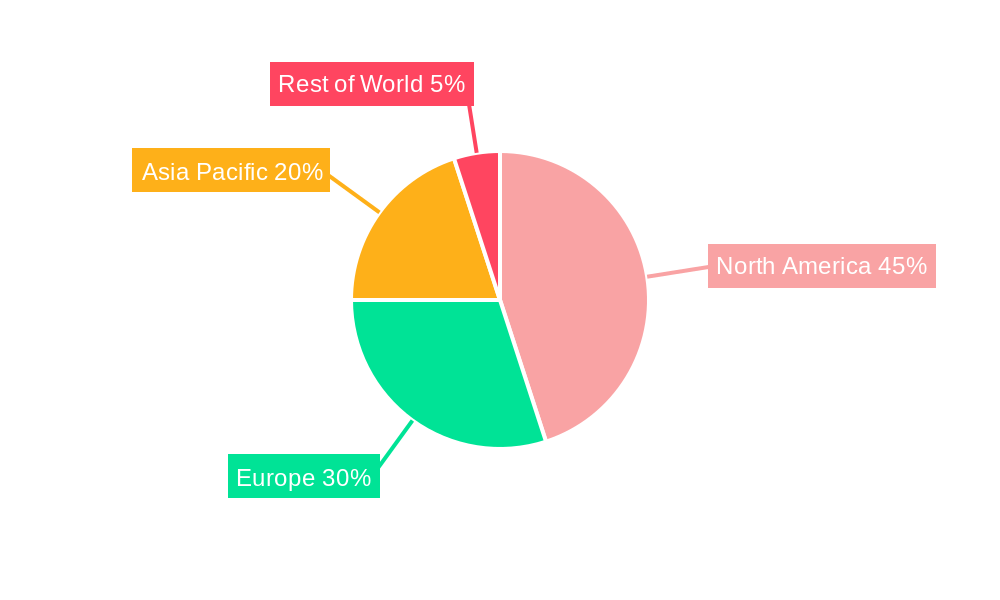
United States Sensor Market Segmentation By Geography
- 1. United States
United States Sensor Market REPORT HIGHLIGHTS
| Aspects | Details |
|---|---|
| Study Period | 2019-2033 |
| Base Year | 2024 |
| Estimated Year | 2025 |
| Forecast Period | 2025-2033 |
| Historical Period | 2019-2024 |
| Growth Rate | CAGR of 7.79% from 2019-2033 |
| Segmentation |
|
Table of Contents
- 1. Introduction
- 1.1. Research Scope
- 1.2. Market Segmentation
- 1.3. Research Methodology
- 1.4. Definitions and Assumptions
- 2. Executive Summary
- 2.1. Introduction
- 3. Market Dynamics
- 3.1. Introduction
- 3.2. Market Drivers
- 3.2.1. Rising Demand for IoT and Connected Devices; Increasing Adoption of Advanced Sensor Technologies in Automotive Industry
- 3.3. Market Restrains
- 3.3.1. Rising Demand for IoT and Connected Devices; Increasing Adoption of Advanced Sensor Technologies in Automotive Industry
- 3.4. Market Trends
- 3.4.1. Retractable Safety Syringes Segment Expected to Witness Significant Growth During the Forecast Period
- 4. Market Factor Analysis
- 4.1. Porters Five Forces
- 4.2. Supply/Value Chain
- 4.3. PESTEL analysis
- 4.4. Market Entropy
- 4.5. Patent/Trademark Analysis
- 5. United States Sensor Market Analysis, Insights and Forecast, 2019-2031
- 5.1. Market Analysis, Insights and Forecast - by Product Type
- 5.1.1. Pressure
- 5.1.2. Level
- 5.1.3. Flow
- 5.1.4. Proximity
- 5.1.5. Environmental
- 5.1.6. Chemical
- 5.1.7. Inertial
- 5.1.8. Magnetic
- 5.1.8.1. Hall Effect Sensors
- 5.1.8.2. Other Magnetic Sensors
- 5.1.9. Position Sensors
- 5.1.10. Current Sensors
- 5.1.11. Other Types
- 5.2. Market Analysis, Insights and Forecast - by Mode of Operation
- 5.2.1. Optical
- 5.2.2. Electrical Resistance
- 5.2.3. Biosensor
- 5.2.4. Piezoresistive
- 5.2.5. Image
- 5.2.6. Capacitive
- 5.2.7. Piezoelectric
- 5.2.8. Lidar
- 5.2.9. Radar
- 5.2.10. Other Modes of Operation
- 5.3. Market Analysis, Insights and Forecast - by End-user Industry
- 5.3.1. Automotive
- 5.3.2. Consumer Electronics
- 5.3.3. Energy
- 5.3.4. Industrial and Other
- 5.3.5. Medical and Wellness
- 5.3.6. Construction, Agriculture and Mining
- 5.3.7. Aerospace
- 5.3.8. Robotics
- 5.4. Market Analysis, Insights and Forecast - by Region
- 5.4.1. United States
- 5.1. Market Analysis, Insights and Forecast - by Product Type
- 6. Competitive Analysis
- 6.1. Market Share Analysis 2024
- 6.2. Company Profiles
- 6.2.1 Texas Instruments Incorporated
- 6.2.1.1. Overview
- 6.2.1.2. Products
- 6.2.1.3. SWOT Analysis
- 6.2.1.4. Recent Developments
- 6.2.1.5. Financials (Based on Availability)
- 6.2.2 TE Connectivity Ltd
- 6.2.2.1. Overview
- 6.2.2.2. Products
- 6.2.2.3. SWOT Analysis
- 6.2.2.4. Recent Developments
- 6.2.2.5. Financials (Based on Availability)
- 6.2.3 Omega Engineering Inc
- 6.2.3.1. Overview
- 6.2.3.2. Products
- 6.2.3.3. SWOT Analysis
- 6.2.3.4. Recent Developments
- 6.2.3.5. Financials (Based on Availability)
- 6.2.4 Honeywell International Inc
- 6.2.4.1. Overview
- 6.2.4.2. Products
- 6.2.4.3. SWOT Analysis
- 6.2.4.4. Recent Developments
- 6.2.4.5. Financials (Based on Availability)
- 6.2.5 Rockwell Automation Inc
- 6.2.5.1. Overview
- 6.2.5.2. Products
- 6.2.5.3. SWOT Analysis
- 6.2.5.4. Recent Developments
- 6.2.5.5. Financials (Based on Availability)
- 6.2.6 Siemens AG
- 6.2.6.1. Overview
- 6.2.6.2. Products
- 6.2.6.3. SWOT Analysis
- 6.2.6.4. Recent Developments
- 6.2.6.5. Financials (Based on Availability)
- 6.2.7 STMicroelectronics Inc
- 6.2.7.1. Overview
- 6.2.7.2. Products
- 6.2.7.3. SWOT Analysis
- 6.2.7.4. Recent Developments
- 6.2.7.5. Financials (Based on Availability)
- 6.2.8 AMS Osram AG
- 6.2.8.1. Overview
- 6.2.8.2. Products
- 6.2.8.3. SWOT Analysis
- 6.2.8.4. Recent Developments
- 6.2.8.5. Financials (Based on Availability)
- 6.2.9 NXP Semiconductors NV
- 6.2.9.1. Overview
- 6.2.9.2. Products
- 6.2.9.3. SWOT Analysis
- 6.2.9.4. Recent Developments
- 6.2.9.5. Financials (Based on Availability)
- 6.2.10 Infineon Technologies AG
- 6.2.10.1. Overview
- 6.2.10.2. Products
- 6.2.10.3. SWOT Analysis
- 6.2.10.4. Recent Developments
- 6.2.10.5. Financials (Based on Availability)
- 6.2.11 Bosch Sensortec GmbH
- 6.2.11.1. Overview
- 6.2.11.2. Products
- 6.2.11.3. SWOT Analysis
- 6.2.11.4. Recent Developments
- 6.2.11.5. Financials (Based on Availability)
- 6.2.12 Sick AG
- 6.2.12.1. Overview
- 6.2.12.2. Products
- 6.2.12.3. SWOT Analysis
- 6.2.12.4. Recent Developments
- 6.2.12.5. Financials (Based on Availability)
- 6.2.13 ABB Limited
- 6.2.13.1. Overview
- 6.2.13.2. Products
- 6.2.13.3. SWOT Analysis
- 6.2.13.4. Recent Developments
- 6.2.13.5. Financials (Based on Availability)
- 6.2.14 Omron Corporation
- 6.2.14.1. Overview
- 6.2.14.2. Products
- 6.2.14.3. SWOT Analysis
- 6.2.14.4. Recent Developments
- 6.2.14.5. Financials (Based on Availability)
- 6.2.15 Allegro MicroSystems In
- 6.2.15.1. Overview
- 6.2.15.2. Products
- 6.2.15.3. SWOT Analysis
- 6.2.15.4. Recent Developments
- 6.2.15.5. Financials (Based on Availability)
- 6.2.1 Texas Instruments Incorporated
List of Figures
- Figure 1: United States Sensor Market Revenue Breakdown (Million, %) by Product 2024 & 2032
- Figure 2: United States Sensor Market Share (%) by Company 2024
List of Tables
- Table 1: United States Sensor Market Revenue Million Forecast, by Region 2019 & 2032
- Table 2: United States Sensor Market Volume Billion Forecast, by Region 2019 & 2032
- Table 3: United States Sensor Market Revenue Million Forecast, by Product Type 2019 & 2032
- Table 4: United States Sensor Market Volume Billion Forecast, by Product Type 2019 & 2032
- Table 5: United States Sensor Market Revenue Million Forecast, by Mode of Operation 2019 & 2032
- Table 6: United States Sensor Market Volume Billion Forecast, by Mode of Operation 2019 & 2032
- Table 7: United States Sensor Market Revenue Million Forecast, by End-user Industry 2019 & 2032
- Table 8: United States Sensor Market Volume Billion Forecast, by End-user Industry 2019 & 2032
- Table 9: United States Sensor Market Revenue Million Forecast, by Region 2019 & 2032
- Table 10: United States Sensor Market Volume Billion Forecast, by Region 2019 & 2032
- Table 11: United States Sensor Market Revenue Million Forecast, by Product Type 2019 & 2032
- Table 12: United States Sensor Market Volume Billion Forecast, by Product Type 2019 & 2032
- Table 13: United States Sensor Market Revenue Million Forecast, by Mode of Operation 2019 & 2032
- Table 14: United States Sensor Market Volume Billion Forecast, by Mode of Operation 2019 & 2032
- Table 15: United States Sensor Market Revenue Million Forecast, by End-user Industry 2019 & 2032
- Table 16: United States Sensor Market Volume Billion Forecast, by End-user Industry 2019 & 2032
- Table 17: United States Sensor Market Revenue Million Forecast, by Country 2019 & 2032
- Table 18: United States Sensor Market Volume Billion Forecast, by Country 2019 & 2032
Frequently Asked Questions
1. What is the projected Compound Annual Growth Rate (CAGR) of the United States Sensor Market?
The projected CAGR is approximately 7.79%.
2. Which companies are prominent players in the United States Sensor Market?
Key companies in the market include Texas Instruments Incorporated, TE Connectivity Ltd, Omega Engineering Inc, Honeywell International Inc, Rockwell Automation Inc, Siemens AG, STMicroelectronics Inc, AMS Osram AG, NXP Semiconductors NV, Infineon Technologies AG, Bosch Sensortec GmbH, Sick AG, ABB Limited, Omron Corporation, Allegro MicroSystems In.
3. What are the main segments of the United States Sensor Market?
The market segments include Product Type, Mode of Operation, End-user Industry.
4. Can you provide details about the market size?
The market size is estimated to be USD 28.94 Million as of 2022.
5. What are some drivers contributing to market growth?
Rising Demand for IoT and Connected Devices; Increasing Adoption of Advanced Sensor Technologies in Automotive Industry.
6. What are the notable trends driving market growth?
Retractable Safety Syringes Segment Expected to Witness Significant Growth During the Forecast Period.
7. Are there any restraints impacting market growth?
Rising Demand for IoT and Connected Devices; Increasing Adoption of Advanced Sensor Technologies in Automotive Industry.
8. Can you provide examples of recent developments in the market?
April 2024 - TE Connectivity (TE) expanded its product line by introducing two cutting-edge wireless pressure sensors. The first, the 65xxN sensor, is tailored for short-range applications, while the second, the 69xxN sensor, is optimized for long-range coverage. Both sensors are specifically crafted for periodic condition monitoring. Notably, the 65xxN sensor utilizes BLE (Bluetooth Low Energy) 5.3 technology, enabling seamless localized data collection and transmission.
9. What pricing options are available for accessing the report?
Pricing options include single-user, multi-user, and enterprise licenses priced at USD 3800, USD 4500, and USD 5800 respectively.
10. Is the market size provided in terms of value or volume?
The market size is provided in terms of value, measured in Million and volume, measured in Billion.
11. Are there any specific market keywords associated with the report?
Yes, the market keyword associated with the report is "United States Sensor Market," which aids in identifying and referencing the specific market segment covered.
12. How do I determine which pricing option suits my needs best?
The pricing options vary based on user requirements and access needs. Individual users may opt for single-user licenses, while businesses requiring broader access may choose multi-user or enterprise licenses for cost-effective access to the report.
13. Are there any additional resources or data provided in the United States Sensor Market report?
While the report offers comprehensive insights, it's advisable to review the specific contents or supplementary materials provided to ascertain if additional resources or data are available.
14. How can I stay updated on further developments or reports in the United States Sensor Market?
To stay informed about further developments, trends, and reports in the United States Sensor Market, consider subscribing to industry newsletters, following relevant companies and organizations, or regularly checking reputable industry news sources and publications.
Methodology
Step 1 - Identification of Relevant Samples Size from Population Database


Step 2 - Approaches for Defining Global Market Size (Value, Volume* & Price*)

Note*: In applicable scenarios
Step 3 - Data Sources
Primary Research
- Web Analytics
- Survey Reports
- Research Institute
- Latest Research Reports
- Opinion Leaders
Secondary Research
- Annual Reports
- White Paper
- Latest Press Release
- Industry Association
- Paid Database
- Investor Presentations

Step 4 - Data Triangulation
Involves using different sources of information in order to increase the validity of a study
These sources are likely to be stakeholders in a program - participants, other researchers, program staff, other community members, and so on.
Then we put all data in single framework & apply various statistical tools to find out the dynamic on the market.
During the analysis stage, feedback from the stakeholder groups would be compared to determine areas of agreement as well as areas of divergence
