

Key Insights
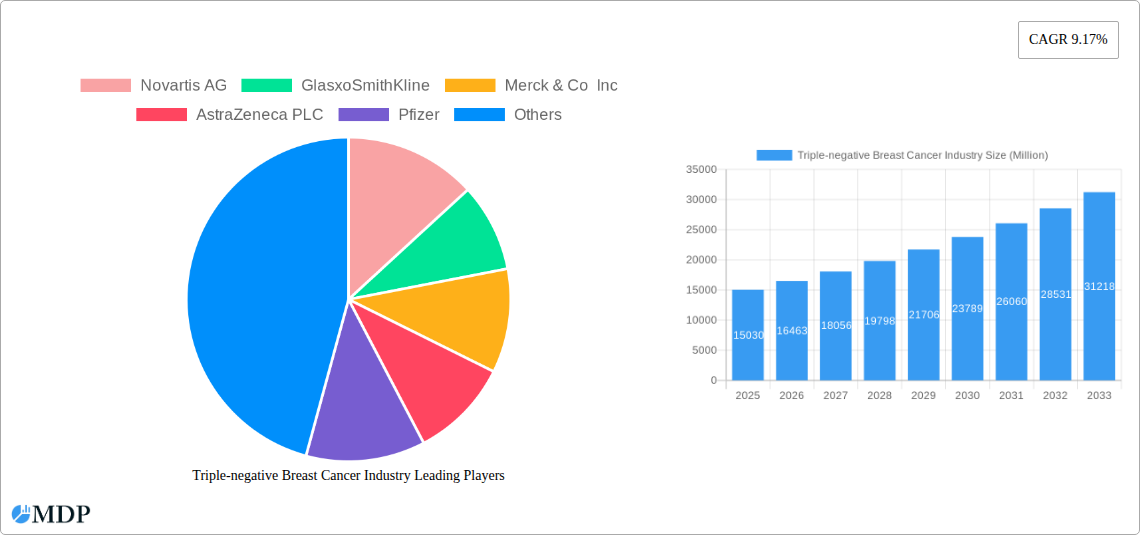
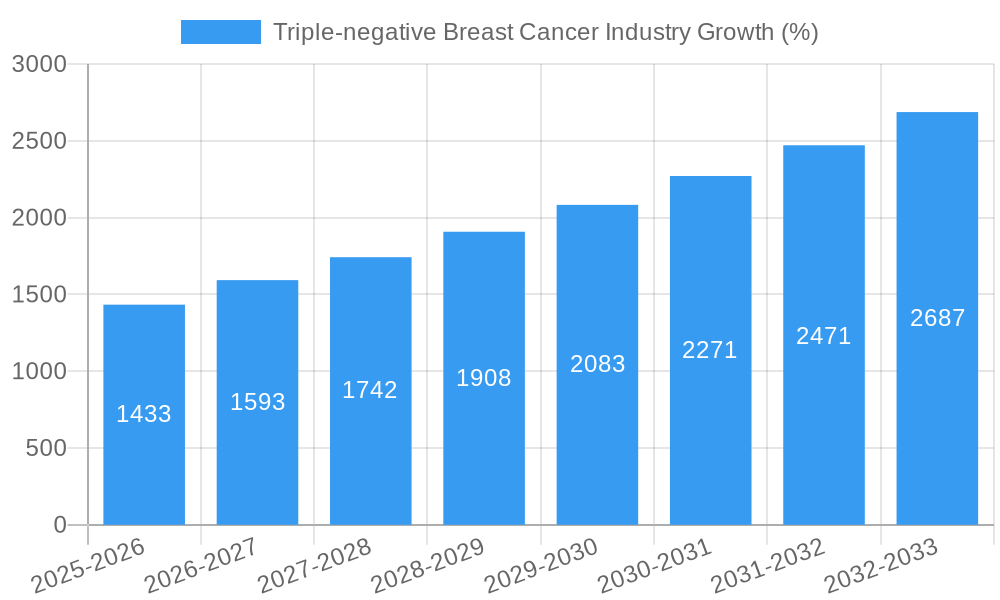
The triple-negative breast cancer (TNBC) market, valued at $15.03 billion in 2025, is projected for robust growth, exhibiting a compound annual growth rate (CAGR) of 9.17% from 2025 to 2033. This significant expansion is driven by several factors. Increasing prevalence of TNBC, particularly among younger women, fuels demand for effective treatments. Advancements in targeted therapies, immunotherapy, and combination regimens are improving patient outcomes and extending survival rates, further stimulating market growth. The rising awareness and improved diagnostic capabilities are leading to earlier detection and more timely interventions, contributing to the market's expansion. Furthermore, the growing research and development activities focused on novel therapies for TNBC, including antibody-drug conjugates and PARP inhibitors, are expected to significantly influence market dynamics in the coming years. Significant investments by pharmaceutical companies in clinical trials and drug development further solidify the positive outlook for this sector.
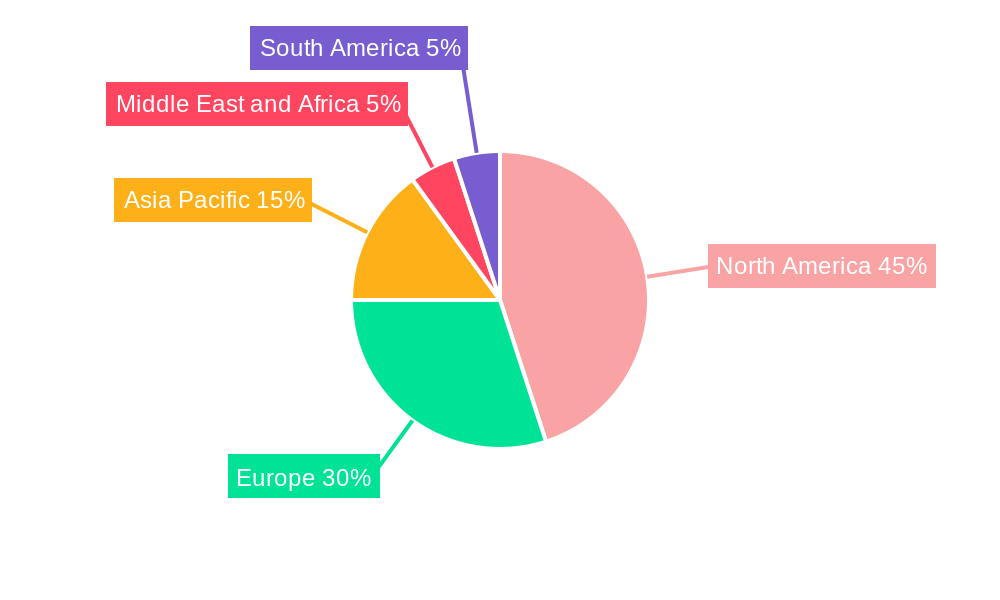
Geographic variations in market share are anticipated, with North America and Europe likely to maintain substantial market dominance due to advanced healthcare infrastructure, higher healthcare expenditure, and greater awareness about TNBC. However, the Asia-Pacific region is poised for accelerated growth, driven by increasing healthcare spending, rising prevalence rates, and improving healthcare access. The market segmentation by treatment type – chemotherapy, radiation therapy, hormonal therapy, and others – reflects the multifaceted approach to TNBC management, with chemotherapy currently holding a larger share but other therapies gaining momentum as targeted treatments become more prevalent and accessible. The competitive landscape comprises major pharmaceutical players such as Novartis AG, GlaxoSmithKline, Merck & Co Inc, AstraZeneca PLC, Pfizer, Eli Lilly and Company, and Bristol Myers Squibb Company (Celgene Corporation), each vying for market share through innovative drug development and strategic partnerships. The forecast period of 2025-2033 promises continued market expansion, presenting substantial opportunities for stakeholders in the TNBC treatment arena.
Triple-Negative Breast Cancer Industry: A Comprehensive Market Report (2019-2033)
This comprehensive report provides a detailed analysis of the Triple-Negative Breast Cancer (TNBC) industry, offering invaluable insights for stakeholders, investors, and industry professionals. With a study period spanning 2019-2033, a base year of 2025, and a forecast period of 2025-2033, this report leverages historical data (2019-2024) to project future market trends and opportunities. The global TNBC market is expected to reach xx Million by 2033, exhibiting a CAGR of xx% during the forecast period.
Triple-negative Breast Cancer Industry Market Dynamics & Concentration
The TNBC market is characterized by a moderately concentrated landscape with key players actively engaged in R&D and strategic collaborations. Market concentration is influenced by factors such as the cost of drug development, regulatory hurdles, and patent expirations. The market share of the top five players accounts for approximately xx% of the global market in 2025.
Innovation Drivers: Significant advancements in immunotherapy, targeted therapies, and combination regimens are driving innovation. The increasing understanding of the TNBC disease biology fuels the development of novel treatment approaches.
Regulatory Frameworks: Stringent regulatory approvals and reimbursement policies impact market access and timelines for new drug launches. Harmonization of global regulatory processes is a crucial factor influencing market dynamics.
Product Substitutes: The absence of targeted therapies historically has made chemotherapy the primary treatment modality. However, emerging therapies are acting as substitutes, offering improved efficacy and reduced side effects.
End-User Trends: Increased awareness and advocacy initiatives among patients and patient advocacy groups are driving demand for better treatment options and personalized medicine approaches.
M&A Activities: The TNBC market has witnessed a significant number of mergers and acquisitions (M&A) in recent years, with xx M&A deals recorded between 2019 and 2024. These activities reflect the strategic efforts of companies to expand their pipelines and market share.
Triple-negative Breast Cancer Industry Industry Trends & Analysis
The TNBC market is witnessing robust growth driven by several factors. The increasing prevalence of TNBC, particularly among younger women, fuels market expansion. Technological advancements, such as the development of novel biomarkers and targeted therapies, are improving treatment outcomes and driving market growth. The growing adoption of personalized medicine, leveraging genomic profiling to tailor treatment strategies, is another significant trend impacting the market. A shift towards combination therapies is also observed, aiming to improve efficacy and overcome treatment resistance. The global market is expected to witness a CAGR of xx% between 2025 and 2033, reaching xx Million by the end of the forecast period. Market penetration of novel therapies remains relatively low compared to established treatments, but is expected to increase in the coming years with further clinical evidence and regulatory approvals. Competitive dynamics are highly influenced by the ongoing race to develop effective and safe therapies, fueling innovation and shaping market strategies of key players.
Leading Markets & Segments in Triple-negative Breast Cancer Industry
The North American market currently dominates the global TNBC market, owing to high healthcare expenditure, strong research infrastructure, and early adoption of innovative therapies.
Key Drivers in North America:
- High healthcare expenditure and insurance coverage
- Well-established research and clinical trial infrastructure
- Strong regulatory support for new drug approvals
- High awareness among patients and healthcare professionals
Type of Treatment Segmentation:
- Chemotherapy: Remains the cornerstone of TNBC treatment, accounting for the largest segment share (xx%). However, its limitations in terms of efficacy and side effects are driving the growth of other segments.
- Immunotherapy: Emerging as a promising treatment modality, offering potential for improved outcomes and patient survival. Market growth is driven by advancements in understanding the tumor microenvironment and immune checkpoints. This segment is predicted to experience the highest growth rate.
- Targeted therapy: The development of targeted therapies is still in its early stages, but shows potential to personalize treatment and improve efficacy.
- Radiation therapy: An established component of treatment, especially in localized settings, providing localized tumor control.
A detailed analysis reveals that Chemotherapy is the largest segment, driven by its established role and widespread availability. However, the growth in Immunotherapy suggests a potential shift in the segment's dominance in the coming years. Growth in these segments is anticipated to be driven by continued clinical research, regulatory approvals, and increased adoption in treatment protocols.
Triple-negative Breast Cancer Industry Product Developments
Recent advancements include the development of novel immunotherapies, such as immune checkpoint inhibitors, and targeted therapies focusing on specific molecular targets in TNBC cells. These therapies offer the potential for improved response rates, fewer side effects, and longer survival times. Combination approaches are becoming increasingly common, leveraging the synergistic effects of various treatment modalities to optimize patient outcomes. The market is also witnessing a surge in companion diagnostics, allowing for better patient selection and personalized therapy approaches. These trends are reshaping the competitive landscape, with companies focusing on developing innovative treatment combinations and companion diagnostics for improved outcomes.
Key Drivers of Triple-negative Breast Cancer Industry Growth
Several factors are driving the growth of the TNBC market. Firstly, the rising prevalence of TNBC globally is a major contributor. Secondly, increased research and development leading to novel therapies are expanding treatment options. Thirdly, growing awareness and advocacy among patients and healthcare professionals are fueling demand. Finally, favorable regulatory frameworks in certain regions are supporting market expansion.
Challenges in the Triple-negative Breast Cancer Industry Market
Despite promising advancements, the TNBC market faces significant challenges. The development of effective and safe therapies is hampered by the aggressive nature of TNBC and the heterogeneity of the disease. High drug development costs and stringent regulatory approvals pose considerable barriers to entry for new players. Competition among established pharmaceutical companies, coupled with the emergence of novel treatment approaches, creates further challenges in the market. Approximately xx Million is invested annually in R&D for therapies, demonstrating the considerable investment required.
Emerging Opportunities in Triple-negative Breast Cancer Industry
The TNBC market presents significant opportunities for long-term growth. Advancements in immunotherapy, coupled with the exploration of novel drug targets and combination therapies, offer avenues for significant improvement in treatment outcomes. Strategic collaborations between pharmaceutical companies and research institutions are accelerating the pace of innovation. The expanding global healthcare infrastructure and increasing investment in healthcare R&D further contribute to the long-term growth prospects of the TNBC market.
Leading Players in the Triple-negative Breast Cancer Industry Sector
- Novartis AG
- GlaxoSmithKline
- Merck & Co Inc
- AstraZeneca PLC
- Pfizer
- Eli Lilly and Company
- Bristol Myers Squibb Company (Celgene Corporation)
Key Milestones in Triple-negative Breast Cancer Industry Industry
- September 2022: Novartis announced results from the MONALEESA Phase III program, showing an additional year of overall survival benefit in a subgroup of HR+/HER2- advanced breast cancer patients. This highlights the potential for improved treatment outcomes with targeted therapies.
- May 2022: Pfizer presented positive real-world evidence for IBRANCE (palbociclib) combination therapy in HR+, HER2- metastatic breast cancer, reinforcing its efficacy in clinical practice. This strengthens the market position of IBRANCE and underscores the importance of real-world data in treatment decision-making.
- April 2022: Merck received a positive opinion from the CHMP for KEYTRUDA in combination with chemotherapy for TNBC, expanding treatment options for this aggressive cancer type. This approval signifies a significant advancement in TNBC treatment and increases the market potential of KEYTRUDA in this setting.
Strategic Outlook for Triple-negative Breast Cancer Industry Market
The TNBC market exhibits substantial growth potential driven by ongoing research and development of innovative therapies. Strategic partnerships, collaborations, and acquisitions are expected to reshape the competitive landscape. The focus on personalized medicine and the development of companion diagnostics will further enhance treatment outcomes and shape future market dynamics. The successful development and commercialization of novel therapies, combined with increased awareness and advocacy efforts, will contribute to the significant growth of this sector in the coming years.
Triple-negative Breast Cancer Industry Segmentation
-
1. Type of Treatment
- 1.1. Chemotherapy
- 1.2. Radiation
- 1.3. Hormonal Therapy
- 1.4. Others
Triple-negative Breast Cancer Industry Segmentation By Geography
-
1. North America
- 1.1. United States
- 1.2. Canada
- 1.3. Mexico
-
2. Europe
- 2.1. Germany
- 2.2. United Kingdom
- 2.3. France
- 2.4. Italy
- 2.5. Spain
- 2.6. Rest of Europe
-
3. Asia Pacific
- 3.1. China
- 3.2. Japan
- 3.3. India
- 3.4. Australia
- 3.5. South Korea
- 3.6. Rest of Asia Pacific
-
4. Middle East and Africa
- 4.1. GCC
- 4.2. South Africa
- 4.3. Rest of Middle East and Africa
-
5. South America
- 5.1. Brazil
- 5.2. Argentina
- 5.3. Rest of South America
Triple-negative Breast Cancer Industry REPORT HIGHLIGHTS
| Aspects | Details |
|---|---|
| Study Period | 2019-2033 |
| Base Year | 2024 |
| Estimated Year | 2025 |
| Forecast Period | 2025-2033 |
| Historical Period | 2019-2024 |
| Growth Rate | CAGR of 9.17% from 2019-2033 |
| Segmentation |
|
Table of Contents
- 1. Introduction
- 1.1. Research Scope
- 1.2. Market Segmentation
- 1.3. Research Methodology
- 1.4. Definitions and Assumptions
- 2. Executive Summary
- 2.1. Introduction
- 3. Market Dynamics
- 3.1. Introduction
- 3.2. Market Drivers
- 3.2.1. Growing Burden of Breast Cancers; Medical Advancements by Breast Cancers Treatment
- 3.3. Market Restrains
- 3.3.1. Lack of Skilled Professional for Operating using Intracranial Stents; Cerebrovascular Complications Related to Intracranial Stenting
- 3.4. Market Trends
- 3.4.1. Chemotherapy Is Identified as the Most Lucrative Segment of HER-2 Negative Breast Cancer Market
- 4. Market Factor Analysis
- 4.1. Porters Five Forces
- 4.2. Supply/Value Chain
- 4.3. PESTEL analysis
- 4.4. Market Entropy
- 4.5. Patent/Trademark Analysis
- 5. Global Triple-negative Breast Cancer Industry Analysis, Insights and Forecast, 2019-2031
- 5.1. Market Analysis, Insights and Forecast - by Type of Treatment
- 5.1.1. Chemotherapy
- 5.1.2. Radiation
- 5.1.3. Hormonal Therapy
- 5.1.4. Others
- 5.2. Market Analysis, Insights and Forecast - by Region
- 5.2.1. North America
- 5.2.2. Europe
- 5.2.3. Asia Pacific
- 5.2.4. Middle East and Africa
- 5.2.5. South America
- 5.1. Market Analysis, Insights and Forecast - by Type of Treatment
- 6. North America Triple-negative Breast Cancer Industry Analysis, Insights and Forecast, 2019-2031
- 6.1. Market Analysis, Insights and Forecast - by Type of Treatment
- 6.1.1. Chemotherapy
- 6.1.2. Radiation
- 6.1.3. Hormonal Therapy
- 6.1.4. Others
- 6.1. Market Analysis, Insights and Forecast - by Type of Treatment
- 7. Europe Triple-negative Breast Cancer Industry Analysis, Insights and Forecast, 2019-2031
- 7.1. Market Analysis, Insights and Forecast - by Type of Treatment
- 7.1.1. Chemotherapy
- 7.1.2. Radiation
- 7.1.3. Hormonal Therapy
- 7.1.4. Others
- 7.1. Market Analysis, Insights and Forecast - by Type of Treatment
- 8. Asia Pacific Triple-negative Breast Cancer Industry Analysis, Insights and Forecast, 2019-2031
- 8.1. Market Analysis, Insights and Forecast - by Type of Treatment
- 8.1.1. Chemotherapy
- 8.1.2. Radiation
- 8.1.3. Hormonal Therapy
- 8.1.4. Others
- 8.1. Market Analysis, Insights and Forecast - by Type of Treatment
- 9. Middle East and Africa Triple-negative Breast Cancer Industry Analysis, Insights and Forecast, 2019-2031
- 9.1. Market Analysis, Insights and Forecast - by Type of Treatment
- 9.1.1. Chemotherapy
- 9.1.2. Radiation
- 9.1.3. Hormonal Therapy
- 9.1.4. Others
- 9.1. Market Analysis, Insights and Forecast - by Type of Treatment
- 10. South America Triple-negative Breast Cancer Industry Analysis, Insights and Forecast, 2019-2031
- 10.1. Market Analysis, Insights and Forecast - by Type of Treatment
- 10.1.1. Chemotherapy
- 10.1.2. Radiation
- 10.1.3. Hormonal Therapy
- 10.1.4. Others
- 10.1. Market Analysis, Insights and Forecast - by Type of Treatment
- 11. North America Triple-negative Breast Cancer Industry Analysis, Insights and Forecast, 2019-2031
- 11.1. Market Analysis, Insights and Forecast - By Country/Sub-region
- 11.1.1. undefined
- 12. Europe Triple-negative Breast Cancer Industry Analysis, Insights and Forecast, 2019-2031
- 12.1. Market Analysis, Insights and Forecast - By Country/Sub-region
- 12.1.1. undefined
- 13. Asia Pacific Triple-negative Breast Cancer Industry Analysis, Insights and Forecast, 2019-2031
- 13.1. Market Analysis, Insights and Forecast - By Country/Sub-region
- 13.1.1. undefined
- 14. Middle East and Africa Triple-negative Breast Cancer Industry Analysis, Insights and Forecast, 2019-2031
- 14.1. Market Analysis, Insights and Forecast - By Country/Sub-region
- 14.1.1. undefined
- 15. South America Triple-negative Breast Cancer Industry Analysis, Insights and Forecast, 2019-2031
- 15.1. Market Analysis, Insights and Forecast - By Country/Sub-region
- 15.1.1. undefined
- 16. Competitive Analysis
- 16.1. Global Market Share Analysis 2024
- 16.2. Company Profiles
- 16.2.1 Novartis AG
- 16.2.1.1. Overview
- 16.2.1.2. Products
- 16.2.1.3. SWOT Analysis
- 16.2.1.4. Recent Developments
- 16.2.1.5. Financials (Based on Availability)
- 16.2.2 GlasxoSmithKline
- 16.2.2.1. Overview
- 16.2.2.2. Products
- 16.2.2.3. SWOT Analysis
- 16.2.2.4. Recent Developments
- 16.2.2.5. Financials (Based on Availability)
- 16.2.3 Merck & Co Inc
- 16.2.3.1. Overview
- 16.2.3.2. Products
- 16.2.3.3. SWOT Analysis
- 16.2.3.4. Recent Developments
- 16.2.3.5. Financials (Based on Availability)
- 16.2.4 AstraZeneca PLC
- 16.2.4.1. Overview
- 16.2.4.2. Products
- 16.2.4.3. SWOT Analysis
- 16.2.4.4. Recent Developments
- 16.2.4.5. Financials (Based on Availability)
- 16.2.5 Pfizer
- 16.2.5.1. Overview
- 16.2.5.2. Products
- 16.2.5.3. SWOT Analysis
- 16.2.5.4. Recent Developments
- 16.2.5.5. Financials (Based on Availability)
- 16.2.6 Eli Lilly and Company
- 16.2.6.1. Overview
- 16.2.6.2. Products
- 16.2.6.3. SWOT Analysis
- 16.2.6.4. Recent Developments
- 16.2.6.5. Financials (Based on Availability)
- 16.2.7 Bristol Myers Squibb Company (Celgene Corporation)
- 16.2.7.1. Overview
- 16.2.7.2. Products
- 16.2.7.3. SWOT Analysis
- 16.2.7.4. Recent Developments
- 16.2.7.5. Financials (Based on Availability)
- 16.2.1 Novartis AG
List of Figures
- Figure 1: Global Triple-negative Breast Cancer Industry Revenue Breakdown (Million, %) by Region 2024 & 2032
- Figure 2: Global Triple-negative Breast Cancer Industry Volume Breakdown (K Unit, %) by Region 2024 & 2032
- Figure 3: North America Triple-negative Breast Cancer Industry Revenue (Million), by Country 2024 & 2032
- Figure 4: North America Triple-negative Breast Cancer Industry Volume (K Unit), by Country 2024 & 2032
- Figure 5: North America Triple-negative Breast Cancer Industry Revenue Share (%), by Country 2024 & 2032
- Figure 6: North America Triple-negative Breast Cancer Industry Volume Share (%), by Country 2024 & 2032
- Figure 7: Europe Triple-negative Breast Cancer Industry Revenue (Million), by Country 2024 & 2032
- Figure 8: Europe Triple-negative Breast Cancer Industry Volume (K Unit), by Country 2024 & 2032
- Figure 9: Europe Triple-negative Breast Cancer Industry Revenue Share (%), by Country 2024 & 2032
- Figure 10: Europe Triple-negative Breast Cancer Industry Volume Share (%), by Country 2024 & 2032
- Figure 11: Asia Pacific Triple-negative Breast Cancer Industry Revenue (Million), by Country 2024 & 2032
- Figure 12: Asia Pacific Triple-negative Breast Cancer Industry Volume (K Unit), by Country 2024 & 2032
- Figure 13: Asia Pacific Triple-negative Breast Cancer Industry Revenue Share (%), by Country 2024 & 2032
- Figure 14: Asia Pacific Triple-negative Breast Cancer Industry Volume Share (%), by Country 2024 & 2032
- Figure 15: Middle East and Africa Triple-negative Breast Cancer Industry Revenue (Million), by Country 2024 & 2032
- Figure 16: Middle East and Africa Triple-negative Breast Cancer Industry Volume (K Unit), by Country 2024 & 2032
- Figure 17: Middle East and Africa Triple-negative Breast Cancer Industry Revenue Share (%), by Country 2024 & 2032
- Figure 18: Middle East and Africa Triple-negative Breast Cancer Industry Volume Share (%), by Country 2024 & 2032
- Figure 19: South America Triple-negative Breast Cancer Industry Revenue (Million), by Country 2024 & 2032
- Figure 20: South America Triple-negative Breast Cancer Industry Volume (K Unit), by Country 2024 & 2032
- Figure 21: South America Triple-negative Breast Cancer Industry Revenue Share (%), by Country 2024 & 2032
- Figure 22: South America Triple-negative Breast Cancer Industry Volume Share (%), by Country 2024 & 2032
- Figure 23: North America Triple-negative Breast Cancer Industry Revenue (Million), by Type of Treatment 2024 & 2032
- Figure 24: North America Triple-negative Breast Cancer Industry Volume (K Unit), by Type of Treatment 2024 & 2032
- Figure 25: North America Triple-negative Breast Cancer Industry Revenue Share (%), by Type of Treatment 2024 & 2032
- Figure 26: North America Triple-negative Breast Cancer Industry Volume Share (%), by Type of Treatment 2024 & 2032
- Figure 27: North America Triple-negative Breast Cancer Industry Revenue (Million), by Country 2024 & 2032
- Figure 28: North America Triple-negative Breast Cancer Industry Volume (K Unit), by Country 2024 & 2032
- Figure 29: North America Triple-negative Breast Cancer Industry Revenue Share (%), by Country 2024 & 2032
- Figure 30: North America Triple-negative Breast Cancer Industry Volume Share (%), by Country 2024 & 2032
- Figure 31: Europe Triple-negative Breast Cancer Industry Revenue (Million), by Type of Treatment 2024 & 2032
- Figure 32: Europe Triple-negative Breast Cancer Industry Volume (K Unit), by Type of Treatment 2024 & 2032
- Figure 33: Europe Triple-negative Breast Cancer Industry Revenue Share (%), by Type of Treatment 2024 & 2032
- Figure 34: Europe Triple-negative Breast Cancer Industry Volume Share (%), by Type of Treatment 2024 & 2032
- Figure 35: Europe Triple-negative Breast Cancer Industry Revenue (Million), by Country 2024 & 2032
- Figure 36: Europe Triple-negative Breast Cancer Industry Volume (K Unit), by Country 2024 & 2032
- Figure 37: Europe Triple-negative Breast Cancer Industry Revenue Share (%), by Country 2024 & 2032
- Figure 38: Europe Triple-negative Breast Cancer Industry Volume Share (%), by Country 2024 & 2032
- Figure 39: Asia Pacific Triple-negative Breast Cancer Industry Revenue (Million), by Type of Treatment 2024 & 2032
- Figure 40: Asia Pacific Triple-negative Breast Cancer Industry Volume (K Unit), by Type of Treatment 2024 & 2032
- Figure 41: Asia Pacific Triple-negative Breast Cancer Industry Revenue Share (%), by Type of Treatment 2024 & 2032
- Figure 42: Asia Pacific Triple-negative Breast Cancer Industry Volume Share (%), by Type of Treatment 2024 & 2032
- Figure 43: Asia Pacific Triple-negative Breast Cancer Industry Revenue (Million), by Country 2024 & 2032
- Figure 44: Asia Pacific Triple-negative Breast Cancer Industry Volume (K Unit), by Country 2024 & 2032
- Figure 45: Asia Pacific Triple-negative Breast Cancer Industry Revenue Share (%), by Country 2024 & 2032
- Figure 46: Asia Pacific Triple-negative Breast Cancer Industry Volume Share (%), by Country 2024 & 2032
- Figure 47: Middle East and Africa Triple-negative Breast Cancer Industry Revenue (Million), by Type of Treatment 2024 & 2032
- Figure 48: Middle East and Africa Triple-negative Breast Cancer Industry Volume (K Unit), by Type of Treatment 2024 & 2032
- Figure 49: Middle East and Africa Triple-negative Breast Cancer Industry Revenue Share (%), by Type of Treatment 2024 & 2032
- Figure 50: Middle East and Africa Triple-negative Breast Cancer Industry Volume Share (%), by Type of Treatment 2024 & 2032
- Figure 51: Middle East and Africa Triple-negative Breast Cancer Industry Revenue (Million), by Country 2024 & 2032
- Figure 52: Middle East and Africa Triple-negative Breast Cancer Industry Volume (K Unit), by Country 2024 & 2032
- Figure 53: Middle East and Africa Triple-negative Breast Cancer Industry Revenue Share (%), by Country 2024 & 2032
- Figure 54: Middle East and Africa Triple-negative Breast Cancer Industry Volume Share (%), by Country 2024 & 2032
- Figure 55: South America Triple-negative Breast Cancer Industry Revenue (Million), by Type of Treatment 2024 & 2032
- Figure 56: South America Triple-negative Breast Cancer Industry Volume (K Unit), by Type of Treatment 2024 & 2032
- Figure 57: South America Triple-negative Breast Cancer Industry Revenue Share (%), by Type of Treatment 2024 & 2032
- Figure 58: South America Triple-negative Breast Cancer Industry Volume Share (%), by Type of Treatment 2024 & 2032
- Figure 59: South America Triple-negative Breast Cancer Industry Revenue (Million), by Country 2024 & 2032
- Figure 60: South America Triple-negative Breast Cancer Industry Volume (K Unit), by Country 2024 & 2032
- Figure 61: South America Triple-negative Breast Cancer Industry Revenue Share (%), by Country 2024 & 2032
- Figure 62: South America Triple-negative Breast Cancer Industry Volume Share (%), by Country 2024 & 2032
List of Tables
- Table 1: Global Triple-negative Breast Cancer Industry Revenue Million Forecast, by Region 2019 & 2032
- Table 2: Global Triple-negative Breast Cancer Industry Volume K Unit Forecast, by Region 2019 & 2032
- Table 3: Global Triple-negative Breast Cancer Industry Revenue Million Forecast, by Type of Treatment 2019 & 2032
- Table 4: Global Triple-negative Breast Cancer Industry Volume K Unit Forecast, by Type of Treatment 2019 & 2032
- Table 5: Global Triple-negative Breast Cancer Industry Revenue Million Forecast, by Region 2019 & 2032
- Table 6: Global Triple-negative Breast Cancer Industry Volume K Unit Forecast, by Region 2019 & 2032
- Table 7: Global Triple-negative Breast Cancer Industry Revenue Million Forecast, by Country 2019 & 2032
- Table 8: Global Triple-negative Breast Cancer Industry Volume K Unit Forecast, by Country 2019 & 2032
- Table 9: Global Triple-negative Breast Cancer Industry Revenue Million Forecast, by Country 2019 & 2032
- Table 10: Global Triple-negative Breast Cancer Industry Volume K Unit Forecast, by Country 2019 & 2032
- Table 11: Global Triple-negative Breast Cancer Industry Revenue Million Forecast, by Country 2019 & 2032
- Table 12: Global Triple-negative Breast Cancer Industry Volume K Unit Forecast, by Country 2019 & 2032
- Table 13: Global Triple-negative Breast Cancer Industry Revenue Million Forecast, by Country 2019 & 2032
- Table 14: Global Triple-negative Breast Cancer Industry Volume K Unit Forecast, by Country 2019 & 2032
- Table 15: Global Triple-negative Breast Cancer Industry Revenue Million Forecast, by Country 2019 & 2032
- Table 16: Global Triple-negative Breast Cancer Industry Volume K Unit Forecast, by Country 2019 & 2032
- Table 17: Global Triple-negative Breast Cancer Industry Revenue Million Forecast, by Type of Treatment 2019 & 2032
- Table 18: Global Triple-negative Breast Cancer Industry Volume K Unit Forecast, by Type of Treatment 2019 & 2032
- Table 19: Global Triple-negative Breast Cancer Industry Revenue Million Forecast, by Country 2019 & 2032
- Table 20: Global Triple-negative Breast Cancer Industry Volume K Unit Forecast, by Country 2019 & 2032
- Table 21: United States Triple-negative Breast Cancer Industry Revenue (Million) Forecast, by Application 2019 & 2032
- Table 22: United States Triple-negative Breast Cancer Industry Volume (K Unit) Forecast, by Application 2019 & 2032
- Table 23: Canada Triple-negative Breast Cancer Industry Revenue (Million) Forecast, by Application 2019 & 2032
- Table 24: Canada Triple-negative Breast Cancer Industry Volume (K Unit) Forecast, by Application 2019 & 2032
- Table 25: Mexico Triple-negative Breast Cancer Industry Revenue (Million) Forecast, by Application 2019 & 2032
- Table 26: Mexico Triple-negative Breast Cancer Industry Volume (K Unit) Forecast, by Application 2019 & 2032
- Table 27: Global Triple-negative Breast Cancer Industry Revenue Million Forecast, by Type of Treatment 2019 & 2032
- Table 28: Global Triple-negative Breast Cancer Industry Volume K Unit Forecast, by Type of Treatment 2019 & 2032
- Table 29: Global Triple-negative Breast Cancer Industry Revenue Million Forecast, by Country 2019 & 2032
- Table 30: Global Triple-negative Breast Cancer Industry Volume K Unit Forecast, by Country 2019 & 2032
- Table 31: Germany Triple-negative Breast Cancer Industry Revenue (Million) Forecast, by Application 2019 & 2032
- Table 32: Germany Triple-negative Breast Cancer Industry Volume (K Unit) Forecast, by Application 2019 & 2032
- Table 33: United Kingdom Triple-negative Breast Cancer Industry Revenue (Million) Forecast, by Application 2019 & 2032
- Table 34: United Kingdom Triple-negative Breast Cancer Industry Volume (K Unit) Forecast, by Application 2019 & 2032
- Table 35: France Triple-negative Breast Cancer Industry Revenue (Million) Forecast, by Application 2019 & 2032
- Table 36: France Triple-negative Breast Cancer Industry Volume (K Unit) Forecast, by Application 2019 & 2032
- Table 37: Italy Triple-negative Breast Cancer Industry Revenue (Million) Forecast, by Application 2019 & 2032
- Table 38: Italy Triple-negative Breast Cancer Industry Volume (K Unit) Forecast, by Application 2019 & 2032
- Table 39: Spain Triple-negative Breast Cancer Industry Revenue (Million) Forecast, by Application 2019 & 2032
- Table 40: Spain Triple-negative Breast Cancer Industry Volume (K Unit) Forecast, by Application 2019 & 2032
- Table 41: Rest of Europe Triple-negative Breast Cancer Industry Revenue (Million) Forecast, by Application 2019 & 2032
- Table 42: Rest of Europe Triple-negative Breast Cancer Industry Volume (K Unit) Forecast, by Application 2019 & 2032
- Table 43: Global Triple-negative Breast Cancer Industry Revenue Million Forecast, by Type of Treatment 2019 & 2032
- Table 44: Global Triple-negative Breast Cancer Industry Volume K Unit Forecast, by Type of Treatment 2019 & 2032
- Table 45: Global Triple-negative Breast Cancer Industry Revenue Million Forecast, by Country 2019 & 2032
- Table 46: Global Triple-negative Breast Cancer Industry Volume K Unit Forecast, by Country 2019 & 2032
- Table 47: China Triple-negative Breast Cancer Industry Revenue (Million) Forecast, by Application 2019 & 2032
- Table 48: China Triple-negative Breast Cancer Industry Volume (K Unit) Forecast, by Application 2019 & 2032
- Table 49: Japan Triple-negative Breast Cancer Industry Revenue (Million) Forecast, by Application 2019 & 2032
- Table 50: Japan Triple-negative Breast Cancer Industry Volume (K Unit) Forecast, by Application 2019 & 2032
- Table 51: India Triple-negative Breast Cancer Industry Revenue (Million) Forecast, by Application 2019 & 2032
- Table 52: India Triple-negative Breast Cancer Industry Volume (K Unit) Forecast, by Application 2019 & 2032
- Table 53: Australia Triple-negative Breast Cancer Industry Revenue (Million) Forecast, by Application 2019 & 2032
- Table 54: Australia Triple-negative Breast Cancer Industry Volume (K Unit) Forecast, by Application 2019 & 2032
- Table 55: South Korea Triple-negative Breast Cancer Industry Revenue (Million) Forecast, by Application 2019 & 2032
- Table 56: South Korea Triple-negative Breast Cancer Industry Volume (K Unit) Forecast, by Application 2019 & 2032
- Table 57: Rest of Asia Pacific Triple-negative Breast Cancer Industry Revenue (Million) Forecast, by Application 2019 & 2032
- Table 58: Rest of Asia Pacific Triple-negative Breast Cancer Industry Volume (K Unit) Forecast, by Application 2019 & 2032
- Table 59: Global Triple-negative Breast Cancer Industry Revenue Million Forecast, by Type of Treatment 2019 & 2032
- Table 60: Global Triple-negative Breast Cancer Industry Volume K Unit Forecast, by Type of Treatment 2019 & 2032
- Table 61: Global Triple-negative Breast Cancer Industry Revenue Million Forecast, by Country 2019 & 2032
- Table 62: Global Triple-negative Breast Cancer Industry Volume K Unit Forecast, by Country 2019 & 2032
- Table 63: GCC Triple-negative Breast Cancer Industry Revenue (Million) Forecast, by Application 2019 & 2032
- Table 64: GCC Triple-negative Breast Cancer Industry Volume (K Unit) Forecast, by Application 2019 & 2032
- Table 65: South Africa Triple-negative Breast Cancer Industry Revenue (Million) Forecast, by Application 2019 & 2032
- Table 66: South Africa Triple-negative Breast Cancer Industry Volume (K Unit) Forecast, by Application 2019 & 2032
- Table 67: Rest of Middle East and Africa Triple-negative Breast Cancer Industry Revenue (Million) Forecast, by Application 2019 & 2032
- Table 68: Rest of Middle East and Africa Triple-negative Breast Cancer Industry Volume (K Unit) Forecast, by Application 2019 & 2032
- Table 69: Global Triple-negative Breast Cancer Industry Revenue Million Forecast, by Type of Treatment 2019 & 2032
- Table 70: Global Triple-negative Breast Cancer Industry Volume K Unit Forecast, by Type of Treatment 2019 & 2032
- Table 71: Global Triple-negative Breast Cancer Industry Revenue Million Forecast, by Country 2019 & 2032
- Table 72: Global Triple-negative Breast Cancer Industry Volume K Unit Forecast, by Country 2019 & 2032
- Table 73: Brazil Triple-negative Breast Cancer Industry Revenue (Million) Forecast, by Application 2019 & 2032
- Table 74: Brazil Triple-negative Breast Cancer Industry Volume (K Unit) Forecast, by Application 2019 & 2032
- Table 75: Argentina Triple-negative Breast Cancer Industry Revenue (Million) Forecast, by Application 2019 & 2032
- Table 76: Argentina Triple-negative Breast Cancer Industry Volume (K Unit) Forecast, by Application 2019 & 2032
- Table 77: Rest of South America Triple-negative Breast Cancer Industry Revenue (Million) Forecast, by Application 2019 & 2032
- Table 78: Rest of South America Triple-negative Breast Cancer Industry Volume (K Unit) Forecast, by Application 2019 & 2032
Frequently Asked Questions
1. What is the projected Compound Annual Growth Rate (CAGR) of the Triple-negative Breast Cancer Industry?
The projected CAGR is approximately 9.17%.
2. Which companies are prominent players in the Triple-negative Breast Cancer Industry?
Key companies in the market include Novartis AG, GlasxoSmithKline, Merck & Co Inc, AstraZeneca PLC, Pfizer, Eli Lilly and Company, Bristol Myers Squibb Company (Celgene Corporation).
3. What are the main segments of the Triple-negative Breast Cancer Industry?
The market segments include Type of Treatment.
4. Can you provide details about the market size?
The market size is estimated to be USD 15.03 Million as of 2022.
5. What are some drivers contributing to market growth?
Growing Burden of Breast Cancers; Medical Advancements by Breast Cancers Treatment.
6. What are the notable trends driving market growth?
Chemotherapy Is Identified as the Most Lucrative Segment of HER-2 Negative Breast Cancer Market.
7. Are there any restraints impacting market growth?
Lack of Skilled Professional for Operating using Intracranial Stents; Cerebrovascular Complications Related to Intracranial Stenting.
8. Can you provide examples of recent developments in the market?
In September 2022, Novartis announced results from a new pooled exploratory analysis across the entire MONALEESA Phase III program, confirming nearly one year of additional overall survival (OS) benefit in a subgroup of patients with aggressive forms of hormone receptor-positive, human epidermal growth factor receptor-2 negative (HR+/HER2-) advanced breast cancer (aBC).
9. What pricing options are available for accessing the report?
Pricing options include single-user, multi-user, and enterprise licenses priced at USD 4750, USD 5250, and USD 8750 respectively.
10. Is the market size provided in terms of value or volume?
The market size is provided in terms of value, measured in Million and volume, measured in K Unit.
11. Are there any specific market keywords associated with the report?
Yes, the market keyword associated with the report is "Triple-negative Breast Cancer Industry," which aids in identifying and referencing the specific market segment covered.
12. How do I determine which pricing option suits my needs best?
The pricing options vary based on user requirements and access needs. Individual users may opt for single-user licenses, while businesses requiring broader access may choose multi-user or enterprise licenses for cost-effective access to the report.
13. Are there any additional resources or data provided in the Triple-negative Breast Cancer Industry report?
While the report offers comprehensive insights, it's advisable to review the specific contents or supplementary materials provided to ascertain if additional resources or data are available.
14. How can I stay updated on further developments or reports in the Triple-negative Breast Cancer Industry?
To stay informed about further developments, trends, and reports in the Triple-negative Breast Cancer Industry, consider subscribing to industry newsletters, following relevant companies and organizations, or regularly checking reputable industry news sources and publications.
Methodology
Step 1 - Identification of Relevant Samples Size from Population Database


Step 2 - Approaches for Defining Global Market Size (Value, Volume* & Price*)

Note*: In applicable scenarios
Step 3 - Data Sources
Primary Research
- Web Analytics
- Survey Reports
- Research Institute
- Latest Research Reports
- Opinion Leaders
Secondary Research
- Annual Reports
- White Paper
- Latest Press Release
- Industry Association
- Paid Database
- Investor Presentations

Step 4 - Data Triangulation
Involves using different sources of information in order to increase the validity of a study
These sources are likely to be stakeholders in a program - participants, other researchers, program staff, other community members, and so on.
Then we put all data in single framework & apply various statistical tools to find out the dynamic on the market.
During the analysis stage, feedback from the stakeholder groups would be compared to determine areas of agreement as well as areas of divergence
