

Key Insights
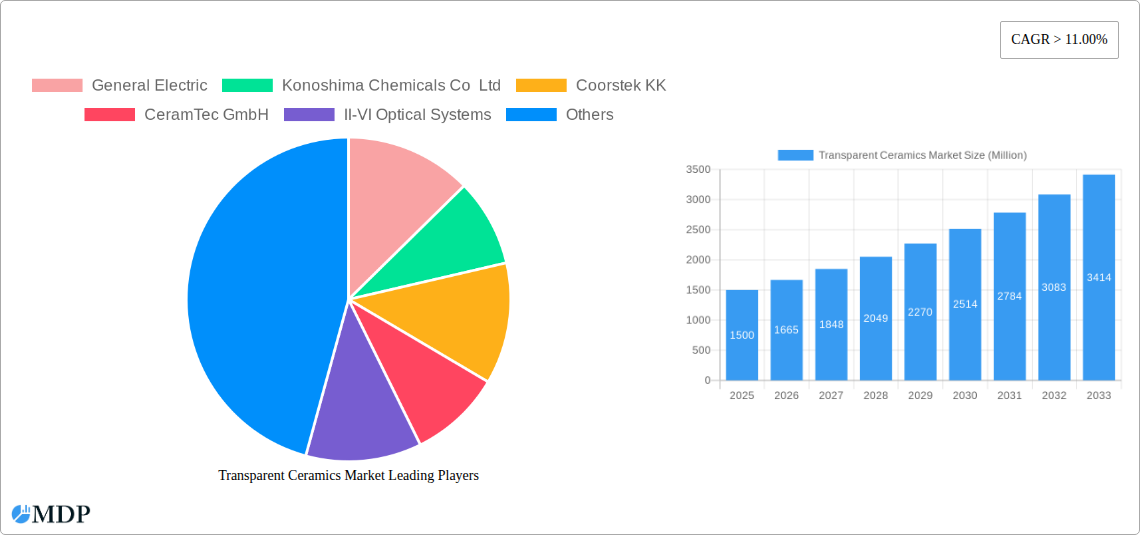
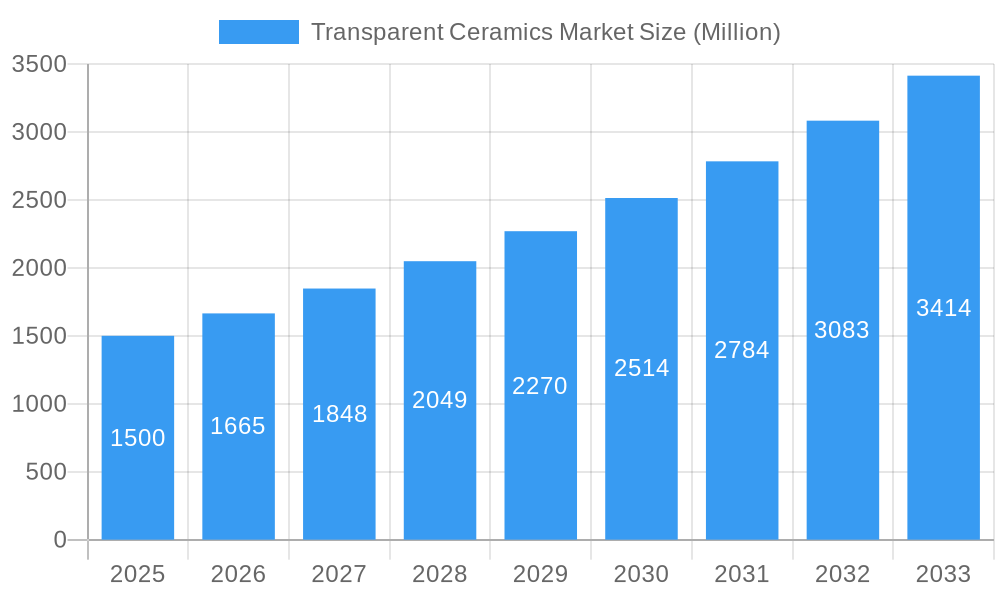
The transparent ceramics market is experiencing robust growth, projected to maintain a Compound Annual Growth Rate (CAGR) exceeding 11% from 2025 to 2033. This expansion is driven by increasing demand across diverse sectors, notably aerospace and defense, where lightweight, high-strength materials are crucial for advanced applications like aircraft windows and laser optics. The healthcare industry also contributes significantly, with applications ranging from biocompatible implants to advanced medical imaging equipment leveraging the unique optical properties of transparent ceramics. Furthermore, the growing adoption of transparent ceramics in consumer electronics and energy-efficient lighting solutions is fueling market growth. Key material segments include sapphire, Yttrium Aluminum Garnet (YAG), and others, each catering to specific application needs. While challenges exist in terms of high manufacturing costs and limited availability of certain materials, ongoing research and development efforts are actively addressing these limitations, paving the way for wider adoption and technological advancements.
Transparent Ceramics Market Market Size (In Billion)
The market's geographical distribution shows strong performance across multiple regions. North America, particularly the United States, and Europe, especially Germany, maintain significant market shares driven by established industrial bases and substantial research investments. However, the Asia-Pacific region, led by China and Japan, exhibits high growth potential, fueled by expanding manufacturing sectors and increasing government support for advanced materials research. The competitive landscape is characterized by both established players like General Electric, Saint-Gobain, and Schott AG, along with emerging companies specializing in niche applications. This dynamic combination of established players and innovative entrants is expected to drive both technological innovation and market consolidation in the coming years. The market is segmented by material type (sapphire, YAG, aluminum oxynitride, YSZ, spinel, and others), application (aerospace & defense, mechanical & chemical, healthcare, consumer goods, energy, and others), and structure (crystalline and non-crystalline).
Transparent Ceramics Market Company Market Share
Transparent Ceramics Market: A Comprehensive Report (2019-2033)
This in-depth report provides a comprehensive analysis of the Transparent Ceramics Market, offering invaluable insights for industry stakeholders, investors, and strategic decision-makers. With a detailed examination of market dynamics, leading players, and future trends, this report is your essential guide to navigating this rapidly evolving sector. The study period covers 2019-2033, with a base year of 2025 and a forecast period of 2025-2033. The market size is projected to reach xx Million by 2033, exhibiting a CAGR of xx% during the forecast period.
Transparent Ceramics Market Market Dynamics & Concentration
The Transparent Ceramics Market is characterized by a moderately concentrated landscape, with key players such as General Electric, Konoshima Chemicals Co Ltd, Coorstek KK, and CeramTec GmbH holding significant market share. Market concentration is influenced by factors including technological expertise, established supply chains, and strong brand recognition. Innovation in material science, particularly the development of advanced sapphire and YAG ceramics, is a primary growth driver. Stringent regulatory frameworks concerning material safety and environmental impact play a crucial role in shaping industry practices. The market also witnesses continuous development of substitute materials, posing both challenges and opportunities. End-user trends, especially in the aerospace and defense sector, heavily influence demand. M&A activity has been relatively moderate in recent years, with approximately xx deals recorded between 2019 and 2024, indicating a strategic focus on organic growth and technological advancements. Key players are focusing on expanding their product portfolios through strategic partnerships and collaborations. The market share of the top five players is estimated to be around xx% in 2025.
Transparent Ceramics Market Industry Trends & Analysis
The Transparent Ceramics Market is experiencing robust growth, propelled by the increasing demand across various applications. Technological advancements in material synthesis and processing techniques are significantly impacting market dynamics, leading to the development of high-performance, cost-effective transparent ceramics. Consumer preferences are shifting towards products with enhanced durability, thermal resistance, and optical properties, driving the adoption of transparent ceramics in diverse sectors. The market's competitive dynamics are intense, with companies focusing on product differentiation, innovation, and strategic partnerships to gain a competitive edge. The market is witnessing a gradual shift from traditional crystalline structures towards advanced non-crystalline structures offering improved optical clarity and mechanical strength. The CAGR for the forecast period is projected at xx%, driven by increasing demand from the aerospace and defense sectors. Market penetration in emerging economies is expected to increase significantly, particularly in Asia-Pacific and other developing regions.
Leading Markets & Segments in Transparent Ceramics Market
The Transparent Ceramics Market is dominated by the Aerospace and Defense application segment, driven by the need for high-performance optical components and protective shields. The Sapphire material segment holds the largest market share due to its superior optical properties and resistance to high temperatures. Geographically, North America and Europe currently lead the market, owing to established industrial infrastructure and technological advancements.
Key Drivers for Leading Segments:
- Aerospace & Defense: Demand for high-precision optical components in advanced aircraft and defense systems.
- Sapphire Material: Superior hardness, scratch resistance, and high refractive index make it ideal for various applications.
- North America & Europe: Strong technological base, established manufacturing facilities, and significant R&D investment.
Detailed Dominance Analysis:
North America's dominance stems from the presence of major players, strong R&D investment, and a robust aerospace and defense industry. Europe follows closely, with strong demand in various sectors. The Asia-Pacific region is projected to exhibit the highest growth rate during the forecast period, driven by increasing investments in infrastructure and technological advancements.
Transparent Ceramics Market Product Developments
Recent product developments in the transparent ceramics market focus on enhancing material properties like improved optical transmission, higher strength, and increased resistance to thermal shock. Innovations in manufacturing processes, such as additive manufacturing and advanced sintering techniques, contribute to superior product quality and cost reduction. These advancements are expanding the applications of transparent ceramics into new markets such as consumer electronics and medical devices, creating new market opportunities for existing and new players.
Key Drivers of Transparent Ceramics Market Growth
Several factors are driving the growth of the transparent ceramics market. Technological advancements leading to improved material properties are a key driver. Increased demand from the aerospace and defense, medical, and consumer electronics industries is also boosting growth. Government regulations and initiatives aimed at promoting the adoption of advanced materials further contribute to market expansion. The rising adoption of advanced laser technologies across several industry segments is also increasing demand.
Challenges in the Transparent Ceramics Market Market
The transparent ceramics market faces challenges such as high production costs, limited availability of raw materials, and stringent quality control requirements. Supply chain disruptions and geopolitical instability can impact raw material sourcing. Intense competition among existing and new market players presents another hurdle, requiring continuous innovation and strategic partnerships to maintain competitiveness. These factors can negatively influence the growth prospects of the transparent ceramics industry, potentially leading to production delays and limiting market expansion.
Emerging Opportunities in Transparent Ceramics Market
The market is poised for substantial growth driven by emerging technological breakthroughs, strategic partnerships, and market expansion into new applications. Advanced manufacturing techniques, along with ongoing R&D, are creating opportunities for improved material properties and reduced production costs. Strategic collaborations between material producers, equipment manufacturers, and end-users are accelerating the adoption of transparent ceramics in various sectors. Expansion into new applications like augmented reality/virtual reality devices and advanced optical sensors offers promising avenues for future growth.
Leading Players in the Transparent Ceramics Market Sector
- General Electric
- Konoshima Chemicals Co Ltd
- Coorstek KK
- CeramTec GmbH
- II-VI Optical Systems
- Koninklijke Philips N V
- Surmet Corporation
- Saint-Gobain Group
- Cilas
- www.optocity.com
- CeraNova
- Deisenroth Engineering GmbH
- AGC Inc
- SCHOTT AG
Key Milestones in Transparent Ceramics Market Industry
- 2020: Introduction of a new sapphire crystal growth technology by [Company Name] resulting in improved optical properties.
- 2021: Strategic partnership between [Company Name] and [Company Name] to develop advanced YAG ceramics for laser applications.
- 2022: Launch of a new line of transparent ceramic components for the automotive industry by [Company Name].
- 2023: Acquisition of [Company Name] by [Company Name], expanding the market presence of the latter. (Specific details on acquisitions may need to be updated closer to publishing.)
Strategic Outlook for Transparent Ceramics Market Market
The Transparent Ceramics Market is poised for significant growth, driven by technological advancements, expanding applications, and increased investment in R&D. Strategic partnerships and collaborations will be key to success, allowing companies to leverage expertise and resources. Focus on developing cost-effective and high-performance materials will be critical for capturing market share. Expansion into new and emerging applications, such as wearable technology and advanced medical devices, presents lucrative growth opportunities.
Transparent Ceramics Market Segmentation
-
1. Structure
- 1.1. Crystalline
- 1.2. Non-crystalline
-
2. Material
- 2.1. Sapphire
- 2.2. Yttrium Aluminum Garnet (YAG)
- 2.3. Aluminum Oxynitride
- 2.4. Yttria-stabilized zirconia (YSZ)
- 2.5. Spinel
- 2.6. Other Materials
-
3. Application
- 3.1. Aerospace and Defense
- 3.2. Mechanical and Chemical
- 3.3. Healthcare
- 3.4. Consumer Goods
- 3.5. Energy
- 3.6. Other Applications
Transparent Ceramics Market Segmentation By Geography
-
1. Asia Pacific
- 1.1. China
- 1.2. India
- 1.3. Japan
- 1.4. South Korea
- 1.5. Australia
- 2. Rest of Asia Pacific
-
3. North America
- 3.1. United States
- 3.2. Canada
- 3.3. Mexico
- 3.4. Rest of North America
-
4. Europe
- 4.1. Germany
- 4.2. United Kingdom
- 4.3. Italy
- 4.4. France
- 4.5. Rest of Europe
-
5. South America
- 5.1. Brazil
- 5.2. Argentina
- 5.3. Rest of South America
-
6. Middle East and Africa
- 6.1. Saudi Arabia
- 6.2. South Africa
- 6.3. Rest of Middle East and Africa

Transparent Ceramics Market Regional Market Share
Geographic Coverage of Transparent Ceramics Market
Transparent Ceramics Market REPORT HIGHLIGHTS
| Aspects | Details |
|---|---|
| Study Period | 2020-2034 |
| Base Year | 2025 |
| Estimated Year | 2026 |
| Forecast Period | 2026-2034 |
| Historical Period | 2020-2025 |
| Growth Rate | CAGR of 17.6% from 2020-2034 |
| Segmentation |
|
Table of Contents
- 1. Introduction
- 1.1. Research Scope
- 1.2. Market Segmentation
- 1.3. Research Objective
- 1.4. Definitions and Assumptions
- 2. Executive Summary
- 2.1. Market Snapshot
- 3. Market Dynamics
- 3.1. Market Drivers
- 3.2. Market Restrains
- 3.3. Market Trends
- 3.4. Market Opportunities
- 4. Market Factor Analysis
- 4.1. Porters Five Forces
- 4.1.1. Bargaining Power of Suppliers
- 4.1.2. Bargaining Power of Buyers
- 4.1.3. Threat of New Entrants
- 4.1.4. Threat of Substitutes
- 4.1.5. Competitive Rivalry
- 4.2. PESTEL analysis
- 4.3. BCG Analysis
- 4.3.1. Stars (High Growth, High Market Share)
- 4.3.2. Cash Cows (Low Growth, High Market Share)
- 4.3.3. Question Mark (High Growth, Low Market Share)
- 4.3.4. Dogs (Low Growth, Low Market Share)
- 4.4. Ansoff Matrix Analysis
- 4.5. Supply Chain Analysis
- 4.6. Regulatory Landscape
- 4.7. Current Market Potential and Opportunity Assessment (TAM–SAM–SOM Framework)
- 4.8. MDP Analyst Note
- 4.1. Porters Five Forces
- 5. Market Analysis, Insights and Forecast 2021-2033
- 5.1. Market Analysis, Insights and Forecast - by Structure
- 5.1.1. Crystalline
- 5.1.2. Non-crystalline
- 5.2. Market Analysis, Insights and Forecast - by Material
- 5.2.1. Sapphire
- 5.2.2. Yttrium Aluminum Garnet (YAG)
- 5.2.3. Aluminum Oxynitride
- 5.2.4. Yttria-stabilized zirconia (YSZ)
- 5.2.5. Spinel
- 5.2.6. Other Materials
- 5.3. Market Analysis, Insights and Forecast - by Application
- 5.3.1. Aerospace and Defense
- 5.3.2. Mechanical and Chemical
- 5.3.3. Healthcare
- 5.3.4. Consumer Goods
- 5.3.5. Energy
- 5.3.6. Other Applications
- 5.4. Market Analysis, Insights and Forecast - by Region
- 5.4.1. Asia Pacific
- 5.4.2. Rest of Asia Pacific
- 5.4.3. North America
- 5.4.4. Europe
- 5.4.5. South America
- 5.4.6. Middle East and Africa
- 5.1. Market Analysis, Insights and Forecast - by Structure
- 6. Global Transparent Ceramics Market Analysis, Insights and Forecast, 2021-2033
- 6.1. Market Analysis, Insights and Forecast - by Structure
- 6.1.1. Crystalline
- 6.1.2. Non-crystalline
- 6.2. Market Analysis, Insights and Forecast - by Material
- 6.2.1. Sapphire
- 6.2.2. Yttrium Aluminum Garnet (YAG)
- 6.2.3. Aluminum Oxynitride
- 6.2.4. Yttria-stabilized zirconia (YSZ)
- 6.2.5. Spinel
- 6.2.6. Other Materials
- 6.3. Market Analysis, Insights and Forecast - by Application
- 6.3.1. Aerospace and Defense
- 6.3.2. Mechanical and Chemical
- 6.3.3. Healthcare
- 6.3.4. Consumer Goods
- 6.3.5. Energy
- 6.3.6. Other Applications
- 6.1. Market Analysis, Insights and Forecast - by Structure
- 7. Asia Pacific Transparent Ceramics Market Analysis, Insights and Forecast, 2020-2032
- 7.1. Market Analysis, Insights and Forecast - by Structure
- 7.1.1. Crystalline
- 7.1.2. Non-crystalline
- 7.2. Market Analysis, Insights and Forecast - by Material
- 7.2.1. Sapphire
- 7.2.2. Yttrium Aluminum Garnet (YAG)
- 7.2.3. Aluminum Oxynitride
- 7.2.4. Yttria-stabilized zirconia (YSZ)
- 7.2.5. Spinel
- 7.2.6. Other Materials
- 7.3. Market Analysis, Insights and Forecast - by Application
- 7.3.1. Aerospace and Defense
- 7.3.2. Mechanical and Chemical
- 7.3.3. Healthcare
- 7.3.4. Consumer Goods
- 7.3.5. Energy
- 7.3.6. Other Applications
- 7.1. Market Analysis, Insights and Forecast - by Structure
- 8. Rest of Asia Pacific Transparent Ceramics Market Analysis, Insights and Forecast, 2020-2032
- 8.1. Market Analysis, Insights and Forecast - by Structure
- 8.1.1. Crystalline
- 8.1.2. Non-crystalline
- 8.2. Market Analysis, Insights and Forecast - by Material
- 8.2.1. Sapphire
- 8.2.2. Yttrium Aluminum Garnet (YAG)
- 8.2.3. Aluminum Oxynitride
- 8.2.4. Yttria-stabilized zirconia (YSZ)
- 8.2.5. Spinel
- 8.2.6. Other Materials
- 8.3. Market Analysis, Insights and Forecast - by Application
- 8.3.1. Aerospace and Defense
- 8.3.2. Mechanical and Chemical
- 8.3.3. Healthcare
- 8.3.4. Consumer Goods
- 8.3.5. Energy
- 8.3.6. Other Applications
- 8.1. Market Analysis, Insights and Forecast - by Structure
- 9. North America Transparent Ceramics Market Analysis, Insights and Forecast, 2020-2032
- 9.1. Market Analysis, Insights and Forecast - by Structure
- 9.1.1. Crystalline
- 9.1.2. Non-crystalline
- 9.2. Market Analysis, Insights and Forecast - by Material
- 9.2.1. Sapphire
- 9.2.2. Yttrium Aluminum Garnet (YAG)
- 9.2.3. Aluminum Oxynitride
- 9.2.4. Yttria-stabilized zirconia (YSZ)
- 9.2.5. Spinel
- 9.2.6. Other Materials
- 9.3. Market Analysis, Insights and Forecast - by Application
- 9.3.1. Aerospace and Defense
- 9.3.2. Mechanical and Chemical
- 9.3.3. Healthcare
- 9.3.4. Consumer Goods
- 9.3.5. Energy
- 9.3.6. Other Applications
- 9.1. Market Analysis, Insights and Forecast - by Structure
- 10. Europe Transparent Ceramics Market Analysis, Insights and Forecast, 2020-2032
- 10.1. Market Analysis, Insights and Forecast - by Structure
- 10.1.1. Crystalline
- 10.1.2. Non-crystalline
- 10.2. Market Analysis, Insights and Forecast - by Material
- 10.2.1. Sapphire
- 10.2.2. Yttrium Aluminum Garnet (YAG)
- 10.2.3. Aluminum Oxynitride
- 10.2.4. Yttria-stabilized zirconia (YSZ)
- 10.2.5. Spinel
- 10.2.6. Other Materials
- 10.3. Market Analysis, Insights and Forecast - by Application
- 10.3.1. Aerospace and Defense
- 10.3.2. Mechanical and Chemical
- 10.3.3. Healthcare
- 10.3.4. Consumer Goods
- 10.3.5. Energy
- 10.3.6. Other Applications
- 10.1. Market Analysis, Insights and Forecast - by Structure
- 11. South America Transparent Ceramics Market Analysis, Insights and Forecast, 2020-2032
- 11.1. Market Analysis, Insights and Forecast - by Structure
- 11.1.1. Crystalline
- 11.1.2. Non-crystalline
- 11.2. Market Analysis, Insights and Forecast - by Material
- 11.2.1. Sapphire
- 11.2.2. Yttrium Aluminum Garnet (YAG)
- 11.2.3. Aluminum Oxynitride
- 11.2.4. Yttria-stabilized zirconia (YSZ)
- 11.2.5. Spinel
- 11.2.6. Other Materials
- 11.3. Market Analysis, Insights and Forecast - by Application
- 11.3.1. Aerospace and Defense
- 11.3.2. Mechanical and Chemical
- 11.3.3. Healthcare
- 11.3.4. Consumer Goods
- 11.3.5. Energy
- 11.3.6. Other Applications
- 11.1. Market Analysis, Insights and Forecast - by Structure
- 12. Middle East and Africa Transparent Ceramics Market Analysis, Insights and Forecast, 2020-2032
- 12.1. Market Analysis, Insights and Forecast - by Structure
- 12.1.1. Crystalline
- 12.1.2. Non-crystalline
- 12.2. Market Analysis, Insights and Forecast - by Material
- 12.2.1. Sapphire
- 12.2.2. Yttrium Aluminum Garnet (YAG)
- 12.2.3. Aluminum Oxynitride
- 12.2.4. Yttria-stabilized zirconia (YSZ)
- 12.2.5. Spinel
- 12.2.6. Other Materials
- 12.3. Market Analysis, Insights and Forecast - by Application
- 12.3.1. Aerospace and Defense
- 12.3.2. Mechanical and Chemical
- 12.3.3. Healthcare
- 12.3.4. Consumer Goods
- 12.3.5. Energy
- 12.3.6. Other Applications
- 12.1. Market Analysis, Insights and Forecast - by Structure
- 13. Competitive Analysis
- 13.1. Company Profiles
- 13.1.1 General Electric
- 13.1.1.1. Company Overview
- 13.1.1.2. Products
- 13.1.1.3. Company Financials
- 13.1.1.4. SWOT Analysis
- 13.1.2 Konoshima Chemicals Co Ltd
- 13.1.2.1. Company Overview
- 13.1.2.2. Products
- 13.1.2.3. Company Financials
- 13.1.2.4. SWOT Analysis
- 13.1.3 Coorstek KK
- 13.1.3.1. Company Overview
- 13.1.3.2. Products
- 13.1.3.3. Company Financials
- 13.1.3.4. SWOT Analysis
- 13.1.4 CeramTec GmbH
- 13.1.4.1. Company Overview
- 13.1.4.2. Products
- 13.1.4.3. Company Financials
- 13.1.4.4. SWOT Analysis
- 13.1.5 II-VI Optical Systems
- 13.1.5.1. Company Overview
- 13.1.5.2. Products
- 13.1.5.3. Company Financials
- 13.1.5.4. SWOT Analysis
- 13.1.6 Koninklijke Philips N V
- 13.1.6.1. Company Overview
- 13.1.6.2. Products
- 13.1.6.3. Company Financials
- 13.1.6.4. SWOT Analysis
- 13.1.7 Surmet Corporation*List Not Exhaustive
- 13.1.7.1. Company Overview
- 13.1.7.2. Products
- 13.1.7.3. Company Financials
- 13.1.7.4. SWOT Analysis
- 13.1.8 Saint-Gobain Group
- 13.1.8.1. Company Overview
- 13.1.8.2. Products
- 13.1.8.3. Company Financials
- 13.1.8.4. SWOT Analysis
- 13.1.9 Cilas
- 13.1.9.1. Company Overview
- 13.1.9.2. Products
- 13.1.9.3. Company Financials
- 13.1.9.4. SWOT Analysis
- 13.1.10 www optocity com
- 13.1.10.1. Company Overview
- 13.1.10.2. Products
- 13.1.10.3. Company Financials
- 13.1.10.4. SWOT Analysis
- 13.1.11 CeraNova
- 13.1.11.1. Company Overview
- 13.1.11.2. Products
- 13.1.11.3. Company Financials
- 13.1.11.4. SWOT Analysis
- 13.1.12 Deisenroth Engineering GmbH
- 13.1.12.1. Company Overview
- 13.1.12.2. Products
- 13.1.12.3. Company Financials
- 13.1.12.4. SWOT Analysis
- 13.1.13 AGC Inc
- 13.1.13.1. Company Overview
- 13.1.13.2. Products
- 13.1.13.3. Company Financials
- 13.1.13.4. SWOT Analysis
- 13.1.14 SCHOTT AG
- 13.1.14.1. Company Overview
- 13.1.14.2. Products
- 13.1.14.3. Company Financials
- 13.1.14.4. SWOT Analysis
- 13.1.1 General Electric
- 13.2. Market Entropy
- 13.2.1 Company's Key Areas Served
- 13.2.2 Recent Developments
- 13.3. Company Market Share Analysis 2025
- 13.3.1 Top 5 Companies Market Share Analysis
- 13.3.2 Top 3 Companies Market Share Analysis
- 13.4. List of Potential Customers
- 14. Research Methodology
List of Figures
- Figure 1: Global Transparent Ceramics Market Revenue Breakdown (million, %) by Region 2025 & 2033
- Figure 2: Asia Pacific Transparent Ceramics Market Revenue (million), by Structure 2025 & 2033
- Figure 3: Asia Pacific Transparent Ceramics Market Revenue Share (%), by Structure 2025 & 2033
- Figure 4: Asia Pacific Transparent Ceramics Market Revenue (million), by Material 2025 & 2033
- Figure 5: Asia Pacific Transparent Ceramics Market Revenue Share (%), by Material 2025 & 2033
- Figure 6: Asia Pacific Transparent Ceramics Market Revenue (million), by Application 2025 & 2033
- Figure 7: Asia Pacific Transparent Ceramics Market Revenue Share (%), by Application 2025 & 2033
- Figure 8: Asia Pacific Transparent Ceramics Market Revenue (million), by Country 2025 & 2033
- Figure 9: Asia Pacific Transparent Ceramics Market Revenue Share (%), by Country 2025 & 2033
- Figure 10: Rest of Asia Pacific Transparent Ceramics Market Revenue (million), by Structure 2025 & 2033
- Figure 11: Rest of Asia Pacific Transparent Ceramics Market Revenue Share (%), by Structure 2025 & 2033
- Figure 12: Rest of Asia Pacific Transparent Ceramics Market Revenue (million), by Material 2025 & 2033
- Figure 13: Rest of Asia Pacific Transparent Ceramics Market Revenue Share (%), by Material 2025 & 2033
- Figure 14: Rest of Asia Pacific Transparent Ceramics Market Revenue (million), by Application 2025 & 2033
- Figure 15: Rest of Asia Pacific Transparent Ceramics Market Revenue Share (%), by Application 2025 & 2033
- Figure 16: Rest of Asia Pacific Transparent Ceramics Market Revenue (million), by Country 2025 & 2033
- Figure 17: Rest of Asia Pacific Transparent Ceramics Market Revenue Share (%), by Country 2025 & 2033
- Figure 18: North America Transparent Ceramics Market Revenue (million), by Structure 2025 & 2033
- Figure 19: North America Transparent Ceramics Market Revenue Share (%), by Structure 2025 & 2033
- Figure 20: North America Transparent Ceramics Market Revenue (million), by Material 2025 & 2033
- Figure 21: North America Transparent Ceramics Market Revenue Share (%), by Material 2025 & 2033
- Figure 22: North America Transparent Ceramics Market Revenue (million), by Application 2025 & 2033
- Figure 23: North America Transparent Ceramics Market Revenue Share (%), by Application 2025 & 2033
- Figure 24: North America Transparent Ceramics Market Revenue (million), by Country 2025 & 2033
- Figure 25: North America Transparent Ceramics Market Revenue Share (%), by Country 2025 & 2033
- Figure 26: Europe Transparent Ceramics Market Revenue (million), by Structure 2025 & 2033
- Figure 27: Europe Transparent Ceramics Market Revenue Share (%), by Structure 2025 & 2033
- Figure 28: Europe Transparent Ceramics Market Revenue (million), by Material 2025 & 2033
- Figure 29: Europe Transparent Ceramics Market Revenue Share (%), by Material 2025 & 2033
- Figure 30: Europe Transparent Ceramics Market Revenue (million), by Application 2025 & 2033
- Figure 31: Europe Transparent Ceramics Market Revenue Share (%), by Application 2025 & 2033
- Figure 32: Europe Transparent Ceramics Market Revenue (million), by Country 2025 & 2033
- Figure 33: Europe Transparent Ceramics Market Revenue Share (%), by Country 2025 & 2033
- Figure 34: South America Transparent Ceramics Market Revenue (million), by Structure 2025 & 2033
- Figure 35: South America Transparent Ceramics Market Revenue Share (%), by Structure 2025 & 2033
- Figure 36: South America Transparent Ceramics Market Revenue (million), by Material 2025 & 2033
- Figure 37: South America Transparent Ceramics Market Revenue Share (%), by Material 2025 & 2033
- Figure 38: South America Transparent Ceramics Market Revenue (million), by Application 2025 & 2033
- Figure 39: South America Transparent Ceramics Market Revenue Share (%), by Application 2025 & 2033
- Figure 40: South America Transparent Ceramics Market Revenue (million), by Country 2025 & 2033
- Figure 41: South America Transparent Ceramics Market Revenue Share (%), by Country 2025 & 2033
- Figure 42: Middle East and Africa Transparent Ceramics Market Revenue (million), by Structure 2025 & 2033
- Figure 43: Middle East and Africa Transparent Ceramics Market Revenue Share (%), by Structure 2025 & 2033
- Figure 44: Middle East and Africa Transparent Ceramics Market Revenue (million), by Material 2025 & 2033
- Figure 45: Middle East and Africa Transparent Ceramics Market Revenue Share (%), by Material 2025 & 2033
- Figure 46: Middle East and Africa Transparent Ceramics Market Revenue (million), by Application 2025 & 2033
- Figure 47: Middle East and Africa Transparent Ceramics Market Revenue Share (%), by Application 2025 & 2033
- Figure 48: Middle East and Africa Transparent Ceramics Market Revenue (million), by Country 2025 & 2033
- Figure 49: Middle East and Africa Transparent Ceramics Market Revenue Share (%), by Country 2025 & 2033
List of Tables
- Table 1: Global Transparent Ceramics Market Revenue million Forecast, by Structure 2020 & 2033
- Table 2: Global Transparent Ceramics Market Revenue million Forecast, by Material 2020 & 2033
- Table 3: Global Transparent Ceramics Market Revenue million Forecast, by Application 2020 & 2033
- Table 4: Global Transparent Ceramics Market Revenue million Forecast, by Region 2020 & 2033
- Table 5: Global Transparent Ceramics Market Revenue million Forecast, by Structure 2020 & 2033
- Table 6: Global Transparent Ceramics Market Revenue million Forecast, by Material 2020 & 2033
- Table 7: Global Transparent Ceramics Market Revenue million Forecast, by Application 2020 & 2033
- Table 8: Global Transparent Ceramics Market Revenue million Forecast, by Country 2020 & 2033
- Table 9: China Transparent Ceramics Market Revenue (million) Forecast, by Application 2020 & 2033
- Table 10: India Transparent Ceramics Market Revenue (million) Forecast, by Application 2020 & 2033
- Table 11: Japan Transparent Ceramics Market Revenue (million) Forecast, by Application 2020 & 2033
- Table 12: South Korea Transparent Ceramics Market Revenue (million) Forecast, by Application 2020 & 2033
- Table 13: Australia Transparent Ceramics Market Revenue (million) Forecast, by Application 2020 & 2033
- Table 14: Global Transparent Ceramics Market Revenue million Forecast, by Structure 2020 & 2033
- Table 15: Global Transparent Ceramics Market Revenue million Forecast, by Material 2020 & 2033
- Table 16: Global Transparent Ceramics Market Revenue million Forecast, by Application 2020 & 2033
- Table 17: Global Transparent Ceramics Market Revenue million Forecast, by Country 2020 & 2033
- Table 18: Global Transparent Ceramics Market Revenue million Forecast, by Structure 2020 & 2033
- Table 19: Global Transparent Ceramics Market Revenue million Forecast, by Material 2020 & 2033
- Table 20: Global Transparent Ceramics Market Revenue million Forecast, by Application 2020 & 2033
- Table 21: Global Transparent Ceramics Market Revenue million Forecast, by Country 2020 & 2033
- Table 22: United States Transparent Ceramics Market Revenue (million) Forecast, by Application 2020 & 2033
- Table 23: Canada Transparent Ceramics Market Revenue (million) Forecast, by Application 2020 & 2033
- Table 24: Mexico Transparent Ceramics Market Revenue (million) Forecast, by Application 2020 & 2033
- Table 25: Rest of North America Transparent Ceramics Market Revenue (million) Forecast, by Application 2020 & 2033
- Table 26: Global Transparent Ceramics Market Revenue million Forecast, by Structure 2020 & 2033
- Table 27: Global Transparent Ceramics Market Revenue million Forecast, by Material 2020 & 2033
- Table 28: Global Transparent Ceramics Market Revenue million Forecast, by Application 2020 & 2033
- Table 29: Global Transparent Ceramics Market Revenue million Forecast, by Country 2020 & 2033
- Table 30: Germany Transparent Ceramics Market Revenue (million) Forecast, by Application 2020 & 2033
- Table 31: United Kingdom Transparent Ceramics Market Revenue (million) Forecast, by Application 2020 & 2033
- Table 32: Italy Transparent Ceramics Market Revenue (million) Forecast, by Application 2020 & 2033
- Table 33: France Transparent Ceramics Market Revenue (million) Forecast, by Application 2020 & 2033
- Table 34: Rest of Europe Transparent Ceramics Market Revenue (million) Forecast, by Application 2020 & 2033
- Table 35: Global Transparent Ceramics Market Revenue million Forecast, by Structure 2020 & 2033
- Table 36: Global Transparent Ceramics Market Revenue million Forecast, by Material 2020 & 2033
- Table 37: Global Transparent Ceramics Market Revenue million Forecast, by Application 2020 & 2033
- Table 38: Global Transparent Ceramics Market Revenue million Forecast, by Country 2020 & 2033
- Table 39: Brazil Transparent Ceramics Market Revenue (million) Forecast, by Application 2020 & 2033
- Table 40: Argentina Transparent Ceramics Market Revenue (million) Forecast, by Application 2020 & 2033
- Table 41: Rest of South America Transparent Ceramics Market Revenue (million) Forecast, by Application 2020 & 2033
- Table 42: Global Transparent Ceramics Market Revenue million Forecast, by Structure 2020 & 2033
- Table 43: Global Transparent Ceramics Market Revenue million Forecast, by Material 2020 & 2033
- Table 44: Global Transparent Ceramics Market Revenue million Forecast, by Application 2020 & 2033
- Table 45: Global Transparent Ceramics Market Revenue million Forecast, by Country 2020 & 2033
- Table 46: Saudi Arabia Transparent Ceramics Market Revenue (million) Forecast, by Application 2020 & 2033
- Table 47: South Africa Transparent Ceramics Market Revenue (million) Forecast, by Application 2020 & 2033
- Table 48: Rest of Middle East and Africa Transparent Ceramics Market Revenue (million) Forecast, by Application 2020 & 2033
Frequently Asked Questions
1. What is the projected Compound Annual Growth Rate (CAGR) of the Transparent Ceramics Market?
The projected CAGR is approximately 17.6%.
2. Which companies are prominent players in the Transparent Ceramics Market?
Key companies in the market include General Electric, Konoshima Chemicals Co Ltd, Coorstek KK, CeramTec GmbH, II-VI Optical Systems, Koninklijke Philips N V, Surmet Corporation*List Not Exhaustive, Saint-Gobain Group, Cilas, www optocity com, CeraNova, Deisenroth Engineering GmbH, AGC Inc, SCHOTT AG.
3. What are the main segments of the Transparent Ceramics Market?
The market segments include Structure, Material, Application.
4. Can you provide details about the market size?
The market size is estimated to be USD 782.62 million as of 2022.
5. What are some drivers contributing to market growth?
; Accelerating Usage in Optics and Optoelectronics; Increasing Demand in the Aerospace and Defense Sector; Advanced Ceramics Increasingly Replacing Plastics and Metals.
6. What are the notable trends driving market growth?
Increasing Demand from the Aerospace and Defense Sector.
7. Are there any restraints impacting market growth?
; High Cost; Other Restraints.
8. Can you provide examples of recent developments in the market?
N/A
9. What pricing options are available for accessing the report?
Pricing options include single-user, multi-user, and enterprise licenses priced at USD 4750, USD 5250, and USD 8750 respectively.
10. Is the market size provided in terms of value or volume?
The market size is provided in terms of value, measured in million.
11. Are there any specific market keywords associated with the report?
Yes, the market keyword associated with the report is "Transparent Ceramics Market," which aids in identifying and referencing the specific market segment covered.
12. How do I determine which pricing option suits my needs best?
The pricing options vary based on user requirements and access needs. Individual users may opt for single-user licenses, while businesses requiring broader access may choose multi-user or enterprise licenses for cost-effective access to the report.
13. Are there any additional resources or data provided in the Transparent Ceramics Market report?
While the report offers comprehensive insights, it's advisable to review the specific contents or supplementary materials provided to ascertain if additional resources or data are available.
14. How can I stay updated on further developments or reports in the Transparent Ceramics Market?
To stay informed about further developments, trends, and reports in the Transparent Ceramics Market, consider subscribing to industry newsletters, following relevant companies and organizations, or regularly checking reputable industry news sources and publications.
Methodology
Step 1 - Identification of Relevant Samples Size from Population Database


Step 2 - Approaches for Defining Global Market Size (Value, Volume* & Price*)

Note*: In applicable scenarios
Step 3 - Data Sources
Primary Research
- Web Analytics
- Survey Reports
- Research Institute
- Latest Research Reports
- Opinion Leaders
Secondary Research
- Annual Reports
- White Paper
- Latest Press Release
- Industry Association
- Paid Database
- Investor Presentations

Step 4 - Data Triangulation
Involves using different sources of information in order to increase the validity of a study
These sources are likely to be stakeholders in a program - participants, other researchers, program staff, other community members, and so on.
Then we put all data in single framework & apply various statistical tools to find out the dynamic on the market.
During the analysis stage, feedback from the stakeholder groups would be compared to determine areas of agreement as well as areas of divergence