

Key Insights
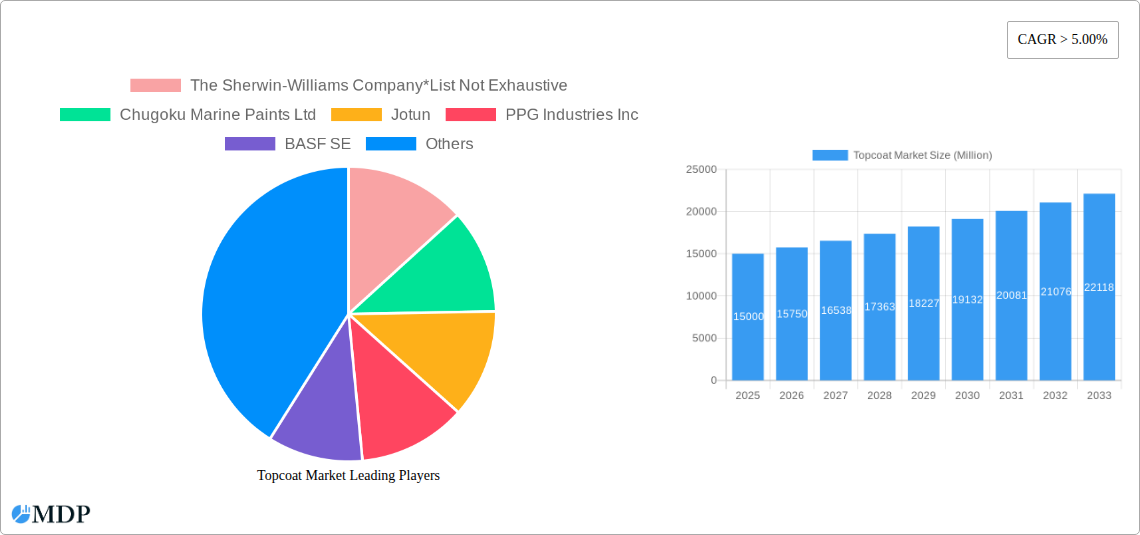
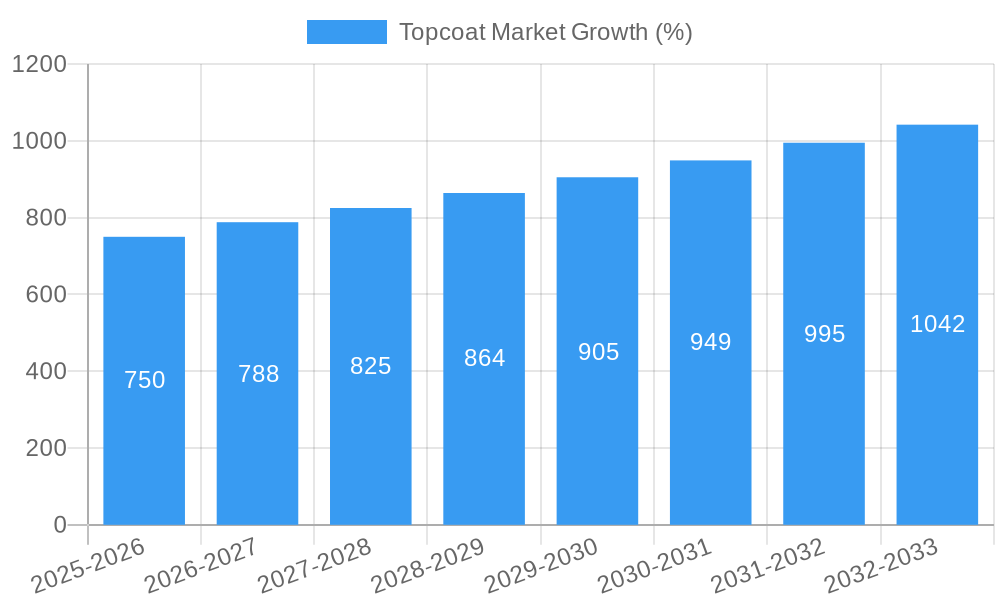
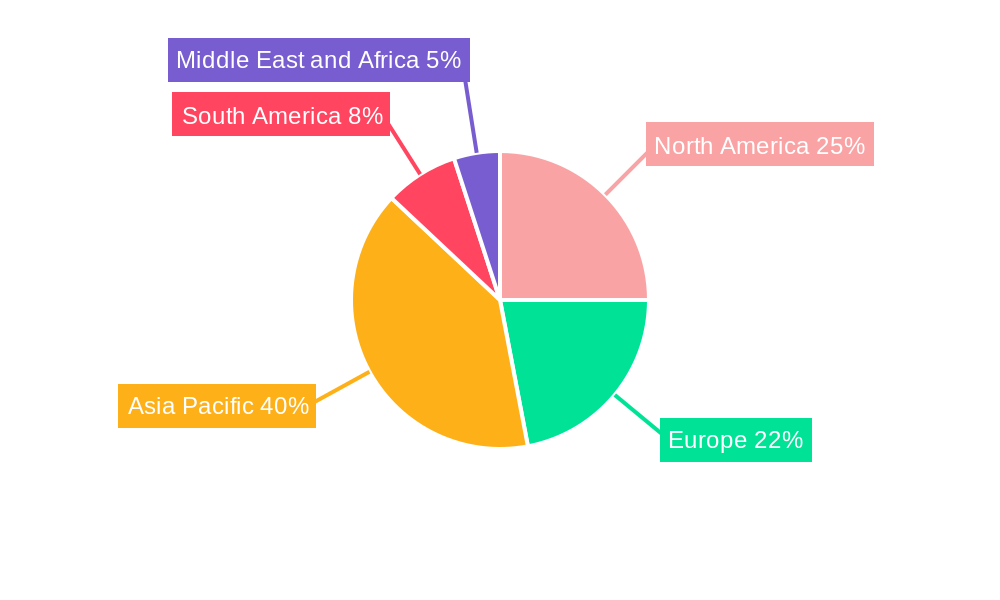
The global topcoat market is experiencing robust growth, projected to maintain a Compound Annual Growth Rate (CAGR) exceeding 5% from 2025 to 2033. This expansion is fueled by several key factors. The automotive industry's increasing demand for durable and aesthetically pleasing finishes is a major driver, particularly in the Asia-Pacific region, which is expected to be the largest market due to significant automotive production and expanding infrastructure projects. The aerospace and marine sectors also contribute significantly, demanding specialized topcoats with exceptional corrosion resistance and longevity. Growth is further propelled by advancements in resin technology, with polyurethane and acrylic topcoats dominating the market due to their versatility and performance characteristics. However, environmental regulations regarding volatile organic compounds (VOCs) and rising raw material costs pose significant challenges. The market is segmented by resin type (polyurethane, acrylic, epoxy, and others) and end-user industry (automotive, aerospace, marine, and others). Major players like Sherwin-Williams, Jotun, PPG Industries, BASF, and Akzo Nobel are actively engaged in innovation and strategic partnerships to maintain market share and capture emerging opportunities. This includes developing sustainable and high-performance topcoats catering to the specific needs of diverse industries.
The competitive landscape is characterized by both established multinational corporations and regional players. While the established players benefit from extensive distribution networks and brand recognition, regional players are focusing on offering specialized solutions and catering to niche market segments. The forecast period will likely witness increased mergers and acquisitions as companies strive for consolidation and expansion in emerging markets. The development and adoption of sustainable topcoat solutions that meet stringent environmental regulations will be crucial for future market success. Regional growth will vary, with Asia-Pacific expected to lead, followed by North America and Europe. However, developing regions in South America and the Middle East & Africa are showing promising growth potential driven by increased infrastructure investment and industrialization. The continued innovation in resin technology and the development of high-performance, eco-friendly coatings will be vital for the continued growth trajectory of the topcoat market.
This comprehensive report provides an in-depth analysis of the global Topcoat Market, offering invaluable insights for industry stakeholders, investors, and strategic decision-makers. Spanning the period from 2019 to 2033 (Study Period), with a base year of 2025 and forecast period of 2025-2033, this report meticulously examines market dynamics, leading players, technological advancements, and future growth prospects. The report's detailed segmentation covers various resin types (Polyurethane, Acrylic, Epoxy, Other Resin Types) and end-user industries (Automotive, Aerospace, Marine, Other End-user Industries), providing a granular understanding of this dynamic market. Expected market value data in Millions is included throughout.
Topcoat Market Market Dynamics & Concentration
The global Topcoat market exhibits a moderately consolidated structure, with key players like The Sherwin-Williams Company, Chugoku Marine Paints Ltd, Jotun, PPG Industries Inc, BASF SE, Hempel A/S, Akzo Nobel N V, NIPPON PAINT, and Kansai Paint Co Ltd holding significant market share. The market share of these companies is estimated to be approximately xx% in 2025. Market concentration is influenced by factors including economies of scale, brand recognition, and technological innovation.
- Innovation Drivers: Continuous R&D efforts drive the introduction of high-performance topcoats with improved durability, aesthetics, and sustainability features. This includes advancements in UV resistance, scratch resistance, and eco-friendly formulations.
- Regulatory Frameworks: Stringent environmental regulations regarding VOC emissions and hazardous substances are shaping product development and influencing market growth. Compliance costs impact smaller players more significantly.
- Product Substitutes: The existence of substitute materials, such as powder coatings in certain applications, presents a competitive challenge to traditional topcoats. However, the performance advantages of topcoats in specific applications ensure their continued relevance.
- End-User Trends: Increasing demand for aesthetically pleasing and durable finishes across various end-user sectors, coupled with rising disposable incomes in developing economies, fuel market growth.
- M&A Activities: The Topcoat market has witnessed a moderate level of mergers and acquisitions in recent years (xx deals between 2019-2024). These activities aim to expand market reach, enhance product portfolios, and secure access to new technologies. The average deal size was approximately xx Million.
Topcoat Market Industry Trends & Analysis
The Topcoat market is experiencing robust growth, driven by a CAGR of xx% during the forecast period (2025-2033). This growth is attributable to several factors. The automotive industry, a key end-user segment, is a major contributor, with increasing vehicle production and a rising demand for high-quality finishes. Technological advancements, such as the development of water-based and UV-curable topcoats, are improving product performance and environmental sustainability. Consumer preferences are shifting towards durable, aesthetically pleasing, and eco-friendly coatings, further bolstering market growth. Market penetration of water-based topcoats is estimated to be around xx% in 2025 and projected to reach xx% by 2033. Competitive dynamics are marked by innovation, brand differentiation, and strategic partnerships.
Leading Markets & Segments in Topcoat Market
The automotive sector dominates the end-user industry segment, accounting for approximately xx% of the total market value in 2025. Among resin types, Polyurethane topcoats hold the largest market share, driven by their superior durability and aesthetic appeal. The Asia-Pacific region is projected to be the leading market, driven by robust automotive production and infrastructure development.
Key Drivers in Asia-Pacific:
- Rapid industrialization and urbanization.
- Expanding automotive and construction sectors.
- Favorable government policies supporting infrastructure development.
Dominance Analysis: The Asia-Pacific region's dominance stems from its large and rapidly growing automotive and construction sectors, creating significant demand for topcoats. The region's burgeoning middle class and increasing disposable incomes further contribute to this growth.
Topcoat Market Product Developments
Recent product innovations focus on enhancing performance characteristics, such as improved scratch and UV resistance, while simultaneously reducing environmental impact. The development of water-based and UV-curable topcoats reflects this trend. These advancements cater to the increasing demand for sustainable and high-performance coatings, giving manufacturers a competitive edge in the market.
Key Drivers of Topcoat Market Growth
Several factors are driving growth in the Topcoat market. These include:
- Technological advancements: Development of high-performance, sustainable coatings.
- Economic growth: Rising disposable incomes and increased construction activity in developing economies.
- Stringent environmental regulations: Driving demand for eco-friendly coatings.
Challenges in the Topcoat Market Market
The Topcoat market faces several challenges:
- Fluctuating raw material prices: Affecting production costs and profitability.
- Stringent environmental regulations: Increasing compliance costs.
- Intense competition: From both established players and new entrants.
Emerging Opportunities in Topcoat Market
Significant opportunities exist for growth in the Topcoat market. These include:
- Expansion into emerging markets: Untapped potential in developing economies.
- Strategic partnerships: Collaborations to develop innovative products and expand market reach.
- Technological breakthroughs: Advancements in nanotechnology and bio-based coatings.
Leading Players in the Topcoat Market Sector
- The Sherwin-Williams Company
- Chugoku Marine Paints Ltd
- Jotun
- PPG Industries Inc
- BASF SE
- Hempel A/S
- Akzo Nobel N V
- NIPPON PAINT
- Kansai Paint Co Ltd
Key Milestones in Topcoat Market Industry
- 2020: Introduction of a new water-based topcoat with improved UV resistance by PPG Industries Inc.
- 2022: Merger between two smaller topcoat manufacturers in Europe. (Specific companies not available for this example)
- 2023: Launch of a bio-based topcoat by BASF SE, focusing on sustainability.
- 2024: Increased regulatory scrutiny on VOC emissions leads to reformulations across the industry.
Strategic Outlook for Topcoat Market Market
The Topcoat market is poised for continued growth, driven by technological innovation, expansion into new markets, and increasing demand for high-performance and sustainable coatings. Strategic partnerships and investments in R&D will be crucial for success in this competitive landscape. Companies focusing on eco-friendly solutions and catering to the increasing demand for customization are expected to gain a competitive advantage.
Topcoat Market Segmentation
-
1. Resin Type
- 1.1. Polyurethane
- 1.2. Acrylic
- 1.3. Epoxy
- 1.4. Other Resin Types
-
2. End-user Industry
- 2.1. Automotive
- 2.2. Aerospace
- 2.3. Marine
- 2.4. Other End-user Industries
Topcoat Market Segmentation By Geography
-
1. Asia Pacific
- 1.1. China
- 1.2. India
- 1.3. Japan
- 1.4. South Korea
- 1.5. Rest of Asia Pacific
-
2. North America
- 2.1. United States
- 2.2. Canada
- 2.3. Mexico
-
3. Europe
- 3.1. United Kingdom
- 3.2. France
- 3.3. Germany
- 3.4. Italy
- 3.5. Rest of Europe
-
4. South America
- 4.1. Brazil
- 4.2. Argentina
- 4.3. Rest of South America
-
5. Middle East and Africa
- 5.1. South Africa
- 5.2. Saudi Arabia
- 5.3. Rest of Middle East and Africa
Topcoat Market REPORT HIGHLIGHTS
| Aspects | Details |
|---|---|
| Study Period | 2019-2033 |
| Base Year | 2024 |
| Estimated Year | 2025 |
| Forecast Period | 2025-2033 |
| Historical Period | 2019-2024 |
| Growth Rate | CAGR of > 5.00% from 2019-2033 |
| Segmentation |
|
Table of Contents
- 1. Introduction
- 1.1. Research Scope
- 1.2. Market Segmentation
- 1.3. Research Methodology
- 1.4. Definitions and Assumptions
- 2. Executive Summary
- 2.1. Introduction
- 3. Market Dynamics
- 3.1. Introduction
- 3.2. Market Drivers
- 3.2.1. ; Increasing Demand From Aerospace Industry; Other Driver
- 3.3. Market Restrains
- 3.3.1. ; Decline in Automotive Industry; Impact of COVID-19 Pandemic
- 3.4. Market Trends
- 3.4.1. Automotive Industry Dominated the Market
- 4. Market Factor Analysis
- 4.1. Porters Five Forces
- 4.2. Supply/Value Chain
- 4.3. PESTEL analysis
- 4.4. Market Entropy
- 4.5. Patent/Trademark Analysis
- 5. Global Topcoat Market Analysis, Insights and Forecast, 2019-2031
- 5.1. Market Analysis, Insights and Forecast - by Resin Type
- 5.1.1. Polyurethane
- 5.1.2. Acrylic
- 5.1.3. Epoxy
- 5.1.4. Other Resin Types
- 5.2. Market Analysis, Insights and Forecast - by End-user Industry
- 5.2.1. Automotive
- 5.2.2. Aerospace
- 5.2.3. Marine
- 5.2.4. Other End-user Industries
- 5.3. Market Analysis, Insights and Forecast - by Region
- 5.3.1. Asia Pacific
- 5.3.2. North America
- 5.3.3. Europe
- 5.3.4. South America
- 5.3.5. Middle East and Africa
- 5.1. Market Analysis, Insights and Forecast - by Resin Type
- 6. Asia Pacific Topcoat Market Analysis, Insights and Forecast, 2019-2031
- 6.1. Market Analysis, Insights and Forecast - by Resin Type
- 6.1.1. Polyurethane
- 6.1.2. Acrylic
- 6.1.3. Epoxy
- 6.1.4. Other Resin Types
- 6.2. Market Analysis, Insights and Forecast - by End-user Industry
- 6.2.1. Automotive
- 6.2.2. Aerospace
- 6.2.3. Marine
- 6.2.4. Other End-user Industries
- 6.1. Market Analysis, Insights and Forecast - by Resin Type
- 7. North America Topcoat Market Analysis, Insights and Forecast, 2019-2031
- 7.1. Market Analysis, Insights and Forecast - by Resin Type
- 7.1.1. Polyurethane
- 7.1.2. Acrylic
- 7.1.3. Epoxy
- 7.1.4. Other Resin Types
- 7.2. Market Analysis, Insights and Forecast - by End-user Industry
- 7.2.1. Automotive
- 7.2.2. Aerospace
- 7.2.3. Marine
- 7.2.4. Other End-user Industries
- 7.1. Market Analysis, Insights and Forecast - by Resin Type
- 8. Europe Topcoat Market Analysis, Insights and Forecast, 2019-2031
- 8.1. Market Analysis, Insights and Forecast - by Resin Type
- 8.1.1. Polyurethane
- 8.1.2. Acrylic
- 8.1.3. Epoxy
- 8.1.4. Other Resin Types
- 8.2. Market Analysis, Insights and Forecast - by End-user Industry
- 8.2.1. Automotive
- 8.2.2. Aerospace
- 8.2.3. Marine
- 8.2.4. Other End-user Industries
- 8.1. Market Analysis, Insights and Forecast - by Resin Type
- 9. South America Topcoat Market Analysis, Insights and Forecast, 2019-2031
- 9.1. Market Analysis, Insights and Forecast - by Resin Type
- 9.1.1. Polyurethane
- 9.1.2. Acrylic
- 9.1.3. Epoxy
- 9.1.4. Other Resin Types
- 9.2. Market Analysis, Insights and Forecast - by End-user Industry
- 9.2.1. Automotive
- 9.2.2. Aerospace
- 9.2.3. Marine
- 9.2.4. Other End-user Industries
- 9.1. Market Analysis, Insights and Forecast - by Resin Type
- 10. Middle East and Africa Topcoat Market Analysis, Insights and Forecast, 2019-2031
- 10.1. Market Analysis, Insights and Forecast - by Resin Type
- 10.1.1. Polyurethane
- 10.1.2. Acrylic
- 10.1.3. Epoxy
- 10.1.4. Other Resin Types
- 10.2. Market Analysis, Insights and Forecast - by End-user Industry
- 10.2.1. Automotive
- 10.2.2. Aerospace
- 10.2.3. Marine
- 10.2.4. Other End-user Industries
- 10.1. Market Analysis, Insights and Forecast - by Resin Type
- 11. Asia Pacific Topcoat Market Analysis, Insights and Forecast, 2019-2031
- 11.1. Market Analysis, Insights and Forecast - By Country/Sub-region
- 11.1.1 China
- 11.1.2 India
- 11.1.3 Japan
- 11.1.4 South Korea
- 11.1.5 Rest of Asia Pacific
- 12. North America Topcoat Market Analysis, Insights and Forecast, 2019-2031
- 12.1. Market Analysis, Insights and Forecast - By Country/Sub-region
- 12.1.1 United States
- 12.1.2 Canada
- 12.1.3 Mexico
- 13. Europe Topcoat Market Analysis, Insights and Forecast, 2019-2031
- 13.1. Market Analysis, Insights and Forecast - By Country/Sub-region
- 13.1.1 United Kingdom
- 13.1.2 France
- 13.1.3 Germany
- 13.1.4 Italy
- 13.1.5 Rest of Europe
- 14. South America Topcoat Market Analysis, Insights and Forecast, 2019-2031
- 14.1. Market Analysis, Insights and Forecast - By Country/Sub-region
- 14.1.1 Brazil
- 14.1.2 Argentina
- 14.1.3 Rest of South America
- 15. Middle East and Africa Topcoat Market Analysis, Insights and Forecast, 2019-2031
- 15.1. Market Analysis, Insights and Forecast - By Country/Sub-region
- 15.1.1 South Africa
- 15.1.2 Saudi Arabia
- 15.1.3 Rest of Middle East and Africa
- 16. Competitive Analysis
- 16.1. Global Market Share Analysis 2024
- 16.2. Company Profiles
- 16.2.1 The Sherwin-Williams Company*List Not Exhaustive
- 16.2.1.1. Overview
- 16.2.1.2. Products
- 16.2.1.3. SWOT Analysis
- 16.2.1.4. Recent Developments
- 16.2.1.5. Financials (Based on Availability)
- 16.2.2 Chugoku Marine Paints Ltd
- 16.2.2.1. Overview
- 16.2.2.2. Products
- 16.2.2.3. SWOT Analysis
- 16.2.2.4. Recent Developments
- 16.2.2.5. Financials (Based on Availability)
- 16.2.3 Jotun
- 16.2.3.1. Overview
- 16.2.3.2. Products
- 16.2.3.3. SWOT Analysis
- 16.2.3.4. Recent Developments
- 16.2.3.5. Financials (Based on Availability)
- 16.2.4 PPG Industries Inc
- 16.2.4.1. Overview
- 16.2.4.2. Products
- 16.2.4.3. SWOT Analysis
- 16.2.4.4. Recent Developments
- 16.2.4.5. Financials (Based on Availability)
- 16.2.5 BASF SE
- 16.2.5.1. Overview
- 16.2.5.2. Products
- 16.2.5.3. SWOT Analysis
- 16.2.5.4. Recent Developments
- 16.2.5.5. Financials (Based on Availability)
- 16.2.6 Hempel A/S
- 16.2.6.1. Overview
- 16.2.6.2. Products
- 16.2.6.3. SWOT Analysis
- 16.2.6.4. Recent Developments
- 16.2.6.5. Financials (Based on Availability)
- 16.2.7 Akzo Nobel N V
- 16.2.7.1. Overview
- 16.2.7.2. Products
- 16.2.7.3. SWOT Analysis
- 16.2.7.4. Recent Developments
- 16.2.7.5. Financials (Based on Availability)
- 16.2.8 NIPPON PAINT
- 16.2.8.1. Overview
- 16.2.8.2. Products
- 16.2.8.3. SWOT Analysis
- 16.2.8.4. Recent Developments
- 16.2.8.5. Financials (Based on Availability)
- 16.2.9 Kansai Paint Co Ltd
- 16.2.9.1. Overview
- 16.2.9.2. Products
- 16.2.9.3. SWOT Analysis
- 16.2.9.4. Recent Developments
- 16.2.9.5. Financials (Based on Availability)
- 16.2.1 The Sherwin-Williams Company*List Not Exhaustive
List of Figures
- Figure 1: Global Topcoat Market Revenue Breakdown (Million, %) by Region 2024 & 2032
- Figure 2: Global Topcoat Market Volume Breakdown (liter per unit, %) by Region 2024 & 2032
- Figure 3: Asia Pacific Topcoat Market Revenue (Million), by Country 2024 & 2032
- Figure 4: Asia Pacific Topcoat Market Volume (liter per unit), by Country 2024 & 2032
- Figure 5: Asia Pacific Topcoat Market Revenue Share (%), by Country 2024 & 2032
- Figure 6: Asia Pacific Topcoat Market Volume Share (%), by Country 2024 & 2032
- Figure 7: North America Topcoat Market Revenue (Million), by Country 2024 & 2032
- Figure 8: North America Topcoat Market Volume (liter per unit), by Country 2024 & 2032
- Figure 9: North America Topcoat Market Revenue Share (%), by Country 2024 & 2032
- Figure 10: North America Topcoat Market Volume Share (%), by Country 2024 & 2032
- Figure 11: Europe Topcoat Market Revenue (Million), by Country 2024 & 2032
- Figure 12: Europe Topcoat Market Volume (liter per unit), by Country 2024 & 2032
- Figure 13: Europe Topcoat Market Revenue Share (%), by Country 2024 & 2032
- Figure 14: Europe Topcoat Market Volume Share (%), by Country 2024 & 2032
- Figure 15: South America Topcoat Market Revenue (Million), by Country 2024 & 2032
- Figure 16: South America Topcoat Market Volume (liter per unit), by Country 2024 & 2032
- Figure 17: South America Topcoat Market Revenue Share (%), by Country 2024 & 2032
- Figure 18: South America Topcoat Market Volume Share (%), by Country 2024 & 2032
- Figure 19: Middle East and Africa Topcoat Market Revenue (Million), by Country 2024 & 2032
- Figure 20: Middle East and Africa Topcoat Market Volume (liter per unit), by Country 2024 & 2032
- Figure 21: Middle East and Africa Topcoat Market Revenue Share (%), by Country 2024 & 2032
- Figure 22: Middle East and Africa Topcoat Market Volume Share (%), by Country 2024 & 2032
- Figure 23: Asia Pacific Topcoat Market Revenue (Million), by Resin Type 2024 & 2032
- Figure 24: Asia Pacific Topcoat Market Volume (liter per unit), by Resin Type 2024 & 2032
- Figure 25: Asia Pacific Topcoat Market Revenue Share (%), by Resin Type 2024 & 2032
- Figure 26: Asia Pacific Topcoat Market Volume Share (%), by Resin Type 2024 & 2032
- Figure 27: Asia Pacific Topcoat Market Revenue (Million), by End-user Industry 2024 & 2032
- Figure 28: Asia Pacific Topcoat Market Volume (liter per unit), by End-user Industry 2024 & 2032
- Figure 29: Asia Pacific Topcoat Market Revenue Share (%), by End-user Industry 2024 & 2032
- Figure 30: Asia Pacific Topcoat Market Volume Share (%), by End-user Industry 2024 & 2032
- Figure 31: Asia Pacific Topcoat Market Revenue (Million), by Country 2024 & 2032
- Figure 32: Asia Pacific Topcoat Market Volume (liter per unit), by Country 2024 & 2032
- Figure 33: Asia Pacific Topcoat Market Revenue Share (%), by Country 2024 & 2032
- Figure 34: Asia Pacific Topcoat Market Volume Share (%), by Country 2024 & 2032
- Figure 35: North America Topcoat Market Revenue (Million), by Resin Type 2024 & 2032
- Figure 36: North America Topcoat Market Volume (liter per unit), by Resin Type 2024 & 2032
- Figure 37: North America Topcoat Market Revenue Share (%), by Resin Type 2024 & 2032
- Figure 38: North America Topcoat Market Volume Share (%), by Resin Type 2024 & 2032
- Figure 39: North America Topcoat Market Revenue (Million), by End-user Industry 2024 & 2032
- Figure 40: North America Topcoat Market Volume (liter per unit), by End-user Industry 2024 & 2032
- Figure 41: North America Topcoat Market Revenue Share (%), by End-user Industry 2024 & 2032
- Figure 42: North America Topcoat Market Volume Share (%), by End-user Industry 2024 & 2032
- Figure 43: North America Topcoat Market Revenue (Million), by Country 2024 & 2032
- Figure 44: North America Topcoat Market Volume (liter per unit), by Country 2024 & 2032
- Figure 45: North America Topcoat Market Revenue Share (%), by Country 2024 & 2032
- Figure 46: North America Topcoat Market Volume Share (%), by Country 2024 & 2032
- Figure 47: Europe Topcoat Market Revenue (Million), by Resin Type 2024 & 2032
- Figure 48: Europe Topcoat Market Volume (liter per unit), by Resin Type 2024 & 2032
- Figure 49: Europe Topcoat Market Revenue Share (%), by Resin Type 2024 & 2032
- Figure 50: Europe Topcoat Market Volume Share (%), by Resin Type 2024 & 2032
- Figure 51: Europe Topcoat Market Revenue (Million), by End-user Industry 2024 & 2032
- Figure 52: Europe Topcoat Market Volume (liter per unit), by End-user Industry 2024 & 2032
- Figure 53: Europe Topcoat Market Revenue Share (%), by End-user Industry 2024 & 2032
- Figure 54: Europe Topcoat Market Volume Share (%), by End-user Industry 2024 & 2032
- Figure 55: Europe Topcoat Market Revenue (Million), by Country 2024 & 2032
- Figure 56: Europe Topcoat Market Volume (liter per unit), by Country 2024 & 2032
- Figure 57: Europe Topcoat Market Revenue Share (%), by Country 2024 & 2032
- Figure 58: Europe Topcoat Market Volume Share (%), by Country 2024 & 2032
- Figure 59: South America Topcoat Market Revenue (Million), by Resin Type 2024 & 2032
- Figure 60: South America Topcoat Market Volume (liter per unit), by Resin Type 2024 & 2032
- Figure 61: South America Topcoat Market Revenue Share (%), by Resin Type 2024 & 2032
- Figure 62: South America Topcoat Market Volume Share (%), by Resin Type 2024 & 2032
- Figure 63: South America Topcoat Market Revenue (Million), by End-user Industry 2024 & 2032
- Figure 64: South America Topcoat Market Volume (liter per unit), by End-user Industry 2024 & 2032
- Figure 65: South America Topcoat Market Revenue Share (%), by End-user Industry 2024 & 2032
- Figure 66: South America Topcoat Market Volume Share (%), by End-user Industry 2024 & 2032
- Figure 67: South America Topcoat Market Revenue (Million), by Country 2024 & 2032
- Figure 68: South America Topcoat Market Volume (liter per unit), by Country 2024 & 2032
- Figure 69: South America Topcoat Market Revenue Share (%), by Country 2024 & 2032
- Figure 70: South America Topcoat Market Volume Share (%), by Country 2024 & 2032
- Figure 71: Middle East and Africa Topcoat Market Revenue (Million), by Resin Type 2024 & 2032
- Figure 72: Middle East and Africa Topcoat Market Volume (liter per unit), by Resin Type 2024 & 2032
- Figure 73: Middle East and Africa Topcoat Market Revenue Share (%), by Resin Type 2024 & 2032
- Figure 74: Middle East and Africa Topcoat Market Volume Share (%), by Resin Type 2024 & 2032
- Figure 75: Middle East and Africa Topcoat Market Revenue (Million), by End-user Industry 2024 & 2032
- Figure 76: Middle East and Africa Topcoat Market Volume (liter per unit), by End-user Industry 2024 & 2032
- Figure 77: Middle East and Africa Topcoat Market Revenue Share (%), by End-user Industry 2024 & 2032
- Figure 78: Middle East and Africa Topcoat Market Volume Share (%), by End-user Industry 2024 & 2032
- Figure 79: Middle East and Africa Topcoat Market Revenue (Million), by Country 2024 & 2032
- Figure 80: Middle East and Africa Topcoat Market Volume (liter per unit), by Country 2024 & 2032
- Figure 81: Middle East and Africa Topcoat Market Revenue Share (%), by Country 2024 & 2032
- Figure 82: Middle East and Africa Topcoat Market Volume Share (%), by Country 2024 & 2032
List of Tables
- Table 1: Global Topcoat Market Revenue Million Forecast, by Region 2019 & 2032
- Table 2: Global Topcoat Market Volume liter per unit Forecast, by Region 2019 & 2032
- Table 3: Global Topcoat Market Revenue Million Forecast, by Resin Type 2019 & 2032
- Table 4: Global Topcoat Market Volume liter per unit Forecast, by Resin Type 2019 & 2032
- Table 5: Global Topcoat Market Revenue Million Forecast, by End-user Industry 2019 & 2032
- Table 6: Global Topcoat Market Volume liter per unit Forecast, by End-user Industry 2019 & 2032
- Table 7: Global Topcoat Market Revenue Million Forecast, by Region 2019 & 2032
- Table 8: Global Topcoat Market Volume liter per unit Forecast, by Region 2019 & 2032
- Table 9: Global Topcoat Market Revenue Million Forecast, by Country 2019 & 2032
- Table 10: Global Topcoat Market Volume liter per unit Forecast, by Country 2019 & 2032
- Table 11: China Topcoat Market Revenue (Million) Forecast, by Application 2019 & 2032
- Table 12: China Topcoat Market Volume (liter per unit) Forecast, by Application 2019 & 2032
- Table 13: India Topcoat Market Revenue (Million) Forecast, by Application 2019 & 2032
- Table 14: India Topcoat Market Volume (liter per unit) Forecast, by Application 2019 & 2032
- Table 15: Japan Topcoat Market Revenue (Million) Forecast, by Application 2019 & 2032
- Table 16: Japan Topcoat Market Volume (liter per unit) Forecast, by Application 2019 & 2032
- Table 17: South Korea Topcoat Market Revenue (Million) Forecast, by Application 2019 & 2032
- Table 18: South Korea Topcoat Market Volume (liter per unit) Forecast, by Application 2019 & 2032
- Table 19: Rest of Asia Pacific Topcoat Market Revenue (Million) Forecast, by Application 2019 & 2032
- Table 20: Rest of Asia Pacific Topcoat Market Volume (liter per unit) Forecast, by Application 2019 & 2032
- Table 21: Global Topcoat Market Revenue Million Forecast, by Country 2019 & 2032
- Table 22: Global Topcoat Market Volume liter per unit Forecast, by Country 2019 & 2032
- Table 23: United States Topcoat Market Revenue (Million) Forecast, by Application 2019 & 2032
- Table 24: United States Topcoat Market Volume (liter per unit) Forecast, by Application 2019 & 2032
- Table 25: Canada Topcoat Market Revenue (Million) Forecast, by Application 2019 & 2032
- Table 26: Canada Topcoat Market Volume (liter per unit) Forecast, by Application 2019 & 2032
- Table 27: Mexico Topcoat Market Revenue (Million) Forecast, by Application 2019 & 2032
- Table 28: Mexico Topcoat Market Volume (liter per unit) Forecast, by Application 2019 & 2032
- Table 29: Global Topcoat Market Revenue Million Forecast, by Country 2019 & 2032
- Table 30: Global Topcoat Market Volume liter per unit Forecast, by Country 2019 & 2032
- Table 31: United Kingdom Topcoat Market Revenue (Million) Forecast, by Application 2019 & 2032
- Table 32: United Kingdom Topcoat Market Volume (liter per unit) Forecast, by Application 2019 & 2032
- Table 33: France Topcoat Market Revenue (Million) Forecast, by Application 2019 & 2032
- Table 34: France Topcoat Market Volume (liter per unit) Forecast, by Application 2019 & 2032
- Table 35: Germany Topcoat Market Revenue (Million) Forecast, by Application 2019 & 2032
- Table 36: Germany Topcoat Market Volume (liter per unit) Forecast, by Application 2019 & 2032
- Table 37: Italy Topcoat Market Revenue (Million) Forecast, by Application 2019 & 2032
- Table 38: Italy Topcoat Market Volume (liter per unit) Forecast, by Application 2019 & 2032
- Table 39: Rest of Europe Topcoat Market Revenue (Million) Forecast, by Application 2019 & 2032
- Table 40: Rest of Europe Topcoat Market Volume (liter per unit) Forecast, by Application 2019 & 2032
- Table 41: Global Topcoat Market Revenue Million Forecast, by Country 2019 & 2032
- Table 42: Global Topcoat Market Volume liter per unit Forecast, by Country 2019 & 2032
- Table 43: Brazil Topcoat Market Revenue (Million) Forecast, by Application 2019 & 2032
- Table 44: Brazil Topcoat Market Volume (liter per unit) Forecast, by Application 2019 & 2032
- Table 45: Argentina Topcoat Market Revenue (Million) Forecast, by Application 2019 & 2032
- Table 46: Argentina Topcoat Market Volume (liter per unit) Forecast, by Application 2019 & 2032
- Table 47: Rest of South America Topcoat Market Revenue (Million) Forecast, by Application 2019 & 2032
- Table 48: Rest of South America Topcoat Market Volume (liter per unit) Forecast, by Application 2019 & 2032
- Table 49: Global Topcoat Market Revenue Million Forecast, by Country 2019 & 2032
- Table 50: Global Topcoat Market Volume liter per unit Forecast, by Country 2019 & 2032
- Table 51: South Africa Topcoat Market Revenue (Million) Forecast, by Application 2019 & 2032
- Table 52: South Africa Topcoat Market Volume (liter per unit) Forecast, by Application 2019 & 2032
- Table 53: Saudi Arabia Topcoat Market Revenue (Million) Forecast, by Application 2019 & 2032
- Table 54: Saudi Arabia Topcoat Market Volume (liter per unit) Forecast, by Application 2019 & 2032
- Table 55: Rest of Middle East and Africa Topcoat Market Revenue (Million) Forecast, by Application 2019 & 2032
- Table 56: Rest of Middle East and Africa Topcoat Market Volume (liter per unit) Forecast, by Application 2019 & 2032
- Table 57: Global Topcoat Market Revenue Million Forecast, by Resin Type 2019 & 2032
- Table 58: Global Topcoat Market Volume liter per unit Forecast, by Resin Type 2019 & 2032
- Table 59: Global Topcoat Market Revenue Million Forecast, by End-user Industry 2019 & 2032
- Table 60: Global Topcoat Market Volume liter per unit Forecast, by End-user Industry 2019 & 2032
- Table 61: Global Topcoat Market Revenue Million Forecast, by Country 2019 & 2032
- Table 62: Global Topcoat Market Volume liter per unit Forecast, by Country 2019 & 2032
- Table 63: China Topcoat Market Revenue (Million) Forecast, by Application 2019 & 2032
- Table 64: China Topcoat Market Volume (liter per unit) Forecast, by Application 2019 & 2032
- Table 65: India Topcoat Market Revenue (Million) Forecast, by Application 2019 & 2032
- Table 66: India Topcoat Market Volume (liter per unit) Forecast, by Application 2019 & 2032
- Table 67: Japan Topcoat Market Revenue (Million) Forecast, by Application 2019 & 2032
- Table 68: Japan Topcoat Market Volume (liter per unit) Forecast, by Application 2019 & 2032
- Table 69: South Korea Topcoat Market Revenue (Million) Forecast, by Application 2019 & 2032
- Table 70: South Korea Topcoat Market Volume (liter per unit) Forecast, by Application 2019 & 2032
- Table 71: Rest of Asia Pacific Topcoat Market Revenue (Million) Forecast, by Application 2019 & 2032
- Table 72: Rest of Asia Pacific Topcoat Market Volume (liter per unit) Forecast, by Application 2019 & 2032
- Table 73: Global Topcoat Market Revenue Million Forecast, by Resin Type 2019 & 2032
- Table 74: Global Topcoat Market Volume liter per unit Forecast, by Resin Type 2019 & 2032
- Table 75: Global Topcoat Market Revenue Million Forecast, by End-user Industry 2019 & 2032
- Table 76: Global Topcoat Market Volume liter per unit Forecast, by End-user Industry 2019 & 2032
- Table 77: Global Topcoat Market Revenue Million Forecast, by Country 2019 & 2032
- Table 78: Global Topcoat Market Volume liter per unit Forecast, by Country 2019 & 2032
- Table 79: United States Topcoat Market Revenue (Million) Forecast, by Application 2019 & 2032
- Table 80: United States Topcoat Market Volume (liter per unit) Forecast, by Application 2019 & 2032
- Table 81: Canada Topcoat Market Revenue (Million) Forecast, by Application 2019 & 2032
- Table 82: Canada Topcoat Market Volume (liter per unit) Forecast, by Application 2019 & 2032
- Table 83: Mexico Topcoat Market Revenue (Million) Forecast, by Application 2019 & 2032
- Table 84: Mexico Topcoat Market Volume (liter per unit) Forecast, by Application 2019 & 2032
- Table 85: Global Topcoat Market Revenue Million Forecast, by Resin Type 2019 & 2032
- Table 86: Global Topcoat Market Volume liter per unit Forecast, by Resin Type 2019 & 2032
- Table 87: Global Topcoat Market Revenue Million Forecast, by End-user Industry 2019 & 2032
- Table 88: Global Topcoat Market Volume liter per unit Forecast, by End-user Industry 2019 & 2032
- Table 89: Global Topcoat Market Revenue Million Forecast, by Country 2019 & 2032
- Table 90: Global Topcoat Market Volume liter per unit Forecast, by Country 2019 & 2032
- Table 91: United Kingdom Topcoat Market Revenue (Million) Forecast, by Application 2019 & 2032
- Table 92: United Kingdom Topcoat Market Volume (liter per unit) Forecast, by Application 2019 & 2032
- Table 93: France Topcoat Market Revenue (Million) Forecast, by Application 2019 & 2032
- Table 94: France Topcoat Market Volume (liter per unit) Forecast, by Application 2019 & 2032
- Table 95: Germany Topcoat Market Revenue (Million) Forecast, by Application 2019 & 2032
- Table 96: Germany Topcoat Market Volume (liter per unit) Forecast, by Application 2019 & 2032
- Table 97: Italy Topcoat Market Revenue (Million) Forecast, by Application 2019 & 2032
- Table 98: Italy Topcoat Market Volume (liter per unit) Forecast, by Application 2019 & 2032
- Table 99: Rest of Europe Topcoat Market Revenue (Million) Forecast, by Application 2019 & 2032
- Table 100: Rest of Europe Topcoat Market Volume (liter per unit) Forecast, by Application 2019 & 2032
- Table 101: Global Topcoat Market Revenue Million Forecast, by Resin Type 2019 & 2032
- Table 102: Global Topcoat Market Volume liter per unit Forecast, by Resin Type 2019 & 2032
- Table 103: Global Topcoat Market Revenue Million Forecast, by End-user Industry 2019 & 2032
- Table 104: Global Topcoat Market Volume liter per unit Forecast, by End-user Industry 2019 & 2032
- Table 105: Global Topcoat Market Revenue Million Forecast, by Country 2019 & 2032
- Table 106: Global Topcoat Market Volume liter per unit Forecast, by Country 2019 & 2032
- Table 107: Brazil Topcoat Market Revenue (Million) Forecast, by Application 2019 & 2032
- Table 108: Brazil Topcoat Market Volume (liter per unit) Forecast, by Application 2019 & 2032
- Table 109: Argentina Topcoat Market Revenue (Million) Forecast, by Application 2019 & 2032
- Table 110: Argentina Topcoat Market Volume (liter per unit) Forecast, by Application 2019 & 2032
- Table 111: Rest of South America Topcoat Market Revenue (Million) Forecast, by Application 2019 & 2032
- Table 112: Rest of South America Topcoat Market Volume (liter per unit) Forecast, by Application 2019 & 2032
- Table 113: Global Topcoat Market Revenue Million Forecast, by Resin Type 2019 & 2032
- Table 114: Global Topcoat Market Volume liter per unit Forecast, by Resin Type 2019 & 2032
- Table 115: Global Topcoat Market Revenue Million Forecast, by End-user Industry 2019 & 2032
- Table 116: Global Topcoat Market Volume liter per unit Forecast, by End-user Industry 2019 & 2032
- Table 117: Global Topcoat Market Revenue Million Forecast, by Country 2019 & 2032
- Table 118: Global Topcoat Market Volume liter per unit Forecast, by Country 2019 & 2032
- Table 119: South Africa Topcoat Market Revenue (Million) Forecast, by Application 2019 & 2032
- Table 120: South Africa Topcoat Market Volume (liter per unit) Forecast, by Application 2019 & 2032
- Table 121: Saudi Arabia Topcoat Market Revenue (Million) Forecast, by Application 2019 & 2032
- Table 122: Saudi Arabia Topcoat Market Volume (liter per unit) Forecast, by Application 2019 & 2032
- Table 123: Rest of Middle East and Africa Topcoat Market Revenue (Million) Forecast, by Application 2019 & 2032
- Table 124: Rest of Middle East and Africa Topcoat Market Volume (liter per unit) Forecast, by Application 2019 & 2032
Frequently Asked Questions
1. What is the projected Compound Annual Growth Rate (CAGR) of the Topcoat Market?
The projected CAGR is approximately > 5.00%.
2. Which companies are prominent players in the Topcoat Market?
Key companies in the market include The Sherwin-Williams Company*List Not Exhaustive, Chugoku Marine Paints Ltd, Jotun, PPG Industries Inc, BASF SE, Hempel A/S, Akzo Nobel N V, NIPPON PAINT, Kansai Paint Co Ltd.
3. What are the main segments of the Topcoat Market?
The market segments include Resin Type, End-user Industry.
4. Can you provide details about the market size?
The market size is estimated to be USD XX Million as of 2022.
5. What are some drivers contributing to market growth?
; Increasing Demand From Aerospace Industry; Other Driver.
6. What are the notable trends driving market growth?
Automotive Industry Dominated the Market.
7. Are there any restraints impacting market growth?
; Decline in Automotive Industry; Impact of COVID-19 Pandemic.
8. Can you provide examples of recent developments in the market?
N/A
9. What pricing options are available for accessing the report?
Pricing options include single-user, multi-user, and enterprise licenses priced at USD 4750, USD 5250, and USD 8750 respectively.
10. Is the market size provided in terms of value or volume?
The market size is provided in terms of value, measured in Million and volume, measured in liter per unit.
11. Are there any specific market keywords associated with the report?
Yes, the market keyword associated with the report is "Topcoat Market," which aids in identifying and referencing the specific market segment covered.
12. How do I determine which pricing option suits my needs best?
The pricing options vary based on user requirements and access needs. Individual users may opt for single-user licenses, while businesses requiring broader access may choose multi-user or enterprise licenses for cost-effective access to the report.
13. Are there any additional resources or data provided in the Topcoat Market report?
While the report offers comprehensive insights, it's advisable to review the specific contents or supplementary materials provided to ascertain if additional resources or data are available.
14. How can I stay updated on further developments or reports in the Topcoat Market?
To stay informed about further developments, trends, and reports in the Topcoat Market, consider subscribing to industry newsletters, following relevant companies and organizations, or regularly checking reputable industry news sources and publications.
Methodology
Step 1 - Identification of Relevant Samples Size from Population Database


Step 2 - Approaches for Defining Global Market Size (Value, Volume* & Price*)

Note*: In applicable scenarios
Step 3 - Data Sources
Primary Research
- Web Analytics
- Survey Reports
- Research Institute
- Latest Research Reports
- Opinion Leaders
Secondary Research
- Annual Reports
- White Paper
- Latest Press Release
- Industry Association
- Paid Database
- Investor Presentations

Step 4 - Data Triangulation
Involves using different sources of information in order to increase the validity of a study
These sources are likely to be stakeholders in a program - participants, other researchers, program staff, other community members, and so on.
Then we put all data in single framework & apply various statistical tools to find out the dynamic on the market.
During the analysis stage, feedback from the stakeholder groups would be compared to determine areas of agreement as well as areas of divergence
