

Key Insights
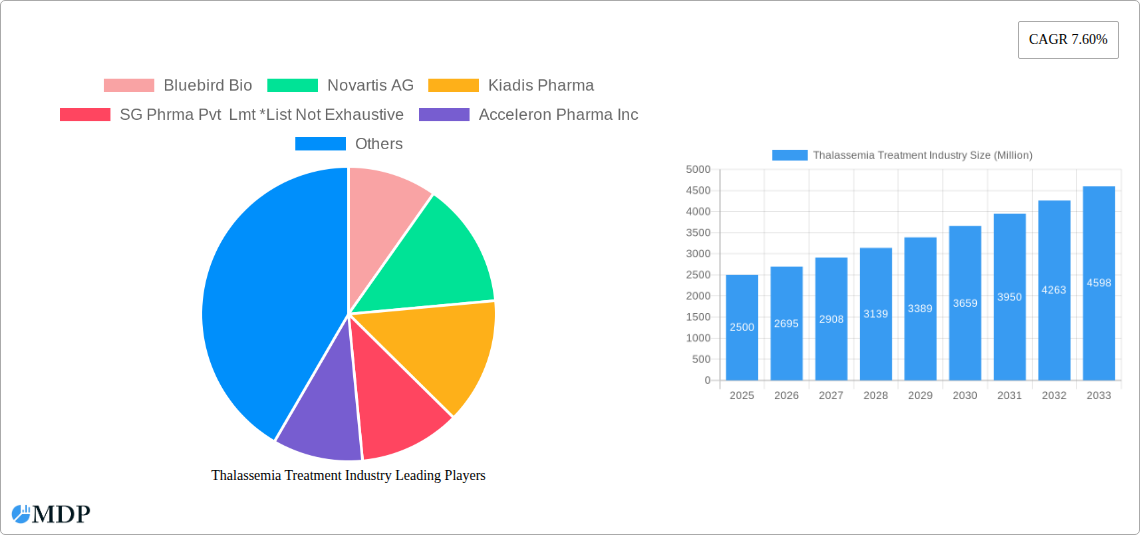
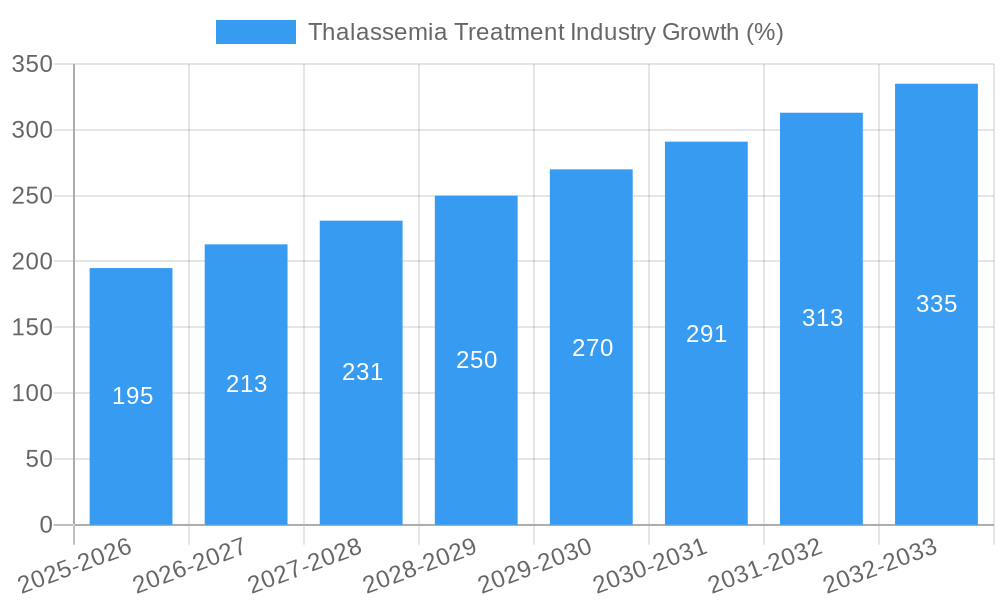
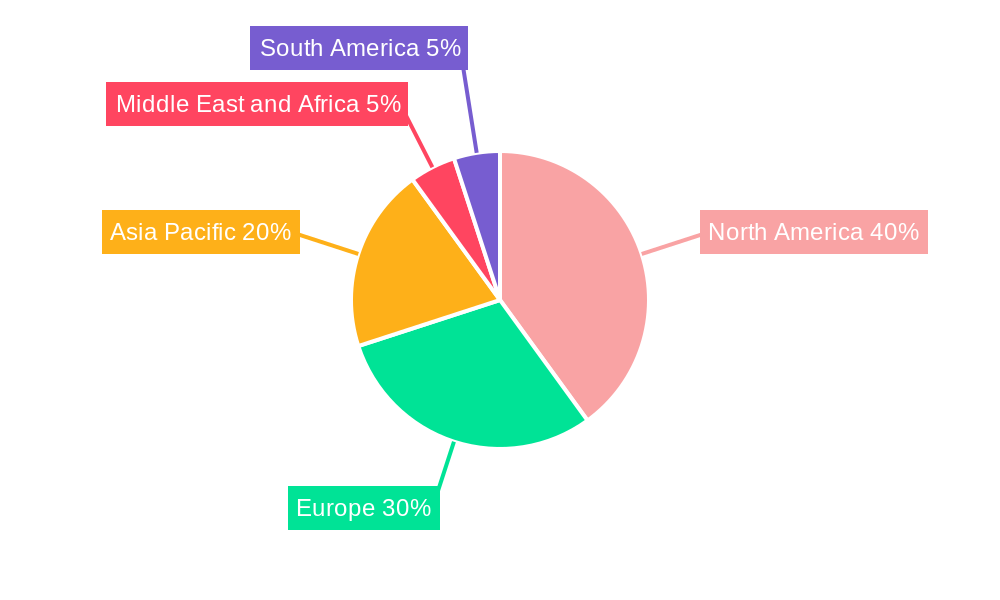
The global thalassemia treatment market, valued at approximately $2.5 billion in 2025, is projected to experience robust growth, driven by rising prevalence of thalassemia, particularly in developing nations, and increasing awareness of available treatment options. A compound annual growth rate (CAGR) of 7.6% from 2025 to 2033 indicates a significant market expansion, reaching an estimated value of $4.5 billion by 2033. Key drivers include advancements in gene therapy and novel drug development, leading to improved treatment outcomes and reduced long-term complications. The market is segmented by disease type (alpha and beta thalassemia), end-user (hospitals and research institutes), and treatment type (blood transfusions, iron chelation therapy, and folic acid supplements). While blood transfusions remain a cornerstone of treatment, the growing adoption of more effective therapies, such as iron chelation and newer gene therapies, is fueling market growth within specific segments. Geographic variations exist, with North America and Europe currently holding significant market shares due to advanced healthcare infrastructure and higher per capita healthcare expenditure. However, the Asia-Pacific region is expected to witness substantial growth driven by the high prevalence of thalassemia in countries like India and China. Restraints include the high cost of novel therapies, limited access to advanced treatment in developing countries, and the potential for adverse effects associated with certain treatments.
The competitive landscape is dynamic, featuring established pharmaceutical companies like Novartis and Pfizer, alongside emerging biotech companies specializing in gene therapy. The ongoing research and development efforts focusing on curative therapies, such as gene editing and CRISPR-Cas9 technology, promise transformative advancements in thalassemia treatment. This, coupled with increasing government initiatives supporting research and development, will further stimulate market growth in the coming years. However, challenges remain in ensuring equitable access to these advanced therapies across diverse global populations, particularly in resource-constrained settings. Future market success will depend on collaborative efforts among stakeholders, including pharmaceutical companies, healthcare providers, and regulatory bodies, to overcome these challenges and improve the lives of individuals affected by thalassemia.
Thalassemia Treatment Industry: Market Analysis & Forecast (2019-2033)
This comprehensive report provides an in-depth analysis of the global Thalassemia Treatment industry, offering crucial insights for stakeholders, investors, and industry professionals. The study period covers 2019-2033, with 2025 as the base and estimated year, and a forecast period spanning 2025-2033. The report encompasses market sizing, segmentation analysis, competitive landscape, and future growth projections, focusing on key treatment types, end-users, and geographic regions. The market is expected to reach xx Million by 2033, showcasing significant growth potential.
Thalassemia Treatment Industry Market Dynamics & Concentration
The global thalassemia treatment market exhibits a moderately concentrated landscape, with a few key players holding significant market share. While precise figures for market share require deeper analysis within the full report, we estimate that the top 5 companies account for approximately xx% of the market in 2025. Innovation is a major driver, with ongoing research into gene therapies and novel drug development significantly impacting market dynamics. Regulatory frameworks, varying across different regions, play a crucial role in shaping market access and approvals for new treatments. The emergence of effective alternative therapies and advancements in blood transfusion techniques present competitive challenges. The industry witnesses consistent merger and acquisition (M&A) activity, with an estimated xx M&A deals occurring between 2019 and 2024, leading to consolidation and market expansion strategies. End-user trends show a growing demand from hospitals and research institutions, driving the market's expansion.
Thalassemia Treatment Industry Industry Trends & Analysis
The thalassemia treatment market is witnessing robust growth, driven by increasing prevalence of thalassemia globally, coupled with rising healthcare expenditure and awareness. The market is expected to register a CAGR of xx% during the forecast period (2025-2033). Technological advancements, particularly in gene therapies and personalized medicine, are disrupting the traditional treatment landscape. Consumer preferences are shifting towards less invasive and more effective therapies with minimal side effects. Intense competitive dynamics, fueled by a growing number of players introducing innovative therapies and improvements in existing treatments, are further shaping the market. Market penetration of newer therapies, such as gene editing, is expected to increase significantly in the coming years, driven by improved efficacy and reduced long-term treatment costs.
Leading Markets & Segments in Thalassemia Treatment Industry
The Beta-thalassemia segment dominates the disease type market, accounting for a larger share due to its higher prevalence compared to Alpha-thalassemia. Hospitals form the largest end-user segment, fueled by increasing patient admissions and the requirement for advanced treatment facilities. By treatment type, blood transfusions currently hold the largest market share; however, iron chelation therapy and other innovative treatments are gradually gaining traction due to their reduced side effects and improved long-term outcomes.
- Key Drivers for Beta-Thalassemia Dominance: High prevalence, established treatment protocols, and ongoing research efforts.
- Key Drivers for Hospitals as Leading End-User: Availability of advanced medical infrastructure, specialized medical professionals, and increased patient admissions.
- Key Drivers for Blood Transfusions: Established treatment, widespread availability, and relative cost-effectiveness in the short-term.
Geographic dominance is likely to be concentrated in regions with high thalassemia prevalence and better healthcare infrastructure, such as countries in the Mediterranean region and South Asia (specific country analysis is within the full report). Economic policies encouraging healthcare investments and robust healthcare infrastructure are crucial growth drivers in these regions.
Thalassemia Treatment Industry Product Developments
Significant advancements in gene therapy, particularly CRISPR-Cas9 technology, are revolutionizing thalassemia treatment. New therapies aim to correct the genetic defects causing thalassemia, offering a potential cure rather than lifelong management. These innovative treatments offer improved efficacy, reduced side effects, and the potential to eliminate the need for frequent blood transfusions and iron chelation therapy. Companies are actively focusing on developing personalized treatments to cater to the diverse genetic subtypes of thalassemia, leading to increased market competition and potential for improved patient outcomes.
Key Drivers of Thalassemia Treatment Industry Growth
Technological advancements in gene therapy and novel drug discovery are leading to the development of more effective and targeted treatments. Rising healthcare expenditure, coupled with increased awareness and improved diagnosis, is driving market growth. Favorable regulatory environments that expedite the approval process for new therapies also play a vital role.
Challenges in the Thalassemia Treatment Industry Market
High cost of advanced therapies, particularly gene therapies, presents a significant barrier to access for many patients. The complex regulatory pathways for drug approval can delay the market entry of innovative treatments. Potential supply chain disruptions could impact the availability and affordability of essential treatments, such as blood transfusions and iron chelation therapies. Moreover, intense competition amongst existing and emerging players poses a challenge to market share and profitability. The impact of these challenges is estimated to reduce the market growth by approximately xx% in the next few years.
Emerging Opportunities in Thalassemia Treatment Industry
The market presents significant opportunities for players involved in research, development, and commercialization of innovative therapies, including gene editing and cell-based therapies. Strategic collaborations between pharmaceutical companies and research institutions are likely to accelerate the development and market access of new treatments. Expansion into emerging markets with high thalassemia prevalence but limited access to advanced therapies holds significant potential.
Leading Players in the Thalassemia Treatment Industry Sector
- Bluebird Bio
- Novartis AG
- Kiadis Pharma
- SG Phrma Pvt Lmt
- Acceleron Pharma Inc
- Bellicum Pharmaceuticals
- ApoPharma Inc
- IONIS Pharmaceuticals
- Pfizer Inc
Key Milestones in Thalassemia Treatment Industry Industry
- 2020: FDA approval of a novel gene therapy for Beta-thalassemia.
- 2022: Launch of a new iron chelation therapy with improved efficacy and tolerability.
- 2023: Significant investment in research and development by major pharmaceutical companies.
- 2024: Several strategic partnerships formed to accelerate the development of innovative treatments. (Specific details are within the full report).
Strategic Outlook for Thalassemia Treatment Industry Market
The thalassemia treatment market is poised for substantial growth in the coming years, driven by continuous technological advancements and increasing investment in research and development. Companies strategically focusing on developing personalized therapies, improving access to affordable treatments, and expanding into emerging markets are likely to achieve significant market success. Focus on long-term partnerships and collaborations is vital for navigating the complex regulatory landscape and accelerating the delivery of improved treatments to patients.
Thalassemia Treatment Industry Segmentation
-
1. Treatment Type
- 1.1. Blood Transfusions
- 1.2. Iron Chelation Therapy
- 1.3. Folic Acid Supplements
- 1.4. Others
-
2. Disease Type
- 2.1. Alpha Thalassemia
- 2.2. Beta Thalassemia
-
3. End-User
- 3.1. Hospitals
- 3.2. Research Institutes
- 3.3. Others
Thalassemia Treatment Industry Segmentation By Geography
-
1. North America
- 1.1. United States
- 1.2. Canada
- 1.3. Mexico
-
2. Europe
- 2.1. Germany
- 2.2. United Kingdom
- 2.3. France
- 2.4. Italy
- 2.5. Spain
- 2.6. Rest of Europe
-
3. Asia Pacific
- 3.1. China
- 3.2. Japan
- 3.3. India
- 3.4. Australia
- 3.5. South Korea
- 3.6. Rest of Asia Pacific
-
4. Middle East and Africa
- 4.1. GCC
- 4.2. South Africa
- 4.3. Rest of Middle East and Africa
-
5. South America
- 5.1. Brazil
- 5.2. Argentina
- 5.3. Rest of South America
Thalassemia Treatment Industry REPORT HIGHLIGHTS
| Aspects | Details |
|---|---|
| Study Period | 2019-2033 |
| Base Year | 2024 |
| Estimated Year | 2025 |
| Forecast Period | 2025-2033 |
| Historical Period | 2019-2024 |
| Growth Rate | CAGR of 7.60% from 2019-2033 |
| Segmentation |
|
Table of Contents
- 1. Introduction
- 1.1. Research Scope
- 1.2. Market Segmentation
- 1.3. Research Methodology
- 1.4. Definitions and Assumptions
- 2. Executive Summary
- 2.1. Introduction
- 3. Market Dynamics
- 3.1. Introduction
- 3.2. Market Drivers
- 3.2.1. ; Rising Prevalence of Thalassemia; Increasing Awareness of Thalassemia Treatment
- 3.3. Market Restrains
- 3.3.1. ; High Cost of Treatment
- 3.4. Market Trends
- 3.4.1. Chelation Therapy segment is expected to be the Fastest Growing Segment
- 4. Market Factor Analysis
- 4.1. Porters Five Forces
- 4.2. Supply/Value Chain
- 4.3. PESTEL analysis
- 4.4. Market Entropy
- 4.5. Patent/Trademark Analysis
- 5. Global Thalassemia Treatment Industry Analysis, Insights and Forecast, 2019-2031
- 5.1. Market Analysis, Insights and Forecast - by Treatment Type
- 5.1.1. Blood Transfusions
- 5.1.2. Iron Chelation Therapy
- 5.1.3. Folic Acid Supplements
- 5.1.4. Others
- 5.2. Market Analysis, Insights and Forecast - by Disease Type
- 5.2.1. Alpha Thalassemia
- 5.2.2. Beta Thalassemia
- 5.3. Market Analysis, Insights and Forecast - by End-User
- 5.3.1. Hospitals
- 5.3.2. Research Institutes
- 5.3.3. Others
- 5.4. Market Analysis, Insights and Forecast - by Region
- 5.4.1. North America
- 5.4.2. Europe
- 5.4.3. Asia Pacific
- 5.4.4. Middle East and Africa
- 5.4.5. South America
- 5.1. Market Analysis, Insights and Forecast - by Treatment Type
- 6. North America Thalassemia Treatment Industry Analysis, Insights and Forecast, 2019-2031
- 6.1. Market Analysis, Insights and Forecast - by Treatment Type
- 6.1.1. Blood Transfusions
- 6.1.2. Iron Chelation Therapy
- 6.1.3. Folic Acid Supplements
- 6.1.4. Others
- 6.2. Market Analysis, Insights and Forecast - by Disease Type
- 6.2.1. Alpha Thalassemia
- 6.2.2. Beta Thalassemia
- 6.3. Market Analysis, Insights and Forecast - by End-User
- 6.3.1. Hospitals
- 6.3.2. Research Institutes
- 6.3.3. Others
- 6.1. Market Analysis, Insights and Forecast - by Treatment Type
- 7. Europe Thalassemia Treatment Industry Analysis, Insights and Forecast, 2019-2031
- 7.1. Market Analysis, Insights and Forecast - by Treatment Type
- 7.1.1. Blood Transfusions
- 7.1.2. Iron Chelation Therapy
- 7.1.3. Folic Acid Supplements
- 7.1.4. Others
- 7.2. Market Analysis, Insights and Forecast - by Disease Type
- 7.2.1. Alpha Thalassemia
- 7.2.2. Beta Thalassemia
- 7.3. Market Analysis, Insights and Forecast - by End-User
- 7.3.1. Hospitals
- 7.3.2. Research Institutes
- 7.3.3. Others
- 7.1. Market Analysis, Insights and Forecast - by Treatment Type
- 8. Asia Pacific Thalassemia Treatment Industry Analysis, Insights and Forecast, 2019-2031
- 8.1. Market Analysis, Insights and Forecast - by Treatment Type
- 8.1.1. Blood Transfusions
- 8.1.2. Iron Chelation Therapy
- 8.1.3. Folic Acid Supplements
- 8.1.4. Others
- 8.2. Market Analysis, Insights and Forecast - by Disease Type
- 8.2.1. Alpha Thalassemia
- 8.2.2. Beta Thalassemia
- 8.3. Market Analysis, Insights and Forecast - by End-User
- 8.3.1. Hospitals
- 8.3.2. Research Institutes
- 8.3.3. Others
- 8.1. Market Analysis, Insights and Forecast - by Treatment Type
- 9. Middle East and Africa Thalassemia Treatment Industry Analysis, Insights and Forecast, 2019-2031
- 9.1. Market Analysis, Insights and Forecast - by Treatment Type
- 9.1.1. Blood Transfusions
- 9.1.2. Iron Chelation Therapy
- 9.1.3. Folic Acid Supplements
- 9.1.4. Others
- 9.2. Market Analysis, Insights and Forecast - by Disease Type
- 9.2.1. Alpha Thalassemia
- 9.2.2. Beta Thalassemia
- 9.3. Market Analysis, Insights and Forecast - by End-User
- 9.3.1. Hospitals
- 9.3.2. Research Institutes
- 9.3.3. Others
- 9.1. Market Analysis, Insights and Forecast - by Treatment Type
- 10. South America Thalassemia Treatment Industry Analysis, Insights and Forecast, 2019-2031
- 10.1. Market Analysis, Insights and Forecast - by Treatment Type
- 10.1.1. Blood Transfusions
- 10.1.2. Iron Chelation Therapy
- 10.1.3. Folic Acid Supplements
- 10.1.4. Others
- 10.2. Market Analysis, Insights and Forecast - by Disease Type
- 10.2.1. Alpha Thalassemia
- 10.2.2. Beta Thalassemia
- 10.3. Market Analysis, Insights and Forecast - by End-User
- 10.3.1. Hospitals
- 10.3.2. Research Institutes
- 10.3.3. Others
- 10.1. Market Analysis, Insights and Forecast - by Treatment Type
- 11. North America Thalassemia Treatment Industry Analysis, Insights and Forecast, 2019-2031
- 11.1. Market Analysis, Insights and Forecast - By Country/Sub-region
- 11.1.1 United States
- 11.1.2 Canada
- 11.1.3 Mexico
- 12. Europe Thalassemia Treatment Industry Analysis, Insights and Forecast, 2019-2031
- 12.1. Market Analysis, Insights and Forecast - By Country/Sub-region
- 12.1.1 Germany
- 12.1.2 United Kingdom
- 12.1.3 France
- 12.1.4 Italy
- 12.1.5 Spain
- 12.1.6 Rest of Europe
- 13. Asia Pacific Thalassemia Treatment Industry Analysis, Insights and Forecast, 2019-2031
- 13.1. Market Analysis, Insights and Forecast - By Country/Sub-region
- 13.1.1 China
- 13.1.2 Japan
- 13.1.3 India
- 13.1.4 Australia
- 13.1.5 South Korea
- 13.1.6 Rest of Asia Pacific
- 14. Middle East and Africa Thalassemia Treatment Industry Analysis, Insights and Forecast, 2019-2031
- 14.1. Market Analysis, Insights and Forecast - By Country/Sub-region
- 14.1.1 GCC
- 14.1.2 South Africa
- 14.1.3 Rest of Middle East and Africa
- 15. South America Thalassemia Treatment Industry Analysis, Insights and Forecast, 2019-2031
- 15.1. Market Analysis, Insights and Forecast - By Country/Sub-region
- 15.1.1 Brazil
- 15.1.2 Argentina
- 15.1.3 Rest of South America
- 16. Competitive Analysis
- 16.1. Global Market Share Analysis 2024
- 16.2. Company Profiles
- 16.2.1 Bluebird Bio
- 16.2.1.1. Overview
- 16.2.1.2. Products
- 16.2.1.3. SWOT Analysis
- 16.2.1.4. Recent Developments
- 16.2.1.5. Financials (Based on Availability)
- 16.2.2 Novartis AG
- 16.2.2.1. Overview
- 16.2.2.2. Products
- 16.2.2.3. SWOT Analysis
- 16.2.2.4. Recent Developments
- 16.2.2.5. Financials (Based on Availability)
- 16.2.3 Kiadis Pharma
- 16.2.3.1. Overview
- 16.2.3.2. Products
- 16.2.3.3. SWOT Analysis
- 16.2.3.4. Recent Developments
- 16.2.3.5. Financials (Based on Availability)
- 16.2.4 SG Phrma Pvt Lmt *List Not Exhaustive
- 16.2.4.1. Overview
- 16.2.4.2. Products
- 16.2.4.3. SWOT Analysis
- 16.2.4.4. Recent Developments
- 16.2.4.5. Financials (Based on Availability)
- 16.2.5 Acceleron Pharma Inc
- 16.2.5.1. Overview
- 16.2.5.2. Products
- 16.2.5.3. SWOT Analysis
- 16.2.5.4. Recent Developments
- 16.2.5.5. Financials (Based on Availability)
- 16.2.6 Bellicum Pharmaceuticals
- 16.2.6.1. Overview
- 16.2.6.2. Products
- 16.2.6.3. SWOT Analysis
- 16.2.6.4. Recent Developments
- 16.2.6.5. Financials (Based on Availability)
- 16.2.7 ApoPharma Inc
- 16.2.7.1. Overview
- 16.2.7.2. Products
- 16.2.7.3. SWOT Analysis
- 16.2.7.4. Recent Developments
- 16.2.7.5. Financials (Based on Availability)
- 16.2.8 IONIS Pharmaceuticals
- 16.2.8.1. Overview
- 16.2.8.2. Products
- 16.2.8.3. SWOT Analysis
- 16.2.8.4. Recent Developments
- 16.2.8.5. Financials (Based on Availability)
- 16.2.9 Pfizer Inc
- 16.2.9.1. Overview
- 16.2.9.2. Products
- 16.2.9.3. SWOT Analysis
- 16.2.9.4. Recent Developments
- 16.2.9.5. Financials (Based on Availability)
- 16.2.1 Bluebird Bio
List of Figures
- Figure 1: Global Thalassemia Treatment Industry Revenue Breakdown (Million, %) by Region 2024 & 2032
- Figure 2: North America Thalassemia Treatment Industry Revenue (Million), by Country 2024 & 2032
- Figure 3: North America Thalassemia Treatment Industry Revenue Share (%), by Country 2024 & 2032
- Figure 4: Europe Thalassemia Treatment Industry Revenue (Million), by Country 2024 & 2032
- Figure 5: Europe Thalassemia Treatment Industry Revenue Share (%), by Country 2024 & 2032
- Figure 6: Asia Pacific Thalassemia Treatment Industry Revenue (Million), by Country 2024 & 2032
- Figure 7: Asia Pacific Thalassemia Treatment Industry Revenue Share (%), by Country 2024 & 2032
- Figure 8: Middle East and Africa Thalassemia Treatment Industry Revenue (Million), by Country 2024 & 2032
- Figure 9: Middle East and Africa Thalassemia Treatment Industry Revenue Share (%), by Country 2024 & 2032
- Figure 10: South America Thalassemia Treatment Industry Revenue (Million), by Country 2024 & 2032
- Figure 11: South America Thalassemia Treatment Industry Revenue Share (%), by Country 2024 & 2032
- Figure 12: North America Thalassemia Treatment Industry Revenue (Million), by Treatment Type 2024 & 2032
- Figure 13: North America Thalassemia Treatment Industry Revenue Share (%), by Treatment Type 2024 & 2032
- Figure 14: North America Thalassemia Treatment Industry Revenue (Million), by Disease Type 2024 & 2032
- Figure 15: North America Thalassemia Treatment Industry Revenue Share (%), by Disease Type 2024 & 2032
- Figure 16: North America Thalassemia Treatment Industry Revenue (Million), by End-User 2024 & 2032
- Figure 17: North America Thalassemia Treatment Industry Revenue Share (%), by End-User 2024 & 2032
- Figure 18: North America Thalassemia Treatment Industry Revenue (Million), by Country 2024 & 2032
- Figure 19: North America Thalassemia Treatment Industry Revenue Share (%), by Country 2024 & 2032
- Figure 20: Europe Thalassemia Treatment Industry Revenue (Million), by Treatment Type 2024 & 2032
- Figure 21: Europe Thalassemia Treatment Industry Revenue Share (%), by Treatment Type 2024 & 2032
- Figure 22: Europe Thalassemia Treatment Industry Revenue (Million), by Disease Type 2024 & 2032
- Figure 23: Europe Thalassemia Treatment Industry Revenue Share (%), by Disease Type 2024 & 2032
- Figure 24: Europe Thalassemia Treatment Industry Revenue (Million), by End-User 2024 & 2032
- Figure 25: Europe Thalassemia Treatment Industry Revenue Share (%), by End-User 2024 & 2032
- Figure 26: Europe Thalassemia Treatment Industry Revenue (Million), by Country 2024 & 2032
- Figure 27: Europe Thalassemia Treatment Industry Revenue Share (%), by Country 2024 & 2032
- Figure 28: Asia Pacific Thalassemia Treatment Industry Revenue (Million), by Treatment Type 2024 & 2032
- Figure 29: Asia Pacific Thalassemia Treatment Industry Revenue Share (%), by Treatment Type 2024 & 2032
- Figure 30: Asia Pacific Thalassemia Treatment Industry Revenue (Million), by Disease Type 2024 & 2032
- Figure 31: Asia Pacific Thalassemia Treatment Industry Revenue Share (%), by Disease Type 2024 & 2032
- Figure 32: Asia Pacific Thalassemia Treatment Industry Revenue (Million), by End-User 2024 & 2032
- Figure 33: Asia Pacific Thalassemia Treatment Industry Revenue Share (%), by End-User 2024 & 2032
- Figure 34: Asia Pacific Thalassemia Treatment Industry Revenue (Million), by Country 2024 & 2032
- Figure 35: Asia Pacific Thalassemia Treatment Industry Revenue Share (%), by Country 2024 & 2032
- Figure 36: Middle East and Africa Thalassemia Treatment Industry Revenue (Million), by Treatment Type 2024 & 2032
- Figure 37: Middle East and Africa Thalassemia Treatment Industry Revenue Share (%), by Treatment Type 2024 & 2032
- Figure 38: Middle East and Africa Thalassemia Treatment Industry Revenue (Million), by Disease Type 2024 & 2032
- Figure 39: Middle East and Africa Thalassemia Treatment Industry Revenue Share (%), by Disease Type 2024 & 2032
- Figure 40: Middle East and Africa Thalassemia Treatment Industry Revenue (Million), by End-User 2024 & 2032
- Figure 41: Middle East and Africa Thalassemia Treatment Industry Revenue Share (%), by End-User 2024 & 2032
- Figure 42: Middle East and Africa Thalassemia Treatment Industry Revenue (Million), by Country 2024 & 2032
- Figure 43: Middle East and Africa Thalassemia Treatment Industry Revenue Share (%), by Country 2024 & 2032
- Figure 44: South America Thalassemia Treatment Industry Revenue (Million), by Treatment Type 2024 & 2032
- Figure 45: South America Thalassemia Treatment Industry Revenue Share (%), by Treatment Type 2024 & 2032
- Figure 46: South America Thalassemia Treatment Industry Revenue (Million), by Disease Type 2024 & 2032
- Figure 47: South America Thalassemia Treatment Industry Revenue Share (%), by Disease Type 2024 & 2032
- Figure 48: South America Thalassemia Treatment Industry Revenue (Million), by End-User 2024 & 2032
- Figure 49: South America Thalassemia Treatment Industry Revenue Share (%), by End-User 2024 & 2032
- Figure 50: South America Thalassemia Treatment Industry Revenue (Million), by Country 2024 & 2032
- Figure 51: South America Thalassemia Treatment Industry Revenue Share (%), by Country 2024 & 2032
List of Tables
- Table 1: Global Thalassemia Treatment Industry Revenue Million Forecast, by Region 2019 & 2032
- Table 2: Global Thalassemia Treatment Industry Revenue Million Forecast, by Treatment Type 2019 & 2032
- Table 3: Global Thalassemia Treatment Industry Revenue Million Forecast, by Disease Type 2019 & 2032
- Table 4: Global Thalassemia Treatment Industry Revenue Million Forecast, by End-User 2019 & 2032
- Table 5: Global Thalassemia Treatment Industry Revenue Million Forecast, by Region 2019 & 2032
- Table 6: Global Thalassemia Treatment Industry Revenue Million Forecast, by Country 2019 & 2032
- Table 7: United States Thalassemia Treatment Industry Revenue (Million) Forecast, by Application 2019 & 2032
- Table 8: Canada Thalassemia Treatment Industry Revenue (Million) Forecast, by Application 2019 & 2032
- Table 9: Mexico Thalassemia Treatment Industry Revenue (Million) Forecast, by Application 2019 & 2032
- Table 10: Global Thalassemia Treatment Industry Revenue Million Forecast, by Country 2019 & 2032
- Table 11: Germany Thalassemia Treatment Industry Revenue (Million) Forecast, by Application 2019 & 2032
- Table 12: United Kingdom Thalassemia Treatment Industry Revenue (Million) Forecast, by Application 2019 & 2032
- Table 13: France Thalassemia Treatment Industry Revenue (Million) Forecast, by Application 2019 & 2032
- Table 14: Italy Thalassemia Treatment Industry Revenue (Million) Forecast, by Application 2019 & 2032
- Table 15: Spain Thalassemia Treatment Industry Revenue (Million) Forecast, by Application 2019 & 2032
- Table 16: Rest of Europe Thalassemia Treatment Industry Revenue (Million) Forecast, by Application 2019 & 2032
- Table 17: Global Thalassemia Treatment Industry Revenue Million Forecast, by Country 2019 & 2032
- Table 18: China Thalassemia Treatment Industry Revenue (Million) Forecast, by Application 2019 & 2032
- Table 19: Japan Thalassemia Treatment Industry Revenue (Million) Forecast, by Application 2019 & 2032
- Table 20: India Thalassemia Treatment Industry Revenue (Million) Forecast, by Application 2019 & 2032
- Table 21: Australia Thalassemia Treatment Industry Revenue (Million) Forecast, by Application 2019 & 2032
- Table 22: South Korea Thalassemia Treatment Industry Revenue (Million) Forecast, by Application 2019 & 2032
- Table 23: Rest of Asia Pacific Thalassemia Treatment Industry Revenue (Million) Forecast, by Application 2019 & 2032
- Table 24: Global Thalassemia Treatment Industry Revenue Million Forecast, by Country 2019 & 2032
- Table 25: GCC Thalassemia Treatment Industry Revenue (Million) Forecast, by Application 2019 & 2032
- Table 26: South Africa Thalassemia Treatment Industry Revenue (Million) Forecast, by Application 2019 & 2032
- Table 27: Rest of Middle East and Africa Thalassemia Treatment Industry Revenue (Million) Forecast, by Application 2019 & 2032
- Table 28: Global Thalassemia Treatment Industry Revenue Million Forecast, by Country 2019 & 2032
- Table 29: Brazil Thalassemia Treatment Industry Revenue (Million) Forecast, by Application 2019 & 2032
- Table 30: Argentina Thalassemia Treatment Industry Revenue (Million) Forecast, by Application 2019 & 2032
- Table 31: Rest of South America Thalassemia Treatment Industry Revenue (Million) Forecast, by Application 2019 & 2032
- Table 32: Global Thalassemia Treatment Industry Revenue Million Forecast, by Treatment Type 2019 & 2032
- Table 33: Global Thalassemia Treatment Industry Revenue Million Forecast, by Disease Type 2019 & 2032
- Table 34: Global Thalassemia Treatment Industry Revenue Million Forecast, by End-User 2019 & 2032
- Table 35: Global Thalassemia Treatment Industry Revenue Million Forecast, by Country 2019 & 2032
- Table 36: United States Thalassemia Treatment Industry Revenue (Million) Forecast, by Application 2019 & 2032
- Table 37: Canada Thalassemia Treatment Industry Revenue (Million) Forecast, by Application 2019 & 2032
- Table 38: Mexico Thalassemia Treatment Industry Revenue (Million) Forecast, by Application 2019 & 2032
- Table 39: Global Thalassemia Treatment Industry Revenue Million Forecast, by Treatment Type 2019 & 2032
- Table 40: Global Thalassemia Treatment Industry Revenue Million Forecast, by Disease Type 2019 & 2032
- Table 41: Global Thalassemia Treatment Industry Revenue Million Forecast, by End-User 2019 & 2032
- Table 42: Global Thalassemia Treatment Industry Revenue Million Forecast, by Country 2019 & 2032
- Table 43: Germany Thalassemia Treatment Industry Revenue (Million) Forecast, by Application 2019 & 2032
- Table 44: United Kingdom Thalassemia Treatment Industry Revenue (Million) Forecast, by Application 2019 & 2032
- Table 45: France Thalassemia Treatment Industry Revenue (Million) Forecast, by Application 2019 & 2032
- Table 46: Italy Thalassemia Treatment Industry Revenue (Million) Forecast, by Application 2019 & 2032
- Table 47: Spain Thalassemia Treatment Industry Revenue (Million) Forecast, by Application 2019 & 2032
- Table 48: Rest of Europe Thalassemia Treatment Industry Revenue (Million) Forecast, by Application 2019 & 2032
- Table 49: Global Thalassemia Treatment Industry Revenue Million Forecast, by Treatment Type 2019 & 2032
- Table 50: Global Thalassemia Treatment Industry Revenue Million Forecast, by Disease Type 2019 & 2032
- Table 51: Global Thalassemia Treatment Industry Revenue Million Forecast, by End-User 2019 & 2032
- Table 52: Global Thalassemia Treatment Industry Revenue Million Forecast, by Country 2019 & 2032
- Table 53: China Thalassemia Treatment Industry Revenue (Million) Forecast, by Application 2019 & 2032
- Table 54: Japan Thalassemia Treatment Industry Revenue (Million) Forecast, by Application 2019 & 2032
- Table 55: India Thalassemia Treatment Industry Revenue (Million) Forecast, by Application 2019 & 2032
- Table 56: Australia Thalassemia Treatment Industry Revenue (Million) Forecast, by Application 2019 & 2032
- Table 57: South Korea Thalassemia Treatment Industry Revenue (Million) Forecast, by Application 2019 & 2032
- Table 58: Rest of Asia Pacific Thalassemia Treatment Industry Revenue (Million) Forecast, by Application 2019 & 2032
- Table 59: Global Thalassemia Treatment Industry Revenue Million Forecast, by Treatment Type 2019 & 2032
- Table 60: Global Thalassemia Treatment Industry Revenue Million Forecast, by Disease Type 2019 & 2032
- Table 61: Global Thalassemia Treatment Industry Revenue Million Forecast, by End-User 2019 & 2032
- Table 62: Global Thalassemia Treatment Industry Revenue Million Forecast, by Country 2019 & 2032
- Table 63: GCC Thalassemia Treatment Industry Revenue (Million) Forecast, by Application 2019 & 2032
- Table 64: South Africa Thalassemia Treatment Industry Revenue (Million) Forecast, by Application 2019 & 2032
- Table 65: Rest of Middle East and Africa Thalassemia Treatment Industry Revenue (Million) Forecast, by Application 2019 & 2032
- Table 66: Global Thalassemia Treatment Industry Revenue Million Forecast, by Treatment Type 2019 & 2032
- Table 67: Global Thalassemia Treatment Industry Revenue Million Forecast, by Disease Type 2019 & 2032
- Table 68: Global Thalassemia Treatment Industry Revenue Million Forecast, by End-User 2019 & 2032
- Table 69: Global Thalassemia Treatment Industry Revenue Million Forecast, by Country 2019 & 2032
- Table 70: Brazil Thalassemia Treatment Industry Revenue (Million) Forecast, by Application 2019 & 2032
- Table 71: Argentina Thalassemia Treatment Industry Revenue (Million) Forecast, by Application 2019 & 2032
- Table 72: Rest of South America Thalassemia Treatment Industry Revenue (Million) Forecast, by Application 2019 & 2032
Frequently Asked Questions
1. What is the projected Compound Annual Growth Rate (CAGR) of the Thalassemia Treatment Industry?
The projected CAGR is approximately 7.60%.
2. Which companies are prominent players in the Thalassemia Treatment Industry?
Key companies in the market include Bluebird Bio, Novartis AG, Kiadis Pharma, SG Phrma Pvt Lmt *List Not Exhaustive, Acceleron Pharma Inc, Bellicum Pharmaceuticals, ApoPharma Inc, IONIS Pharmaceuticals, Pfizer Inc.
3. What are the main segments of the Thalassemia Treatment Industry?
The market segments include Treatment Type, Disease Type, End-User.
4. Can you provide details about the market size?
The market size is estimated to be USD XX Million as of 2022.
5. What are some drivers contributing to market growth?
; Rising Prevalence of Thalassemia; Increasing Awareness of Thalassemia Treatment.
6. What are the notable trends driving market growth?
Chelation Therapy segment is expected to be the Fastest Growing Segment.
7. Are there any restraints impacting market growth?
; High Cost of Treatment.
8. Can you provide examples of recent developments in the market?
N/A
9. What pricing options are available for accessing the report?
Pricing options include single-user, multi-user, and enterprise licenses priced at USD 4750, USD 5250, and USD 8750 respectively.
10. Is the market size provided in terms of value or volume?
The market size is provided in terms of value, measured in Million.
11. Are there any specific market keywords associated with the report?
Yes, the market keyword associated with the report is "Thalassemia Treatment Industry," which aids in identifying and referencing the specific market segment covered.
12. How do I determine which pricing option suits my needs best?
The pricing options vary based on user requirements and access needs. Individual users may opt for single-user licenses, while businesses requiring broader access may choose multi-user or enterprise licenses for cost-effective access to the report.
13. Are there any additional resources or data provided in the Thalassemia Treatment Industry report?
While the report offers comprehensive insights, it's advisable to review the specific contents or supplementary materials provided to ascertain if additional resources or data are available.
14. How can I stay updated on further developments or reports in the Thalassemia Treatment Industry?
To stay informed about further developments, trends, and reports in the Thalassemia Treatment Industry, consider subscribing to industry newsletters, following relevant companies and organizations, or regularly checking reputable industry news sources and publications.
Methodology
Step 1 - Identification of Relevant Samples Size from Population Database


Step 2 - Approaches for Defining Global Market Size (Value, Volume* & Price*)

Note*: In applicable scenarios
Step 3 - Data Sources
Primary Research
- Web Analytics
- Survey Reports
- Research Institute
- Latest Research Reports
- Opinion Leaders
Secondary Research
- Annual Reports
- White Paper
- Latest Press Release
- Industry Association
- Paid Database
- Investor Presentations

Step 4 - Data Triangulation
Involves using different sources of information in order to increase the validity of a study
These sources are likely to be stakeholders in a program - participants, other researchers, program staff, other community members, and so on.
Then we put all data in single framework & apply various statistical tools to find out the dynamic on the market.
During the analysis stage, feedback from the stakeholder groups would be compared to determine areas of agreement as well as areas of divergence
