

Key Insights
The global Tall Oil Fatty Acid (TOFA) market, currently valued at $4.82 million, is poised for significant expansion, projecting a Compound Annual Growth Rate (CAGR) of 4.66% from 2025 to 2033. This robust growth trajectory is fueled by the increasing demand for sustainable and cost-effective chemical inputs across diverse industrial sectors, including soaps and detergents, paints and coatings, and the automotive industry. The growing consumer preference for bio-based products, driven by environmental consciousness, is a key market accelerant. Furthermore, the expanding applications of TOFA in alkyd resins, dimer acids, and fatty acid esters, owing to their superior performance and cost-effectiveness compared to petrochemical alternatives, are expected to drive sustained market demand. Emerging economies, particularly in the Asia-Pacific region, present substantial opportunities for market penetration and growth. Key challenges include potential fluctuations in raw material pricing and competition from synthetic fatty acid alternatives.
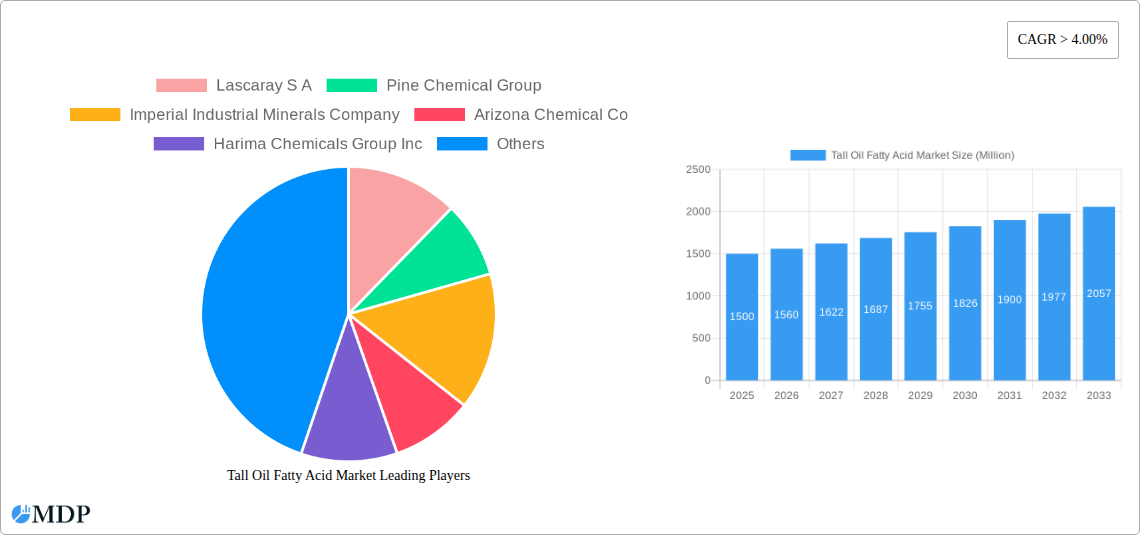
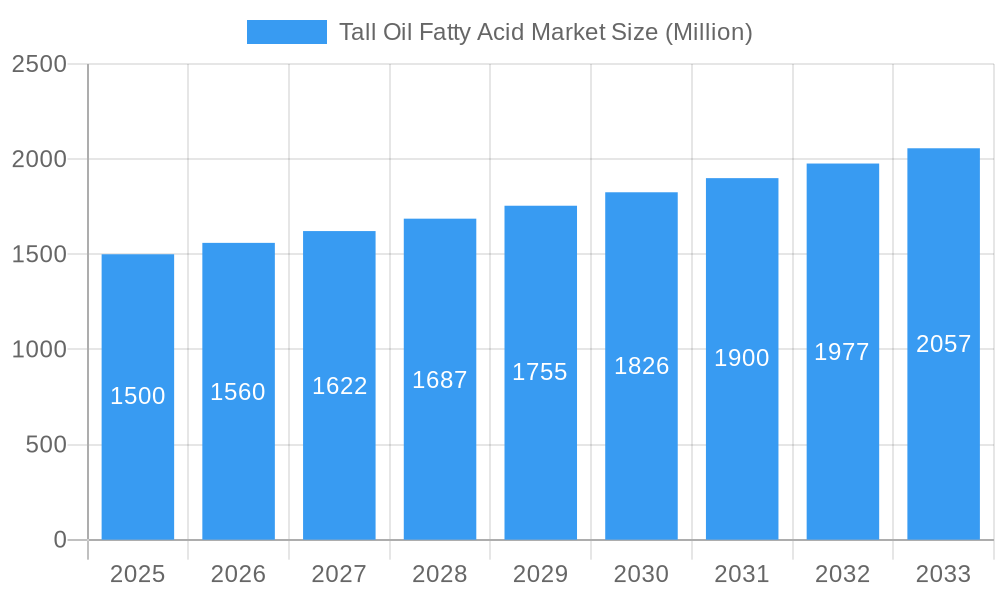
Tall Oil Fatty Acid Market Market Size (In Million)
Market segmentation indicates strong demand across various TOFA product types, with oleic acid, linoleic acid, and palmitic acid emerging as leading segments. In terms of applications, alkyd resins and dimer acids are prominent, reflecting their widespread adoption in numerous end-user industries. While North America and Europe currently dominate market share, the Asia-Pacific region is anticipated to experience the most substantial growth during the forecast period, propelled by escalating industrialization and burgeoning demand from key sectors such as paints and coatings in China and India. Leading TOFA market participants, including Lascaray S.A., Pine Chemical Group, and Eastman Chemical Company, are actively pursuing strategic collaborations, product portfolio expansion, and geographic diversification to leverage the favorable market outlook. The sustained emphasis on sustainable and renewable material solutions will continue to be a primary driver for the TOFA market's future expansion.
Tall Oil Fatty Acid Market Company Market Share
Deep Dive into the Tall Oil Fatty Acid Market: A Comprehensive Report (2019-2033)
This comprehensive report provides an in-depth analysis of the Tall Oil Fatty Acid (TOFA) market, offering invaluable insights for stakeholders across the value chain. Spanning the period 2019-2033, with a focus on 2025, this report unveils market dynamics, key trends, leading players, and future opportunities in this dynamic sector. The study meticulously examines market segmentation by product type (Oleic Acid, Linoleic Acid, Linolenic Acid, Palmitic Acid, Other Product Types), application (Alkyd Resins, Dimer Acids, Fatty Acid Ester, Other Applications), and end-user industry (Soaps and Detergents, Paints and Coatings, Automotive, Metal Working Fluids, Oil and Gas, Other End-user Industries).
Tall Oil Fatty Acid Market Market Dynamics & Concentration
The Tall Oil Fatty Acid market exhibits a moderately concentrated landscape, with key players holding significant market share. Market concentration is influenced by factors such as economies of scale in production, technological advancements, and the presence of established players with extensive distribution networks. Innovation is a crucial driver, with ongoing research and development efforts focused on enhancing product performance, expanding applications, and improving sustainability. Regulatory frameworks, including environmental regulations concerning the use of bio-based chemicals, are also shaping market dynamics. Product substitutes, such as synthetic fatty acids, pose a competitive challenge, impacting market share. However, the growing demand for sustainable and renewable materials is creating a favourable environment for TOFA. M&A activity has been relatively moderate in recent years, with approximately xx deals recorded between 2019 and 2024, resulting in a xx% market share shift among the top 5 players. Future M&A activities are expected to be driven by the need for expansion into new markets and access to innovative technologies.
- Market Concentration: Moderately concentrated, with top 5 players holding approximately xx% of the market share in 2024.
- Innovation Drivers: R&D focused on improved performance, new applications, and sustainability.
- Regulatory Landscape: Stringent environmental regulations influencing market growth.
- Product Substitutes: Synthetic fatty acids present a competitive challenge.
- M&A Activity: Approximately xx deals between 2019 and 2024, leading to a xx% market share shift.
Tall Oil Fatty Acid Market Industry Trends & Analysis
The global Tall Oil Fatty Acid market is experiencing robust growth, driven by increasing demand from key end-use sectors such as paints and coatings, soaps and detergents, and bio-based plastics. The market is projected to witness a CAGR of xx% during the forecast period (2025-2033), reaching a value of xx Million by 2033. Technological advancements in refining processes are leading to higher-quality TOFA with enhanced performance characteristics. The growing consumer preference for eco-friendly and sustainable products is further bolstering market growth. However, fluctuations in raw material prices and competition from synthetic alternatives present challenges. Market penetration in emerging economies is increasing, driven by rising disposable incomes and urbanization. The competitive landscape is characterized by both established players and emerging companies, resulting in intense competition and strategic alliances.
Leading Markets & Segments in Tall Oil Fatty Acid Market
The North American region currently dominates the Tall Oil Fatty Acid market, accounting for approximately xx% of the global market share in 2024. This dominance is attributed to the robust presence of major players, well-established infrastructure, and high demand from key end-user industries. Among the product types, Oleic Acid holds the largest market share, driven by its versatility and wide-ranging applications. In terms of applications, Alkyd Resins and Dimer Acids are the major segments, owing to their importance in the paints and coatings and polymer industries respectively. Within end-user industries, the paints and coatings sector is the dominant user of TOFA, representing approximately xx% of the total consumption.
- Key Drivers in North America: Strong presence of major players, well-developed infrastructure, high demand from end-use sectors.
- Oleic Acid Dominance: Versatile applications and widespread usage across various industries.
- Alkyd Resins & Dimer Acids: Leading application segments due to their usage in paints & coatings and polymers.
- Paints & Coatings: Dominant end-user sector, accounting for a significant portion of TOFA consumption.
Tall Oil Fatty Acid Market Product Developments
Recent product developments in the TOFA market focus on enhancing the functionality and sustainability of the product. Innovations include the development of specialized TOFA blends with improved performance characteristics tailored to specific applications. Companies are also investing in sustainable production methods to reduce their environmental footprint, enhancing the market appeal of TOFA as a bio-based alternative to synthetic fatty acids. These developments are contributing to increased market penetration and broader acceptance across diverse industries.
Key Drivers of Tall Oil Fatty Acid Market Growth
The growth of the Tall Oil Fatty Acid market is primarily driven by several factors. The increasing demand for bio-based and renewable materials is a major catalyst, fueled by growing environmental concerns and stringent regulations. The expanding applications of TOFA in various industries, particularly in the paints and coatings sector, are also significant contributors to market growth. Furthermore, technological advancements in production and refining processes are resulting in higher-quality TOFA with improved performance characteristics. Favorable government policies promoting sustainable and renewable materials are providing further impetus to market expansion.
Challenges in the Tall Oil Oil Fatty Acid Market Market
The Tall Oil Fatty Acid market faces several challenges, including fluctuations in raw material prices, which directly impact production costs and profitability. The presence of substitute products, such as synthetic fatty acids, also creates competitive pressure. Supply chain disruptions and logistics issues can negatively impact market stability. Finally, stringent environmental regulations need to be navigated effectively, potentially increasing compliance costs for producers.
Emerging Opportunities in Tall Oil Fatty Acid Market
The Tall Oil Fatty Acid market presents substantial long-term growth potential, driven by continuous advancements in production technology leading to enhanced product quality and efficiency. Strategic partnerships and collaborations between manufacturers and end-users are creating new market opportunities. Expansion into emerging economies with growing demand for bio-based materials is creating further growth avenues. Government initiatives supporting renewable resource utilization offer additional impetus to market expansion.
Leading Players in the Tall Oil Fatty Acid Market Sector
- Lascaray S A
- Pine Chemical Group
- Imperial Industrial Minerals Company
- Arizona Chemical Co
- Harima Chemicals Group Inc
- Eastman Chemical Company
- Ingevity
- Segezha-Group
- Forchem Oyj
- Ilim Group
- KRATON CORPORATION
- UNIVAR SOLUTIONS
- Shaxian Lixin Resin Co Ltd
- Foreverest Resources Ltd
- Pasand Speciality Chemicals
- Ataman Kimya
- G C Rutteman & Co B V
Key Milestones in Tall Oil Fatty Acid Market Industry
- 2020: Increased focus on sustainable production practices by major players.
- 2021: Launch of a new, high-performance TOFA blend by [Company Name].
- 2022: Significant investment in R&D for enhanced TOFA applications.
- 2023: Acquisition of [Company A] by [Company B], expanding market reach.
- 2024: Introduction of new environmental regulations impacting TOFA production.
Strategic Outlook for Tall Oil Fatty Acid Market Market
The Tall Oil Fatty Acid market is poised for sustained growth, driven by the increasing demand for bio-based alternatives and technological advancements enhancing product performance. Strategic partnerships, focus on sustainable production practices, and expansion into new applications will be key to success in this competitive landscape. Companies that invest in R&D and adopt innovative manufacturing processes will be well-positioned to capitalize on emerging opportunities. The market's future trajectory is significantly influenced by the growing need for environmentally friendly materials and the ongoing development of new technologies.
Tall Oil Fatty Acid Market Segmentation
-
1. Product Type
- 1.1. Oleic Acid
- 1.2. Linoleic Acid
- 1.3. Linolenic Acid
- 1.4. Palmitic Acid
- 1.5. Other Product Types
-
2. Application
- 2.1. Alkyd Resins
- 2.2. Dimer Acids
- 2.3. Fatty Acid Ester
- 2.4. Other Applications
-
3. End-user Industry
- 3.1. Soaps and Detergents
- 3.2. Paints and Coatings
- 3.3. Automotive
- 3.4. Metal Working Fluids
- 3.5. Oil and Gas
- 3.6. Other End-user Industries
Tall Oil Fatty Acid Market Segmentation By Geography
-
1. Asia Pacific
- 1.1. China
- 1.2. India
- 1.3. Japan
- 1.4. South Korea
- 1.5. Rest of Asia Pacific
-
2. North America
- 2.1. United States
- 2.2. Canada
- 2.3. Mexico
-
3. Europe
- 3.1. Germany
- 3.2. United Kingdom
- 3.3. Italy
- 3.4. France
- 3.5. Rest of Europe
-
4. South America
- 4.1. Brazil
- 4.2. Argentina
- 4.3. Rest of South America
-
5. Middle East and Africa
- 5.1. Saudi Arabia
- 5.2. South Africa
- 5.3. Rest of Middle East and Africa
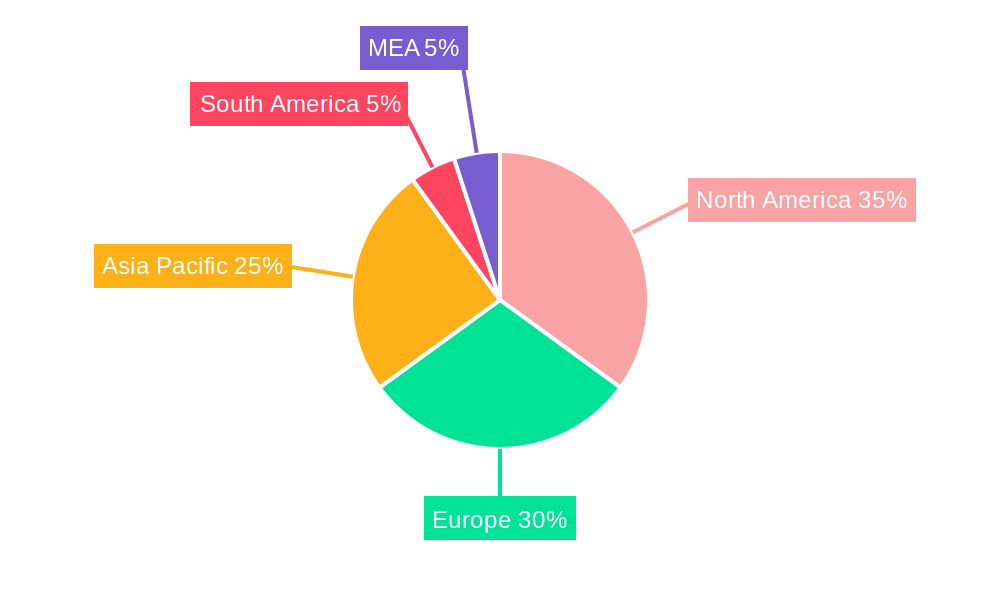
Tall Oil Fatty Acid Market Regional Market Share
Geographic Coverage of Tall Oil Fatty Acid Market
Tall Oil Fatty Acid Market REPORT HIGHLIGHTS
| Aspects | Details |
|---|---|
| Study Period | 2020-2034 |
| Base Year | 2025 |
| Estimated Year | 2026 |
| Forecast Period | 2026-2034 |
| Historical Period | 2020-2025 |
| Growth Rate | CAGR of 4.66% from 2020-2034 |
| Segmentation |
|
Table of Contents
- 1. Introduction
- 1.1. Research Scope
- 1.2. Market Segmentation
- 1.3. Research Objective
- 1.4. Definitions and Assumptions
- 2. Executive Summary
- 2.1. Market Snapshot
- 3. Market Dynamics
- 3.1. Market Drivers
- 3.2. Market Restrains
- 3.3. Market Trends
- 3.4. Market Opportunities
- 4. Market Factor Analysis
- 4.1. Porters Five Forces
- 4.1.1. Bargaining Power of Suppliers
- 4.1.2. Bargaining Power of Buyers
- 4.1.3. Threat of New Entrants
- 4.1.4. Threat of Substitutes
- 4.1.5. Competitive Rivalry
- 4.2. PESTEL analysis
- 4.3. BCG Analysis
- 4.3.1. Stars (High Growth, High Market Share)
- 4.3.2. Cash Cows (Low Growth, High Market Share)
- 4.3.3. Question Mark (High Growth, Low Market Share)
- 4.3.4. Dogs (Low Growth, Low Market Share)
- 4.4. Ansoff Matrix Analysis
- 4.5. Supply Chain Analysis
- 4.6. Regulatory Landscape
- 4.7. Current Market Potential and Opportunity Assessment (TAM–SAM–SOM Framework)
- 4.8. MDP Analyst Note
- 4.1. Porters Five Forces
- 5. Market Analysis, Insights and Forecast 2021-2033
- 5.1. Market Analysis, Insights and Forecast - by Product Type
- 5.1.1. Oleic Acid
- 5.1.2. Linoleic Acid
- 5.1.3. Linolenic Acid
- 5.1.4. Palmitic Acid
- 5.1.5. Other Product Types
- 5.2. Market Analysis, Insights and Forecast - by Application
- 5.2.1. Alkyd Resins
- 5.2.2. Dimer Acids
- 5.2.3. Fatty Acid Ester
- 5.2.4. Other Applications
- 5.3. Market Analysis, Insights and Forecast - by End-user Industry
- 5.3.1. Soaps and Detergents
- 5.3.2. Paints and Coatings
- 5.3.3. Automotive
- 5.3.4. Metal Working Fluids
- 5.3.5. Oil and Gas
- 5.3.6. Other End-user Industries
- 5.4. Market Analysis, Insights and Forecast - by Region
- 5.4.1. Asia Pacific
- 5.4.2. North America
- 5.4.3. Europe
- 5.4.4. South America
- 5.4.5. Middle East and Africa
- 5.1. Market Analysis, Insights and Forecast - by Product Type
- 6. Global Tall Oil Fatty Acid Market Analysis, Insights and Forecast, 2021-2033
- 6.1. Market Analysis, Insights and Forecast - by Product Type
- 6.1.1. Oleic Acid
- 6.1.2. Linoleic Acid
- 6.1.3. Linolenic Acid
- 6.1.4. Palmitic Acid
- 6.1.5. Other Product Types
- 6.2. Market Analysis, Insights and Forecast - by Application
- 6.2.1. Alkyd Resins
- 6.2.2. Dimer Acids
- 6.2.3. Fatty Acid Ester
- 6.2.4. Other Applications
- 6.3. Market Analysis, Insights and Forecast - by End-user Industry
- 6.3.1. Soaps and Detergents
- 6.3.2. Paints and Coatings
- 6.3.3. Automotive
- 6.3.4. Metal Working Fluids
- 6.3.5. Oil and Gas
- 6.3.6. Other End-user Industries
- 6.1. Market Analysis, Insights and Forecast - by Product Type
- 7. Asia Pacific Tall Oil Fatty Acid Market Analysis, Insights and Forecast, 2020-2032
- 7.1. Market Analysis, Insights and Forecast - by Product Type
- 7.1.1. Oleic Acid
- 7.1.2. Linoleic Acid
- 7.1.3. Linolenic Acid
- 7.1.4. Palmitic Acid
- 7.1.5. Other Product Types
- 7.2. Market Analysis, Insights and Forecast - by Application
- 7.2.1. Alkyd Resins
- 7.2.2. Dimer Acids
- 7.2.3. Fatty Acid Ester
- 7.2.4. Other Applications
- 7.3. Market Analysis, Insights and Forecast - by End-user Industry
- 7.3.1. Soaps and Detergents
- 7.3.2. Paints and Coatings
- 7.3.3. Automotive
- 7.3.4. Metal Working Fluids
- 7.3.5. Oil and Gas
- 7.3.6. Other End-user Industries
- 7.1. Market Analysis, Insights and Forecast - by Product Type
- 8. North America Tall Oil Fatty Acid Market Analysis, Insights and Forecast, 2020-2032
- 8.1. Market Analysis, Insights and Forecast - by Product Type
- 8.1.1. Oleic Acid
- 8.1.2. Linoleic Acid
- 8.1.3. Linolenic Acid
- 8.1.4. Palmitic Acid
- 8.1.5. Other Product Types
- 8.2. Market Analysis, Insights and Forecast - by Application
- 8.2.1. Alkyd Resins
- 8.2.2. Dimer Acids
- 8.2.3. Fatty Acid Ester
- 8.2.4. Other Applications
- 8.3. Market Analysis, Insights and Forecast - by End-user Industry
- 8.3.1. Soaps and Detergents
- 8.3.2. Paints and Coatings
- 8.3.3. Automotive
- 8.3.4. Metal Working Fluids
- 8.3.5. Oil and Gas
- 8.3.6. Other End-user Industries
- 8.1. Market Analysis, Insights and Forecast - by Product Type
- 9. Europe Tall Oil Fatty Acid Market Analysis, Insights and Forecast, 2020-2032
- 9.1. Market Analysis, Insights and Forecast - by Product Type
- 9.1.1. Oleic Acid
- 9.1.2. Linoleic Acid
- 9.1.3. Linolenic Acid
- 9.1.4. Palmitic Acid
- 9.1.5. Other Product Types
- 9.2. Market Analysis, Insights and Forecast - by Application
- 9.2.1. Alkyd Resins
- 9.2.2. Dimer Acids
- 9.2.3. Fatty Acid Ester
- 9.2.4. Other Applications
- 9.3. Market Analysis, Insights and Forecast - by End-user Industry
- 9.3.1. Soaps and Detergents
- 9.3.2. Paints and Coatings
- 9.3.3. Automotive
- 9.3.4. Metal Working Fluids
- 9.3.5. Oil and Gas
- 9.3.6. Other End-user Industries
- 9.1. Market Analysis, Insights and Forecast - by Product Type
- 10. South America Tall Oil Fatty Acid Market Analysis, Insights and Forecast, 2020-2032
- 10.1. Market Analysis, Insights and Forecast - by Product Type
- 10.1.1. Oleic Acid
- 10.1.2. Linoleic Acid
- 10.1.3. Linolenic Acid
- 10.1.4. Palmitic Acid
- 10.1.5. Other Product Types
- 10.2. Market Analysis, Insights and Forecast - by Application
- 10.2.1. Alkyd Resins
- 10.2.2. Dimer Acids
- 10.2.3. Fatty Acid Ester
- 10.2.4. Other Applications
- 10.3. Market Analysis, Insights and Forecast - by End-user Industry
- 10.3.1. Soaps and Detergents
- 10.3.2. Paints and Coatings
- 10.3.3. Automotive
- 10.3.4. Metal Working Fluids
- 10.3.5. Oil and Gas
- 10.3.6. Other End-user Industries
- 10.1. Market Analysis, Insights and Forecast - by Product Type
- 11. Middle East and Africa Tall Oil Fatty Acid Market Analysis, Insights and Forecast, 2020-2032
- 11.1. Market Analysis, Insights and Forecast - by Product Type
- 11.1.1. Oleic Acid
- 11.1.2. Linoleic Acid
- 11.1.3. Linolenic Acid
- 11.1.4. Palmitic Acid
- 11.1.5. Other Product Types
- 11.2. Market Analysis, Insights and Forecast - by Application
- 11.2.1. Alkyd Resins
- 11.2.2. Dimer Acids
- 11.2.3. Fatty Acid Ester
- 11.2.4. Other Applications
- 11.3. Market Analysis, Insights and Forecast - by End-user Industry
- 11.3.1. Soaps and Detergents
- 11.3.2. Paints and Coatings
- 11.3.3. Automotive
- 11.3.4. Metal Working Fluids
- 11.3.5. Oil and Gas
- 11.3.6. Other End-user Industries
- 11.1. Market Analysis, Insights and Forecast - by Product Type
- 12. Competitive Analysis
- 12.1. Company Profiles
- 12.1.1 Lascaray S A
- 12.1.1.1. Company Overview
- 12.1.1.2. Products
- 12.1.1.3. Company Financials
- 12.1.1.4. SWOT Analysis
- 12.1.2 Pine Chemical Group
- 12.1.2.1. Company Overview
- 12.1.2.2. Products
- 12.1.2.3. Company Financials
- 12.1.2.4. SWOT Analysis
- 12.1.3 Imperial Industrial Minerals Company
- 12.1.3.1. Company Overview
- 12.1.3.2. Products
- 12.1.3.3. Company Financials
- 12.1.3.4. SWOT Analysis
- 12.1.4 Arizona Chemical Co
- 12.1.4.1. Company Overview
- 12.1.4.2. Products
- 12.1.4.3. Company Financials
- 12.1.4.4. SWOT Analysis
- 12.1.5 Harima Chemicals Group Inc
- 12.1.5.1. Company Overview
- 12.1.5.2. Products
- 12.1.5.3. Company Financials
- 12.1.5.4. SWOT Analysis
- 12.1.6 Eastman Chemical Company
- 12.1.6.1. Company Overview
- 12.1.6.2. Products
- 12.1.6.3. Company Financials
- 12.1.6.4. SWOT Analysis
- 12.1.7 Ingevity
- 12.1.7.1. Company Overview
- 12.1.7.2. Products
- 12.1.7.3. Company Financials
- 12.1.7.4. SWOT Analysis
- 12.1.8 Segezha-Group
- 12.1.8.1. Company Overview
- 12.1.8.2. Products
- 12.1.8.3. Company Financials
- 12.1.8.4. SWOT Analysis
- 12.1.9 Forchem Oyj
- 12.1.9.1. Company Overview
- 12.1.9.2. Products
- 12.1.9.3. Company Financials
- 12.1.9.4. SWOT Analysis
- 12.1.10 Ilim Group
- 12.1.10.1. Company Overview
- 12.1.10.2. Products
- 12.1.10.3. Company Financials
- 12.1.10.4. SWOT Analysis
- 12.1.11 KRATON CORPORATION
- 12.1.11.1. Company Overview
- 12.1.11.2. Products
- 12.1.11.3. Company Financials
- 12.1.11.4. SWOT Analysis
- 12.1.12 UNIVAR SOLUTIONS
- 12.1.12.1. Company Overview
- 12.1.12.2. Products
- 12.1.12.3. Company Financials
- 12.1.12.4. SWOT Analysis
- 12.1.13 Shaxian Lixin Resin Co Ltd
- 12.1.13.1. Company Overview
- 12.1.13.2. Products
- 12.1.13.3. Company Financials
- 12.1.13.4. SWOT Analysis
- 12.1.14 Foreverest Resources Ltd
- 12.1.14.1. Company Overview
- 12.1.14.2. Products
- 12.1.14.3. Company Financials
- 12.1.14.4. SWOT Analysis
- 12.1.15 Pasand Speciality Chemicals
- 12.1.15.1. Company Overview
- 12.1.15.2. Products
- 12.1.15.3. Company Financials
- 12.1.15.4. SWOT Analysis
- 12.1.16 Ataman Kimya
- 12.1.16.1. Company Overview
- 12.1.16.2. Products
- 12.1.16.3. Company Financials
- 12.1.16.4. SWOT Analysis
- 12.1.17 G C Rutteman & Co B V
- 12.1.17.1. Company Overview
- 12.1.17.2. Products
- 12.1.17.3. Company Financials
- 12.1.17.4. SWOT Analysis
- 12.1.1 Lascaray S A
- 12.2. Market Entropy
- 12.2.1 Company's Key Areas Served
- 12.2.2 Recent Developments
- 12.3. Company Market Share Analysis 2025
- 12.3.1 Top 5 Companies Market Share Analysis
- 12.3.2 Top 3 Companies Market Share Analysis
- 12.4. List of Potential Customers
- 13. Research Methodology
List of Figures
- Figure 1: Global Tall Oil Fatty Acid Market Revenue Breakdown (million, %) by Region 2025 & 2033
- Figure 2: Global Tall Oil Fatty Acid Market Volume Breakdown (K Tons, %) by Region 2025 & 2033
- Figure 3: Asia Pacific Tall Oil Fatty Acid Market Revenue (million), by Product Type 2025 & 2033
- Figure 4: Asia Pacific Tall Oil Fatty Acid Market Volume (K Tons), by Product Type 2025 & 2033
- Figure 5: Asia Pacific Tall Oil Fatty Acid Market Revenue Share (%), by Product Type 2025 & 2033
- Figure 6: Asia Pacific Tall Oil Fatty Acid Market Volume Share (%), by Product Type 2025 & 2033
- Figure 7: Asia Pacific Tall Oil Fatty Acid Market Revenue (million), by Application 2025 & 2033
- Figure 8: Asia Pacific Tall Oil Fatty Acid Market Volume (K Tons), by Application 2025 & 2033
- Figure 9: Asia Pacific Tall Oil Fatty Acid Market Revenue Share (%), by Application 2025 & 2033
- Figure 10: Asia Pacific Tall Oil Fatty Acid Market Volume Share (%), by Application 2025 & 2033
- Figure 11: Asia Pacific Tall Oil Fatty Acid Market Revenue (million), by End-user Industry 2025 & 2033
- Figure 12: Asia Pacific Tall Oil Fatty Acid Market Volume (K Tons), by End-user Industry 2025 & 2033
- Figure 13: Asia Pacific Tall Oil Fatty Acid Market Revenue Share (%), by End-user Industry 2025 & 2033
- Figure 14: Asia Pacific Tall Oil Fatty Acid Market Volume Share (%), by End-user Industry 2025 & 2033
- Figure 15: Asia Pacific Tall Oil Fatty Acid Market Revenue (million), by Country 2025 & 2033
- Figure 16: Asia Pacific Tall Oil Fatty Acid Market Volume (K Tons), by Country 2025 & 2033
- Figure 17: Asia Pacific Tall Oil Fatty Acid Market Revenue Share (%), by Country 2025 & 2033
- Figure 18: Asia Pacific Tall Oil Fatty Acid Market Volume Share (%), by Country 2025 & 2033
- Figure 19: North America Tall Oil Fatty Acid Market Revenue (million), by Product Type 2025 & 2033
- Figure 20: North America Tall Oil Fatty Acid Market Volume (K Tons), by Product Type 2025 & 2033
- Figure 21: North America Tall Oil Fatty Acid Market Revenue Share (%), by Product Type 2025 & 2033
- Figure 22: North America Tall Oil Fatty Acid Market Volume Share (%), by Product Type 2025 & 2033
- Figure 23: North America Tall Oil Fatty Acid Market Revenue (million), by Application 2025 & 2033
- Figure 24: North America Tall Oil Fatty Acid Market Volume (K Tons), by Application 2025 & 2033
- Figure 25: North America Tall Oil Fatty Acid Market Revenue Share (%), by Application 2025 & 2033
- Figure 26: North America Tall Oil Fatty Acid Market Volume Share (%), by Application 2025 & 2033
- Figure 27: North America Tall Oil Fatty Acid Market Revenue (million), by End-user Industry 2025 & 2033
- Figure 28: North America Tall Oil Fatty Acid Market Volume (K Tons), by End-user Industry 2025 & 2033
- Figure 29: North America Tall Oil Fatty Acid Market Revenue Share (%), by End-user Industry 2025 & 2033
- Figure 30: North America Tall Oil Fatty Acid Market Volume Share (%), by End-user Industry 2025 & 2033
- Figure 31: North America Tall Oil Fatty Acid Market Revenue (million), by Country 2025 & 2033
- Figure 32: North America Tall Oil Fatty Acid Market Volume (K Tons), by Country 2025 & 2033
- Figure 33: North America Tall Oil Fatty Acid Market Revenue Share (%), by Country 2025 & 2033
- Figure 34: North America Tall Oil Fatty Acid Market Volume Share (%), by Country 2025 & 2033
- Figure 35: Europe Tall Oil Fatty Acid Market Revenue (million), by Product Type 2025 & 2033
- Figure 36: Europe Tall Oil Fatty Acid Market Volume (K Tons), by Product Type 2025 & 2033
- Figure 37: Europe Tall Oil Fatty Acid Market Revenue Share (%), by Product Type 2025 & 2033
- Figure 38: Europe Tall Oil Fatty Acid Market Volume Share (%), by Product Type 2025 & 2033
- Figure 39: Europe Tall Oil Fatty Acid Market Revenue (million), by Application 2025 & 2033
- Figure 40: Europe Tall Oil Fatty Acid Market Volume (K Tons), by Application 2025 & 2033
- Figure 41: Europe Tall Oil Fatty Acid Market Revenue Share (%), by Application 2025 & 2033
- Figure 42: Europe Tall Oil Fatty Acid Market Volume Share (%), by Application 2025 & 2033
- Figure 43: Europe Tall Oil Fatty Acid Market Revenue (million), by End-user Industry 2025 & 2033
- Figure 44: Europe Tall Oil Fatty Acid Market Volume (K Tons), by End-user Industry 2025 & 2033
- Figure 45: Europe Tall Oil Fatty Acid Market Revenue Share (%), by End-user Industry 2025 & 2033
- Figure 46: Europe Tall Oil Fatty Acid Market Volume Share (%), by End-user Industry 2025 & 2033
- Figure 47: Europe Tall Oil Fatty Acid Market Revenue (million), by Country 2025 & 2033
- Figure 48: Europe Tall Oil Fatty Acid Market Volume (K Tons), by Country 2025 & 2033
- Figure 49: Europe Tall Oil Fatty Acid Market Revenue Share (%), by Country 2025 & 2033
- Figure 50: Europe Tall Oil Fatty Acid Market Volume Share (%), by Country 2025 & 2033
- Figure 51: South America Tall Oil Fatty Acid Market Revenue (million), by Product Type 2025 & 2033
- Figure 52: South America Tall Oil Fatty Acid Market Volume (K Tons), by Product Type 2025 & 2033
- Figure 53: South America Tall Oil Fatty Acid Market Revenue Share (%), by Product Type 2025 & 2033
- Figure 54: South America Tall Oil Fatty Acid Market Volume Share (%), by Product Type 2025 & 2033
- Figure 55: South America Tall Oil Fatty Acid Market Revenue (million), by Application 2025 & 2033
- Figure 56: South America Tall Oil Fatty Acid Market Volume (K Tons), by Application 2025 & 2033
- Figure 57: South America Tall Oil Fatty Acid Market Revenue Share (%), by Application 2025 & 2033
- Figure 58: South America Tall Oil Fatty Acid Market Volume Share (%), by Application 2025 & 2033
- Figure 59: South America Tall Oil Fatty Acid Market Revenue (million), by End-user Industry 2025 & 2033
- Figure 60: South America Tall Oil Fatty Acid Market Volume (K Tons), by End-user Industry 2025 & 2033
- Figure 61: South America Tall Oil Fatty Acid Market Revenue Share (%), by End-user Industry 2025 & 2033
- Figure 62: South America Tall Oil Fatty Acid Market Volume Share (%), by End-user Industry 2025 & 2033
- Figure 63: South America Tall Oil Fatty Acid Market Revenue (million), by Country 2025 & 2033
- Figure 64: South America Tall Oil Fatty Acid Market Volume (K Tons), by Country 2025 & 2033
- Figure 65: South America Tall Oil Fatty Acid Market Revenue Share (%), by Country 2025 & 2033
- Figure 66: South America Tall Oil Fatty Acid Market Volume Share (%), by Country 2025 & 2033
- Figure 67: Middle East and Africa Tall Oil Fatty Acid Market Revenue (million), by Product Type 2025 & 2033
- Figure 68: Middle East and Africa Tall Oil Fatty Acid Market Volume (K Tons), by Product Type 2025 & 2033
- Figure 69: Middle East and Africa Tall Oil Fatty Acid Market Revenue Share (%), by Product Type 2025 & 2033
- Figure 70: Middle East and Africa Tall Oil Fatty Acid Market Volume Share (%), by Product Type 2025 & 2033
- Figure 71: Middle East and Africa Tall Oil Fatty Acid Market Revenue (million), by Application 2025 & 2033
- Figure 72: Middle East and Africa Tall Oil Fatty Acid Market Volume (K Tons), by Application 2025 & 2033
- Figure 73: Middle East and Africa Tall Oil Fatty Acid Market Revenue Share (%), by Application 2025 & 2033
- Figure 74: Middle East and Africa Tall Oil Fatty Acid Market Volume Share (%), by Application 2025 & 2033
- Figure 75: Middle East and Africa Tall Oil Fatty Acid Market Revenue (million), by End-user Industry 2025 & 2033
- Figure 76: Middle East and Africa Tall Oil Fatty Acid Market Volume (K Tons), by End-user Industry 2025 & 2033
- Figure 77: Middle East and Africa Tall Oil Fatty Acid Market Revenue Share (%), by End-user Industry 2025 & 2033
- Figure 78: Middle East and Africa Tall Oil Fatty Acid Market Volume Share (%), by End-user Industry 2025 & 2033
- Figure 79: Middle East and Africa Tall Oil Fatty Acid Market Revenue (million), by Country 2025 & 2033
- Figure 80: Middle East and Africa Tall Oil Fatty Acid Market Volume (K Tons), by Country 2025 & 2033
- Figure 81: Middle East and Africa Tall Oil Fatty Acid Market Revenue Share (%), by Country 2025 & 2033
- Figure 82: Middle East and Africa Tall Oil Fatty Acid Market Volume Share (%), by Country 2025 & 2033
List of Tables
- Table 1: Global Tall Oil Fatty Acid Market Revenue million Forecast, by Product Type 2020 & 2033
- Table 2: Global Tall Oil Fatty Acid Market Volume K Tons Forecast, by Product Type 2020 & 2033
- Table 3: Global Tall Oil Fatty Acid Market Revenue million Forecast, by Application 2020 & 2033
- Table 4: Global Tall Oil Fatty Acid Market Volume K Tons Forecast, by Application 2020 & 2033
- Table 5: Global Tall Oil Fatty Acid Market Revenue million Forecast, by End-user Industry 2020 & 2033
- Table 6: Global Tall Oil Fatty Acid Market Volume K Tons Forecast, by End-user Industry 2020 & 2033
- Table 7: Global Tall Oil Fatty Acid Market Revenue million Forecast, by Region 2020 & 2033
- Table 8: Global Tall Oil Fatty Acid Market Volume K Tons Forecast, by Region 2020 & 2033
- Table 9: Global Tall Oil Fatty Acid Market Revenue million Forecast, by Product Type 2020 & 2033
- Table 10: Global Tall Oil Fatty Acid Market Volume K Tons Forecast, by Product Type 2020 & 2033
- Table 11: Global Tall Oil Fatty Acid Market Revenue million Forecast, by Application 2020 & 2033
- Table 12: Global Tall Oil Fatty Acid Market Volume K Tons Forecast, by Application 2020 & 2033
- Table 13: Global Tall Oil Fatty Acid Market Revenue million Forecast, by End-user Industry 2020 & 2033
- Table 14: Global Tall Oil Fatty Acid Market Volume K Tons Forecast, by End-user Industry 2020 & 2033
- Table 15: Global Tall Oil Fatty Acid Market Revenue million Forecast, by Country 2020 & 2033
- Table 16: Global Tall Oil Fatty Acid Market Volume K Tons Forecast, by Country 2020 & 2033
- Table 17: China Tall Oil Fatty Acid Market Revenue (million) Forecast, by Application 2020 & 2033
- Table 18: China Tall Oil Fatty Acid Market Volume (K Tons) Forecast, by Application 2020 & 2033
- Table 19: India Tall Oil Fatty Acid Market Revenue (million) Forecast, by Application 2020 & 2033
- Table 20: India Tall Oil Fatty Acid Market Volume (K Tons) Forecast, by Application 2020 & 2033
- Table 21: Japan Tall Oil Fatty Acid Market Revenue (million) Forecast, by Application 2020 & 2033
- Table 22: Japan Tall Oil Fatty Acid Market Volume (K Tons) Forecast, by Application 2020 & 2033
- Table 23: South Korea Tall Oil Fatty Acid Market Revenue (million) Forecast, by Application 2020 & 2033
- Table 24: South Korea Tall Oil Fatty Acid Market Volume (K Tons) Forecast, by Application 2020 & 2033
- Table 25: Rest of Asia Pacific Tall Oil Fatty Acid Market Revenue (million) Forecast, by Application 2020 & 2033
- Table 26: Rest of Asia Pacific Tall Oil Fatty Acid Market Volume (K Tons) Forecast, by Application 2020 & 2033
- Table 27: Global Tall Oil Fatty Acid Market Revenue million Forecast, by Product Type 2020 & 2033
- Table 28: Global Tall Oil Fatty Acid Market Volume K Tons Forecast, by Product Type 2020 & 2033
- Table 29: Global Tall Oil Fatty Acid Market Revenue million Forecast, by Application 2020 & 2033
- Table 30: Global Tall Oil Fatty Acid Market Volume K Tons Forecast, by Application 2020 & 2033
- Table 31: Global Tall Oil Fatty Acid Market Revenue million Forecast, by End-user Industry 2020 & 2033
- Table 32: Global Tall Oil Fatty Acid Market Volume K Tons Forecast, by End-user Industry 2020 & 2033
- Table 33: Global Tall Oil Fatty Acid Market Revenue million Forecast, by Country 2020 & 2033
- Table 34: Global Tall Oil Fatty Acid Market Volume K Tons Forecast, by Country 2020 & 2033
- Table 35: United States Tall Oil Fatty Acid Market Revenue (million) Forecast, by Application 2020 & 2033
- Table 36: United States Tall Oil Fatty Acid Market Volume (K Tons) Forecast, by Application 2020 & 2033
- Table 37: Canada Tall Oil Fatty Acid Market Revenue (million) Forecast, by Application 2020 & 2033
- Table 38: Canada Tall Oil Fatty Acid Market Volume (K Tons) Forecast, by Application 2020 & 2033
- Table 39: Mexico Tall Oil Fatty Acid Market Revenue (million) Forecast, by Application 2020 & 2033
- Table 40: Mexico Tall Oil Fatty Acid Market Volume (K Tons) Forecast, by Application 2020 & 2033
- Table 41: Global Tall Oil Fatty Acid Market Revenue million Forecast, by Product Type 2020 & 2033
- Table 42: Global Tall Oil Fatty Acid Market Volume K Tons Forecast, by Product Type 2020 & 2033
- Table 43: Global Tall Oil Fatty Acid Market Revenue million Forecast, by Application 2020 & 2033
- Table 44: Global Tall Oil Fatty Acid Market Volume K Tons Forecast, by Application 2020 & 2033
- Table 45: Global Tall Oil Fatty Acid Market Revenue million Forecast, by End-user Industry 2020 & 2033
- Table 46: Global Tall Oil Fatty Acid Market Volume K Tons Forecast, by End-user Industry 2020 & 2033
- Table 47: Global Tall Oil Fatty Acid Market Revenue million Forecast, by Country 2020 & 2033
- Table 48: Global Tall Oil Fatty Acid Market Volume K Tons Forecast, by Country 2020 & 2033
- Table 49: Germany Tall Oil Fatty Acid Market Revenue (million) Forecast, by Application 2020 & 2033
- Table 50: Germany Tall Oil Fatty Acid Market Volume (K Tons) Forecast, by Application 2020 & 2033
- Table 51: United Kingdom Tall Oil Fatty Acid Market Revenue (million) Forecast, by Application 2020 & 2033
- Table 52: United Kingdom Tall Oil Fatty Acid Market Volume (K Tons) Forecast, by Application 2020 & 2033
- Table 53: Italy Tall Oil Fatty Acid Market Revenue (million) Forecast, by Application 2020 & 2033
- Table 54: Italy Tall Oil Fatty Acid Market Volume (K Tons) Forecast, by Application 2020 & 2033
- Table 55: France Tall Oil Fatty Acid Market Revenue (million) Forecast, by Application 2020 & 2033
- Table 56: France Tall Oil Fatty Acid Market Volume (K Tons) Forecast, by Application 2020 & 2033
- Table 57: Rest of Europe Tall Oil Fatty Acid Market Revenue (million) Forecast, by Application 2020 & 2033
- Table 58: Rest of Europe Tall Oil Fatty Acid Market Volume (K Tons) Forecast, by Application 2020 & 2033
- Table 59: Global Tall Oil Fatty Acid Market Revenue million Forecast, by Product Type 2020 & 2033
- Table 60: Global Tall Oil Fatty Acid Market Volume K Tons Forecast, by Product Type 2020 & 2033
- Table 61: Global Tall Oil Fatty Acid Market Revenue million Forecast, by Application 2020 & 2033
- Table 62: Global Tall Oil Fatty Acid Market Volume K Tons Forecast, by Application 2020 & 2033
- Table 63: Global Tall Oil Fatty Acid Market Revenue million Forecast, by End-user Industry 2020 & 2033
- Table 64: Global Tall Oil Fatty Acid Market Volume K Tons Forecast, by End-user Industry 2020 & 2033
- Table 65: Global Tall Oil Fatty Acid Market Revenue million Forecast, by Country 2020 & 2033
- Table 66: Global Tall Oil Fatty Acid Market Volume K Tons Forecast, by Country 2020 & 2033
- Table 67: Brazil Tall Oil Fatty Acid Market Revenue (million) Forecast, by Application 2020 & 2033
- Table 68: Brazil Tall Oil Fatty Acid Market Volume (K Tons) Forecast, by Application 2020 & 2033
- Table 69: Argentina Tall Oil Fatty Acid Market Revenue (million) Forecast, by Application 2020 & 2033
- Table 70: Argentina Tall Oil Fatty Acid Market Volume (K Tons) Forecast, by Application 2020 & 2033
- Table 71: Rest of South America Tall Oil Fatty Acid Market Revenue (million) Forecast, by Application 2020 & 2033
- Table 72: Rest of South America Tall Oil Fatty Acid Market Volume (K Tons) Forecast, by Application 2020 & 2033
- Table 73: Global Tall Oil Fatty Acid Market Revenue million Forecast, by Product Type 2020 & 2033
- Table 74: Global Tall Oil Fatty Acid Market Volume K Tons Forecast, by Product Type 2020 & 2033
- Table 75: Global Tall Oil Fatty Acid Market Revenue million Forecast, by Application 2020 & 2033
- Table 76: Global Tall Oil Fatty Acid Market Volume K Tons Forecast, by Application 2020 & 2033
- Table 77: Global Tall Oil Fatty Acid Market Revenue million Forecast, by End-user Industry 2020 & 2033
- Table 78: Global Tall Oil Fatty Acid Market Volume K Tons Forecast, by End-user Industry 2020 & 2033
- Table 79: Global Tall Oil Fatty Acid Market Revenue million Forecast, by Country 2020 & 2033
- Table 80: Global Tall Oil Fatty Acid Market Volume K Tons Forecast, by Country 2020 & 2033
- Table 81: Saudi Arabia Tall Oil Fatty Acid Market Revenue (million) Forecast, by Application 2020 & 2033
- Table 82: Saudi Arabia Tall Oil Fatty Acid Market Volume (K Tons) Forecast, by Application 2020 & 2033
- Table 83: South Africa Tall Oil Fatty Acid Market Revenue (million) Forecast, by Application 2020 & 2033
- Table 84: South Africa Tall Oil Fatty Acid Market Volume (K Tons) Forecast, by Application 2020 & 2033
- Table 85: Rest of Middle East and Africa Tall Oil Fatty Acid Market Revenue (million) Forecast, by Application 2020 & 2033
- Table 86: Rest of Middle East and Africa Tall Oil Fatty Acid Market Volume (K Tons) Forecast, by Application 2020 & 2033
Frequently Asked Questions
1. What is the projected Compound Annual Growth Rate (CAGR) of the Tall Oil Fatty Acid Market?
The projected CAGR is approximately 4.66%.
2. Which companies are prominent players in the Tall Oil Fatty Acid Market?
Key companies in the market include Lascaray S A, Pine Chemical Group, Imperial Industrial Minerals Company, Arizona Chemical Co, Harima Chemicals Group Inc, Eastman Chemical Company, Ingevity, Segezha-Group, Forchem Oyj, Ilim Group, KRATON CORPORATION, UNIVAR SOLUTIONS, Shaxian Lixin Resin Co Ltd, Foreverest Resources Ltd, Pasand Speciality Chemicals, Ataman Kimya, G C Rutteman & Co B V.
3. What are the main segments of the Tall Oil Fatty Acid Market?
The market segments include Product Type, Application, End-user Industry.
4. Can you provide details about the market size?
The market size is estimated to be USD 4.82 million as of 2022.
5. What are some drivers contributing to market growth?
Increasing Demand for Bio-based Lubricants in Several Industries; Other Drivers.
6. What are the notable trends driving market growth?
Increasing Usage in the Automotive Industry.
7. Are there any restraints impacting market growth?
Restrictions on Cutting of Trees by Various Governments Across the Globe; Other Restraints.
8. Can you provide examples of recent developments in the market?
N/A
9. What pricing options are available for accessing the report?
Pricing options include single-user, multi-user, and enterprise licenses priced at USD 4750, USD 5250, and USD 8750 respectively.
10. Is the market size provided in terms of value or volume?
The market size is provided in terms of value, measured in million and volume, measured in K Tons.
11. Are there any specific market keywords associated with the report?
Yes, the market keyword associated with the report is "Tall Oil Fatty Acid Market," which aids in identifying and referencing the specific market segment covered.
12. How do I determine which pricing option suits my needs best?
The pricing options vary based on user requirements and access needs. Individual users may opt for single-user licenses, while businesses requiring broader access may choose multi-user or enterprise licenses for cost-effective access to the report.
13. Are there any additional resources or data provided in the Tall Oil Fatty Acid Market report?
While the report offers comprehensive insights, it's advisable to review the specific contents or supplementary materials provided to ascertain if additional resources or data are available.
14. How can I stay updated on further developments or reports in the Tall Oil Fatty Acid Market?
To stay informed about further developments, trends, and reports in the Tall Oil Fatty Acid Market, consider subscribing to industry newsletters, following relevant companies and organizations, or regularly checking reputable industry news sources and publications.
Methodology
Step 1 - Identification of Relevant Samples Size from Population Database


Step 2 - Approaches for Defining Global Market Size (Value, Volume* & Price*)

Note*: In applicable scenarios
Step 3 - Data Sources
Primary Research
- Web Analytics
- Survey Reports
- Research Institute
- Latest Research Reports
- Opinion Leaders
Secondary Research
- Annual Reports
- White Paper
- Latest Press Release
- Industry Association
- Paid Database
- Investor Presentations

Step 4 - Data Triangulation
Involves using different sources of information in order to increase the validity of a study
These sources are likely to be stakeholders in a program - participants, other researchers, program staff, other community members, and so on.
Then we put all data in single framework & apply various statistical tools to find out the dynamic on the market.
During the analysis stage, feedback from the stakeholder groups would be compared to determine areas of agreement as well as areas of divergence