

Key Insights
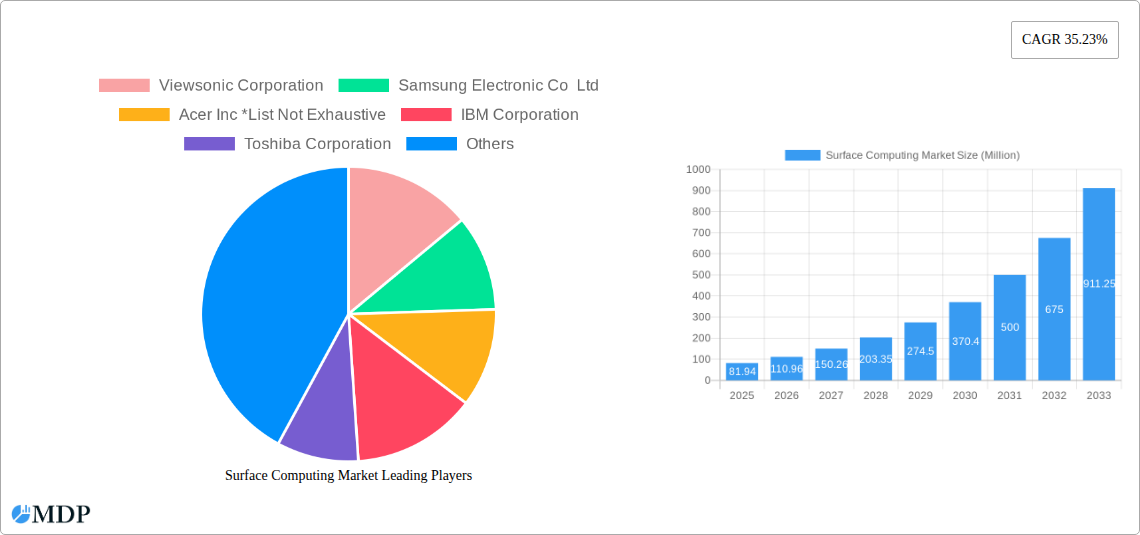
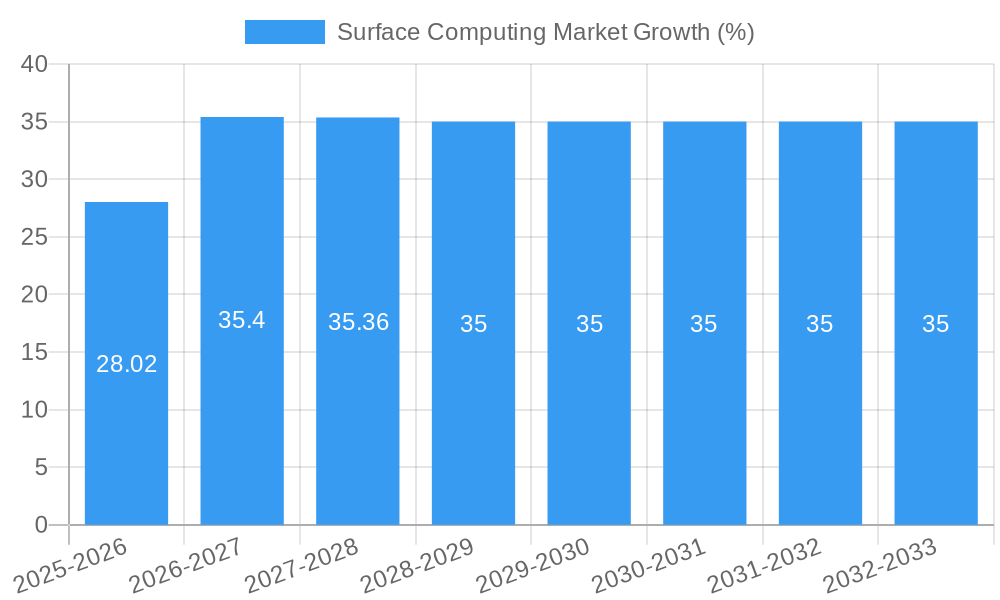
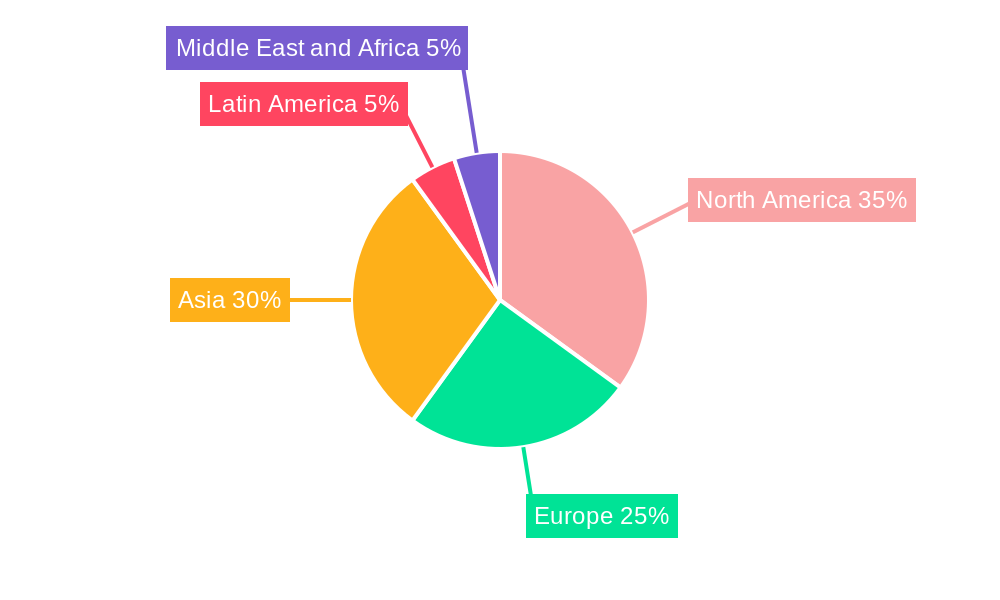
The surface computing market, valued at $81.94 million in 2025, is experiencing robust growth, projected to expand at a Compound Annual Growth Rate (CAGR) of 35.23% from 2025 to 2033. This surge is driven by several key factors. The increasing adoption of interactive displays in diverse sectors like retail (digital signage, interactive kiosks), healthcare (patient information systems, telehealth consultations), and education (interactive whiteboards) is a major catalyst. Furthermore, advancements in touch technology, including multi-touch and multi-user capabilities, are enhancing user experience and driving demand. The market's segmentation reveals a strong preference for flat displays over curved displays, reflecting cost-effectiveness and ease of integration. While single-touch remains dominant, the multi-touch and multi-user segments are witnessing significant growth, indicating a shift towards more collaborative and engaging applications. Geographic analysis suggests North America and Asia (particularly China and Japan) are currently leading market share, although growth potential in emerging economies like India and Brazil is substantial. However, factors like high initial investment costs for advanced systems and the need for robust IT infrastructure could pose challenges to wider market penetration. Nevertheless, ongoing technological innovation and the increasing integration of surface computing into various business processes are expected to propel market expansion throughout the forecast period.
The competitive landscape is characterized by a mix of established technology giants like Samsung, LG, and Microsoft, and specialized surface computing providers like Viewsonic and Planar Systems. These companies are continuously innovating to offer more advanced features, improved user interfaces, and cost-effective solutions. Strategic partnerships and collaborations are also becoming increasingly common, fostering technological advancements and broader market reach. The market is expected to witness further consolidation as companies strive to enhance their market positioning and capitalize on the growing demand for advanced interactive display solutions across various application domains. The successful integration of surface computing into existing workflows and the development of intuitive user interfaces will be crucial factors influencing the market's future trajectory.
Surface Computing Market: A Comprehensive Report (2019-2033)
This in-depth report provides a comprehensive analysis of the Surface Computing Market, offering invaluable insights for industry stakeholders, investors, and businesses seeking to navigate this dynamic landscape. The study period covers 2019-2033, with 2025 as the base and estimated year, and a forecast period of 2025-2033. The report meticulously examines market dynamics, trends, leading segments, and key players, providing actionable data and strategic recommendations. The market is projected to reach xx Million by 2033, exhibiting a CAGR of xx% during the forecast period.
Surface Computing Market Market Dynamics & Concentration
The Surface Computing Market is characterized by a moderately concentrated landscape with several key players vying for market share. While a few dominant companies hold significant portions, the market also accommodates numerous smaller players, fostering competition and innovation. Market concentration is analyzed using the Herfindahl-Hirschman Index (HHI) and market share data for key players. The HHI for 2024 is estimated at xx, indicating a moderately concentrated market. The market share of the top 5 players in 2024 was approximately xx%.
Several factors drive market dynamics:
- Innovation: Continuous advancements in display technologies (e.g., higher resolutions, improved touch sensitivity), processing power, and AI integration are key innovation drivers.
- Regulatory Frameworks: Government regulations concerning data privacy, cybersecurity, and product safety influence market growth.
- Product Substitutes: The market faces competition from alternative display technologies and interactive interfaces.
- End-User Trends: The increasing demand for interactive and immersive experiences across diverse sectors fuels market growth.
- M&A Activities: Mergers and acquisitions play a significant role in shaping the market landscape, with xx M&A deals recorded between 2019 and 2024.
Surface Computing Market Industry Trends & Analysis
The Surface Computing Market exhibits strong growth driven by several factors. The increasing adoption of surface computing technologies across various sectors, coupled with advancements in artificial intelligence and the Internet of Things (IoT), is propelling market expansion. Consumer preferences are shifting towards more interactive and intuitive interfaces, further fueling demand.
Technological disruptions, such as the introduction of AI-powered PCs and the development of advanced touch technologies, are reshaping the competitive landscape. The market penetration rate for surface computing solutions in key sectors like healthcare and education is increasing steadily, contributing to overall market growth. The market's compound annual growth rate (CAGR) during the historical period (2019-2024) was approximately xx%, projected to reach xx% during the forecast period (2025-2033). This growth is attributed to factors such as:
- Increased demand for interactive displays in commercial settings.
- Growing adoption of surface computing in the education sector.
- Technological advancements leading to enhanced user experience.
- Expanding applications in healthcare and entertainment.
Leading Markets & Segments in Surface Computing Market
The North American region currently dominates the Surface Computing Market, driven by factors like strong technological infrastructure, high disposable incomes, and early adoption of advanced technologies. Within the segment breakdown, the Flat Display type holds the largest market share, accounting for approximately xx% in 2024. The Multi-touch segment is also experiencing significant growth, driven by the increasing demand for advanced interactive capabilities. The Commercial application segment is dominant, showcasing strong adoption across various industries.
Key Drivers by Region/Segment:
- North America (Dominant Region): Strong technological infrastructure, high disposable incomes, early adoption of new technologies.
- Flat Display (Dominant Type): Cost-effectiveness, wide availability, suitability for various applications.
- Multi-touch (Dominant Touch): Enhanced user experience, improved interaction capabilities.
- Commercial (Dominant Application): High demand across diverse industries like retail, healthcare, and education.
Other key segments are analyzed in detail within the report, including a regional breakdown of market share and growth potential.
Surface Computing Market Product Developments
Recent product innovations focus on enhancing user experience, integrating AI capabilities, and improving overall performance. Companies are incorporating advanced touch technologies, higher-resolution displays, and improved processing power into their products. The integration of AI is a significant development, offering advanced features like voice recognition, gesture control, and personalized user experiences. These innovations cater to the increasing demand for intuitive and efficient interactive interfaces, aligning with the market's evolving needs.
Key Drivers of Surface Computing Market Growth
Several factors contribute to the Surface Computing Market's growth trajectory:
- Technological advancements: Innovations in display technologies, touch sensors, and processing power continuously enhance product capabilities.
- Economic factors: Rising disposable incomes and increased spending on technology in various sectors fuel market growth.
- Favorable regulatory environment: Supportive government policies and initiatives promoting technological advancement further boost the market.
Challenges in the Surface Computing Market Market
The Surface Computing Market faces some challenges:
- High initial investment costs: The cost of implementing surface computing solutions can be substantial, limiting adoption in certain sectors.
- Supply chain disruptions: Global supply chain instability can impact the availability of components, affecting production and market supply.
- Intense competition: The market is competitive, with established players and emerging companies vying for market share. This competition impacts pricing and profitability.
Emerging Opportunities in Surface Computing Market
Several emerging opportunities promise long-term growth:
- Expansion into new applications: Exploring new applications in sectors like automotive and healthcare holds substantial potential.
- Strategic partnerships: Collaborations between technology companies and end-users can foster innovation and market penetration.
- Technological breakthroughs: Advancements in areas like augmented reality (AR) and virtual reality (VR) integration can drive future growth.
Leading Players in the Surface Computing Market Sector
- Viewsonic Corporation
- Samsung Electronic Co Ltd
- Acer Inc
- IBM Corporation
- Toshiba Corporation
- LG Electronics Inc
- Fujitsu Ltd
- Planar Systems Inc
- Microsoft Corporation
- Dell Inc
- 3M Co
- Qualcomm Technologies Inc
- Hewlett-Packard Ltd
- Lenovo Group Ltd
- Apple Inc
- Panasonic Corporation
- Intel Corporation
- Sony Corporation
Key Milestones in Surface Computing Market Industry
- May 2024: Microsoft announced new computers with integrated AI technology, accelerating the AI race among tech giants.
- March 2024: Microsoft released two new AI-powered PCs and advanced its management portal, showcasing AI integration's impact on productivity.
Strategic Outlook for Surface Computing Market Market
The Surface Computing Market presents significant growth opportunities. Continued technological advancements, expanding applications across diverse sectors, and strategic collaborations will drive future market expansion. Companies focusing on innovation, delivering superior user experiences, and establishing strong partnerships are poised to capture significant market share and contribute to the overall growth of the industry.
Surface Computing Market Segmentation
-
1. Type
- 1.1. Flat Display
- 1.2. Curved Display
-
1.3. Components
- 1.3.1. Screen
- 1.3.2. Camera
- 1.3.3. Sensor
- 1.3.4. Processor
- 1.3.5. Software
- 1.3.6. Projector
- 1.3.7. Other Components
-
2. Touch
- 2.1. Single Touch
- 2.2. Multi-touch
- 2.3. Multi-user
- 2.4. Other Touches
-
3. Vision
- 3.1. Two Dimensional
- 3.2. Three Dimensional
-
4. Application
- 4.1. Entertainment
- 4.2. Retail
- 4.3. Hospitality
- 4.4. Healthcare
- 4.5. Commercial
- 4.6. Advertisement
- 4.7. Automotive
- 4.8. Education
- 4.9. Other Applications
Surface Computing Market Segmentation By Geography
-
1. North America
- 1.1. United States
- 1.2. Canada
-
2. Europe
- 2.1. United Kingdom
- 2.2. Germany
- 2.3. France
-
3. Asia
- 3.1. China
- 3.2. Japan
- 3.3. India
- 3.4. Australia and New Zealand
-
4. Latin America
- 4.1. Mexico
- 4.2. Brazil
- 4.3. Argentina
-
5. Middle East and Africa
- 5.1. Saudi Arabia
- 5.2. United Arab Emirates
- 5.3. South Africa
Surface Computing Market REPORT HIGHLIGHTS
| Aspects | Details |
|---|---|
| Study Period | 2019-2033 |
| Base Year | 2024 |
| Estimated Year | 2025 |
| Forecast Period | 2025-2033 |
| Historical Period | 2019-2024 |
| Growth Rate | CAGR of 35.23% from 2019-2033 |
| Segmentation |
|
Table of Contents
- 1. Introduction
- 1.1. Research Scope
- 1.2. Market Segmentation
- 1.3. Research Methodology
- 1.4. Definitions and Assumptions
- 2. Executive Summary
- 2.1. Introduction
- 3. Market Dynamics
- 3.1. Introduction
- 3.2. Market Drivers
- 3.2.1. More Advanced and User-friendly Interface - Natural User Interface (NUI); Increasing Business Revenue Due to Adoption of Multi-user Tabletops
- 3.3. Market Restrains
- 3.3.1. Limited Availability of Features; High Cost of Surface Computers
- 3.4. Market Trends
- 3.4.1. The Retail Sector is Expected to Hold a Significant Market Share
- 4. Market Factor Analysis
- 4.1. Porters Five Forces
- 4.2. Supply/Value Chain
- 4.3. PESTEL analysis
- 4.4. Market Entropy
- 4.5. Patent/Trademark Analysis
- 5. Global Surface Computing Market Analysis, Insights and Forecast, 2019-2031
- 5.1. Market Analysis, Insights and Forecast - by Type
- 5.1.1. Flat Display
- 5.1.2. Curved Display
- 5.1.3. Components
- 5.1.3.1. Screen
- 5.1.3.2. Camera
- 5.1.3.3. Sensor
- 5.1.3.4. Processor
- 5.1.3.5. Software
- 5.1.3.6. Projector
- 5.1.3.7. Other Components
- 5.2. Market Analysis, Insights and Forecast - by Touch
- 5.2.1. Single Touch
- 5.2.2. Multi-touch
- 5.2.3. Multi-user
- 5.2.4. Other Touches
- 5.3. Market Analysis, Insights and Forecast - by Vision
- 5.3.1. Two Dimensional
- 5.3.2. Three Dimensional
- 5.4. Market Analysis, Insights and Forecast - by Application
- 5.4.1. Entertainment
- 5.4.2. Retail
- 5.4.3. Hospitality
- 5.4.4. Healthcare
- 5.4.5. Commercial
- 5.4.6. Advertisement
- 5.4.7. Automotive
- 5.4.8. Education
- 5.4.9. Other Applications
- 5.5. Market Analysis, Insights and Forecast - by Region
- 5.5.1. North America
- 5.5.2. Europe
- 5.5.3. Asia
- 5.5.4. Latin America
- 5.5.5. Middle East and Africa
- 5.1. Market Analysis, Insights and Forecast - by Type
- 6. North America Surface Computing Market Analysis, Insights and Forecast, 2019-2031
- 6.1. Market Analysis, Insights and Forecast - by Type
- 6.1.1. Flat Display
- 6.1.2. Curved Display
- 6.1.3. Components
- 6.1.3.1. Screen
- 6.1.3.2. Camera
- 6.1.3.3. Sensor
- 6.1.3.4. Processor
- 6.1.3.5. Software
- 6.1.3.6. Projector
- 6.1.3.7. Other Components
- 6.2. Market Analysis, Insights and Forecast - by Touch
- 6.2.1. Single Touch
- 6.2.2. Multi-touch
- 6.2.3. Multi-user
- 6.2.4. Other Touches
- 6.3. Market Analysis, Insights and Forecast - by Vision
- 6.3.1. Two Dimensional
- 6.3.2. Three Dimensional
- 6.4. Market Analysis, Insights and Forecast - by Application
- 6.4.1. Entertainment
- 6.4.2. Retail
- 6.4.3. Hospitality
- 6.4.4. Healthcare
- 6.4.5. Commercial
- 6.4.6. Advertisement
- 6.4.7. Automotive
- 6.4.8. Education
- 6.4.9. Other Applications
- 6.1. Market Analysis, Insights and Forecast - by Type
- 7. Europe Surface Computing Market Analysis, Insights and Forecast, 2019-2031
- 7.1. Market Analysis, Insights and Forecast - by Type
- 7.1.1. Flat Display
- 7.1.2. Curved Display
- 7.1.3. Components
- 7.1.3.1. Screen
- 7.1.3.2. Camera
- 7.1.3.3. Sensor
- 7.1.3.4. Processor
- 7.1.3.5. Software
- 7.1.3.6. Projector
- 7.1.3.7. Other Components
- 7.2. Market Analysis, Insights and Forecast - by Touch
- 7.2.1. Single Touch
- 7.2.2. Multi-touch
- 7.2.3. Multi-user
- 7.2.4. Other Touches
- 7.3. Market Analysis, Insights and Forecast - by Vision
- 7.3.1. Two Dimensional
- 7.3.2. Three Dimensional
- 7.4. Market Analysis, Insights and Forecast - by Application
- 7.4.1. Entertainment
- 7.4.2. Retail
- 7.4.3. Hospitality
- 7.4.4. Healthcare
- 7.4.5. Commercial
- 7.4.6. Advertisement
- 7.4.7. Automotive
- 7.4.8. Education
- 7.4.9. Other Applications
- 7.1. Market Analysis, Insights and Forecast - by Type
- 8. Asia Surface Computing Market Analysis, Insights and Forecast, 2019-2031
- 8.1. Market Analysis, Insights and Forecast - by Type
- 8.1.1. Flat Display
- 8.1.2. Curved Display
- 8.1.3. Components
- 8.1.3.1. Screen
- 8.1.3.2. Camera
- 8.1.3.3. Sensor
- 8.1.3.4. Processor
- 8.1.3.5. Software
- 8.1.3.6. Projector
- 8.1.3.7. Other Components
- 8.2. Market Analysis, Insights and Forecast - by Touch
- 8.2.1. Single Touch
- 8.2.2. Multi-touch
- 8.2.3. Multi-user
- 8.2.4. Other Touches
- 8.3. Market Analysis, Insights and Forecast - by Vision
- 8.3.1. Two Dimensional
- 8.3.2. Three Dimensional
- 8.4. Market Analysis, Insights and Forecast - by Application
- 8.4.1. Entertainment
- 8.4.2. Retail
- 8.4.3. Hospitality
- 8.4.4. Healthcare
- 8.4.5. Commercial
- 8.4.6. Advertisement
- 8.4.7. Automotive
- 8.4.8. Education
- 8.4.9. Other Applications
- 8.1. Market Analysis, Insights and Forecast - by Type
- 9. Latin America Surface Computing Market Analysis, Insights and Forecast, 2019-2031
- 9.1. Market Analysis, Insights and Forecast - by Type
- 9.1.1. Flat Display
- 9.1.2. Curved Display
- 9.1.3. Components
- 9.1.3.1. Screen
- 9.1.3.2. Camera
- 9.1.3.3. Sensor
- 9.1.3.4. Processor
- 9.1.3.5. Software
- 9.1.3.6. Projector
- 9.1.3.7. Other Components
- 9.2. Market Analysis, Insights and Forecast - by Touch
- 9.2.1. Single Touch
- 9.2.2. Multi-touch
- 9.2.3. Multi-user
- 9.2.4. Other Touches
- 9.3. Market Analysis, Insights and Forecast - by Vision
- 9.3.1. Two Dimensional
- 9.3.2. Three Dimensional
- 9.4. Market Analysis, Insights and Forecast - by Application
- 9.4.1. Entertainment
- 9.4.2. Retail
- 9.4.3. Hospitality
- 9.4.4. Healthcare
- 9.4.5. Commercial
- 9.4.6. Advertisement
- 9.4.7. Automotive
- 9.4.8. Education
- 9.4.9. Other Applications
- 9.1. Market Analysis, Insights and Forecast - by Type
- 10. Middle East and Africa Surface Computing Market Analysis, Insights and Forecast, 2019-2031
- 10.1. Market Analysis, Insights and Forecast - by Type
- 10.1.1. Flat Display
- 10.1.2. Curved Display
- 10.1.3. Components
- 10.1.3.1. Screen
- 10.1.3.2. Camera
- 10.1.3.3. Sensor
- 10.1.3.4. Processor
- 10.1.3.5. Software
- 10.1.3.6. Projector
- 10.1.3.7. Other Components
- 10.2. Market Analysis, Insights and Forecast - by Touch
- 10.2.1. Single Touch
- 10.2.2. Multi-touch
- 10.2.3. Multi-user
- 10.2.4. Other Touches
- 10.3. Market Analysis, Insights and Forecast - by Vision
- 10.3.1. Two Dimensional
- 10.3.2. Three Dimensional
- 10.4. Market Analysis, Insights and Forecast - by Application
- 10.4.1. Entertainment
- 10.4.2. Retail
- 10.4.3. Hospitality
- 10.4.4. Healthcare
- 10.4.5. Commercial
- 10.4.6. Advertisement
- 10.4.7. Automotive
- 10.4.8. Education
- 10.4.9. Other Applications
- 10.1. Market Analysis, Insights and Forecast - by Type
- 11. North America Surface Computing Market Analysis, Insights and Forecast, 2019-2031
- 11.1. Market Analysis, Insights and Forecast - By Country/Sub-region
- 11.1.1 United States
- 11.1.2 Canada
- 12. Europe Surface Computing Market Analysis, Insights and Forecast, 2019-2031
- 12.1. Market Analysis, Insights and Forecast - By Country/Sub-region
- 12.1.1 United Kingdom
- 12.1.2 Germany
- 12.1.3 France
- 13. Asia Surface Computing Market Analysis, Insights and Forecast, 2019-2031
- 13.1. Market Analysis, Insights and Forecast - By Country/Sub-region
- 13.1.1 China
- 13.1.2 Japan
- 13.1.3 India
- 13.1.4 Australia and New Zealand
- 14. Latin America Surface Computing Market Analysis, Insights and Forecast, 2019-2031
- 14.1. Market Analysis, Insights and Forecast - By Country/Sub-region
- 14.1.1 Mexico
- 14.1.2 Brazil
- 14.1.3 Argentina
- 15. Middle East and Africa Surface Computing Market Analysis, Insights and Forecast, 2019-2031
- 15.1. Market Analysis, Insights and Forecast - By Country/Sub-region
- 15.1.1 Saudi Arabia
- 15.1.2 United Arab Emirates
- 15.1.3 South Africa
- 16. Competitive Analysis
- 16.1. Global Market Share Analysis 2024
- 16.2. Company Profiles
- 16.2.1 Viewsonic Corporation
- 16.2.1.1. Overview
- 16.2.1.2. Products
- 16.2.1.3. SWOT Analysis
- 16.2.1.4. Recent Developments
- 16.2.1.5. Financials (Based on Availability)
- 16.2.2 Samsung Electronic Co Ltd
- 16.2.2.1. Overview
- 16.2.2.2. Products
- 16.2.2.3. SWOT Analysis
- 16.2.2.4. Recent Developments
- 16.2.2.5. Financials (Based on Availability)
- 16.2.3 Acer Inc *List Not Exhaustive
- 16.2.3.1. Overview
- 16.2.3.2. Products
- 16.2.3.3. SWOT Analysis
- 16.2.3.4. Recent Developments
- 16.2.3.5. Financials (Based on Availability)
- 16.2.4 IBM Corporation
- 16.2.4.1. Overview
- 16.2.4.2. Products
- 16.2.4.3. SWOT Analysis
- 16.2.4.4. Recent Developments
- 16.2.4.5. Financials (Based on Availability)
- 16.2.5 Toshiba Corporation
- 16.2.5.1. Overview
- 16.2.5.2. Products
- 16.2.5.3. SWOT Analysis
- 16.2.5.4. Recent Developments
- 16.2.5.5. Financials (Based on Availability)
- 16.2.6 LG Electronics Inc
- 16.2.6.1. Overview
- 16.2.6.2. Products
- 16.2.6.3. SWOT Analysis
- 16.2.6.4. Recent Developments
- 16.2.6.5. Financials (Based on Availability)
- 16.2.7 Fujitsu Ltd
- 16.2.7.1. Overview
- 16.2.7.2. Products
- 16.2.7.3. SWOT Analysis
- 16.2.7.4. Recent Developments
- 16.2.7.5. Financials (Based on Availability)
- 16.2.8 Planar Systems Inc
- 16.2.8.1. Overview
- 16.2.8.2. Products
- 16.2.8.3. SWOT Analysis
- 16.2.8.4. Recent Developments
- 16.2.8.5. Financials (Based on Availability)
- 16.2.9 Microsoft Corporation
- 16.2.9.1. Overview
- 16.2.9.2. Products
- 16.2.9.3. SWOT Analysis
- 16.2.9.4. Recent Developments
- 16.2.9.5. Financials (Based on Availability)
- 16.2.10 Dell Inc
- 16.2.10.1. Overview
- 16.2.10.2. Products
- 16.2.10.3. SWOT Analysis
- 16.2.10.4. Recent Developments
- 16.2.10.5. Financials (Based on Availability)
- 16.2.11 3M Co
- 16.2.11.1. Overview
- 16.2.11.2. Products
- 16.2.11.3. SWOT Analysis
- 16.2.11.4. Recent Developments
- 16.2.11.5. Financials (Based on Availability)
- 16.2.12 Qualcomm Technologies Inc
- 16.2.12.1. Overview
- 16.2.12.2. Products
- 16.2.12.3. SWOT Analysis
- 16.2.12.4. Recent Developments
- 16.2.12.5. Financials (Based on Availability)
- 16.2.13 Hewlett-Packard Ltd
- 16.2.13.1. Overview
- 16.2.13.2. Products
- 16.2.13.3. SWOT Analysis
- 16.2.13.4. Recent Developments
- 16.2.13.5. Financials (Based on Availability)
- 16.2.14 Lenovo Group Ltd
- 16.2.14.1. Overview
- 16.2.14.2. Products
- 16.2.14.3. SWOT Analysis
- 16.2.14.4. Recent Developments
- 16.2.14.5. Financials (Based on Availability)
- 16.2.15 Apple Inc
- 16.2.15.1. Overview
- 16.2.15.2. Products
- 16.2.15.3. SWOT Analysis
- 16.2.15.4. Recent Developments
- 16.2.15.5. Financials (Based on Availability)
- 16.2.16 Panasonic Corporation
- 16.2.16.1. Overview
- 16.2.16.2. Products
- 16.2.16.3. SWOT Analysis
- 16.2.16.4. Recent Developments
- 16.2.16.5. Financials (Based on Availability)
- 16.2.17 Intel Corporation
- 16.2.17.1. Overview
- 16.2.17.2. Products
- 16.2.17.3. SWOT Analysis
- 16.2.17.4. Recent Developments
- 16.2.17.5. Financials (Based on Availability)
- 16.2.18 Sony Corporation
- 16.2.18.1. Overview
- 16.2.18.2. Products
- 16.2.18.3. SWOT Analysis
- 16.2.18.4. Recent Developments
- 16.2.18.5. Financials (Based on Availability)
- 16.2.1 Viewsonic Corporation
List of Figures
- Figure 1: Global Surface Computing Market Revenue Breakdown (Million, %) by Region 2024 & 2032
- Figure 2: North America Surface Computing Market Revenue (Million), by Country 2024 & 2032
- Figure 3: North America Surface Computing Market Revenue Share (%), by Country 2024 & 2032
- Figure 4: Europe Surface Computing Market Revenue (Million), by Country 2024 & 2032
- Figure 5: Europe Surface Computing Market Revenue Share (%), by Country 2024 & 2032
- Figure 6: Asia Surface Computing Market Revenue (Million), by Country 2024 & 2032
- Figure 7: Asia Surface Computing Market Revenue Share (%), by Country 2024 & 2032
- Figure 8: Latin America Surface Computing Market Revenue (Million), by Country 2024 & 2032
- Figure 9: Latin America Surface Computing Market Revenue Share (%), by Country 2024 & 2032
- Figure 10: Middle East and Africa Surface Computing Market Revenue (Million), by Country 2024 & 2032
- Figure 11: Middle East and Africa Surface Computing Market Revenue Share (%), by Country 2024 & 2032
- Figure 12: North America Surface Computing Market Revenue (Million), by Type 2024 & 2032
- Figure 13: North America Surface Computing Market Revenue Share (%), by Type 2024 & 2032
- Figure 14: North America Surface Computing Market Revenue (Million), by Touch 2024 & 2032
- Figure 15: North America Surface Computing Market Revenue Share (%), by Touch 2024 & 2032
- Figure 16: North America Surface Computing Market Revenue (Million), by Vision 2024 & 2032
- Figure 17: North America Surface Computing Market Revenue Share (%), by Vision 2024 & 2032
- Figure 18: North America Surface Computing Market Revenue (Million), by Application 2024 & 2032
- Figure 19: North America Surface Computing Market Revenue Share (%), by Application 2024 & 2032
- Figure 20: North America Surface Computing Market Revenue (Million), by Country 2024 & 2032
- Figure 21: North America Surface Computing Market Revenue Share (%), by Country 2024 & 2032
- Figure 22: Europe Surface Computing Market Revenue (Million), by Type 2024 & 2032
- Figure 23: Europe Surface Computing Market Revenue Share (%), by Type 2024 & 2032
- Figure 24: Europe Surface Computing Market Revenue (Million), by Touch 2024 & 2032
- Figure 25: Europe Surface Computing Market Revenue Share (%), by Touch 2024 & 2032
- Figure 26: Europe Surface Computing Market Revenue (Million), by Vision 2024 & 2032
- Figure 27: Europe Surface Computing Market Revenue Share (%), by Vision 2024 & 2032
- Figure 28: Europe Surface Computing Market Revenue (Million), by Application 2024 & 2032
- Figure 29: Europe Surface Computing Market Revenue Share (%), by Application 2024 & 2032
- Figure 30: Europe Surface Computing Market Revenue (Million), by Country 2024 & 2032
- Figure 31: Europe Surface Computing Market Revenue Share (%), by Country 2024 & 2032
- Figure 32: Asia Surface Computing Market Revenue (Million), by Type 2024 & 2032
- Figure 33: Asia Surface Computing Market Revenue Share (%), by Type 2024 & 2032
- Figure 34: Asia Surface Computing Market Revenue (Million), by Touch 2024 & 2032
- Figure 35: Asia Surface Computing Market Revenue Share (%), by Touch 2024 & 2032
- Figure 36: Asia Surface Computing Market Revenue (Million), by Vision 2024 & 2032
- Figure 37: Asia Surface Computing Market Revenue Share (%), by Vision 2024 & 2032
- Figure 38: Asia Surface Computing Market Revenue (Million), by Application 2024 & 2032
- Figure 39: Asia Surface Computing Market Revenue Share (%), by Application 2024 & 2032
- Figure 40: Asia Surface Computing Market Revenue (Million), by Country 2024 & 2032
- Figure 41: Asia Surface Computing Market Revenue Share (%), by Country 2024 & 2032
- Figure 42: Latin America Surface Computing Market Revenue (Million), by Type 2024 & 2032
- Figure 43: Latin America Surface Computing Market Revenue Share (%), by Type 2024 & 2032
- Figure 44: Latin America Surface Computing Market Revenue (Million), by Touch 2024 & 2032
- Figure 45: Latin America Surface Computing Market Revenue Share (%), by Touch 2024 & 2032
- Figure 46: Latin America Surface Computing Market Revenue (Million), by Vision 2024 & 2032
- Figure 47: Latin America Surface Computing Market Revenue Share (%), by Vision 2024 & 2032
- Figure 48: Latin America Surface Computing Market Revenue (Million), by Application 2024 & 2032
- Figure 49: Latin America Surface Computing Market Revenue Share (%), by Application 2024 & 2032
- Figure 50: Latin America Surface Computing Market Revenue (Million), by Country 2024 & 2032
- Figure 51: Latin America Surface Computing Market Revenue Share (%), by Country 2024 & 2032
- Figure 52: Middle East and Africa Surface Computing Market Revenue (Million), by Type 2024 & 2032
- Figure 53: Middle East and Africa Surface Computing Market Revenue Share (%), by Type 2024 & 2032
- Figure 54: Middle East and Africa Surface Computing Market Revenue (Million), by Touch 2024 & 2032
- Figure 55: Middle East and Africa Surface Computing Market Revenue Share (%), by Touch 2024 & 2032
- Figure 56: Middle East and Africa Surface Computing Market Revenue (Million), by Vision 2024 & 2032
- Figure 57: Middle East and Africa Surface Computing Market Revenue Share (%), by Vision 2024 & 2032
- Figure 58: Middle East and Africa Surface Computing Market Revenue (Million), by Application 2024 & 2032
- Figure 59: Middle East and Africa Surface Computing Market Revenue Share (%), by Application 2024 & 2032
- Figure 60: Middle East and Africa Surface Computing Market Revenue (Million), by Country 2024 & 2032
- Figure 61: Middle East and Africa Surface Computing Market Revenue Share (%), by Country 2024 & 2032
List of Tables
- Table 1: Global Surface Computing Market Revenue Million Forecast, by Region 2019 & 2032
- Table 2: Global Surface Computing Market Revenue Million Forecast, by Type 2019 & 2032
- Table 3: Global Surface Computing Market Revenue Million Forecast, by Touch 2019 & 2032
- Table 4: Global Surface Computing Market Revenue Million Forecast, by Vision 2019 & 2032
- Table 5: Global Surface Computing Market Revenue Million Forecast, by Application 2019 & 2032
- Table 6: Global Surface Computing Market Revenue Million Forecast, by Region 2019 & 2032
- Table 7: Global Surface Computing Market Revenue Million Forecast, by Country 2019 & 2032
- Table 8: United States Surface Computing Market Revenue (Million) Forecast, by Application 2019 & 2032
- Table 9: Canada Surface Computing Market Revenue (Million) Forecast, by Application 2019 & 2032
- Table 10: Global Surface Computing Market Revenue Million Forecast, by Country 2019 & 2032
- Table 11: United Kingdom Surface Computing Market Revenue (Million) Forecast, by Application 2019 & 2032
- Table 12: Germany Surface Computing Market Revenue (Million) Forecast, by Application 2019 & 2032
- Table 13: France Surface Computing Market Revenue (Million) Forecast, by Application 2019 & 2032
- Table 14: Global Surface Computing Market Revenue Million Forecast, by Country 2019 & 2032
- Table 15: China Surface Computing Market Revenue (Million) Forecast, by Application 2019 & 2032
- Table 16: Japan Surface Computing Market Revenue (Million) Forecast, by Application 2019 & 2032
- Table 17: India Surface Computing Market Revenue (Million) Forecast, by Application 2019 & 2032
- Table 18: Australia and New Zealand Surface Computing Market Revenue (Million) Forecast, by Application 2019 & 2032
- Table 19: Global Surface Computing Market Revenue Million Forecast, by Country 2019 & 2032
- Table 20: Mexico Surface Computing Market Revenue (Million) Forecast, by Application 2019 & 2032
- Table 21: Brazil Surface Computing Market Revenue (Million) Forecast, by Application 2019 & 2032
- Table 22: Argentina Surface Computing Market Revenue (Million) Forecast, by Application 2019 & 2032
- Table 23: Global Surface Computing Market Revenue Million Forecast, by Country 2019 & 2032
- Table 24: Saudi Arabia Surface Computing Market Revenue (Million) Forecast, by Application 2019 & 2032
- Table 25: United Arab Emirates Surface Computing Market Revenue (Million) Forecast, by Application 2019 & 2032
- Table 26: South Africa Surface Computing Market Revenue (Million) Forecast, by Application 2019 & 2032
- Table 27: Global Surface Computing Market Revenue Million Forecast, by Type 2019 & 2032
- Table 28: Global Surface Computing Market Revenue Million Forecast, by Touch 2019 & 2032
- Table 29: Global Surface Computing Market Revenue Million Forecast, by Vision 2019 & 2032
- Table 30: Global Surface Computing Market Revenue Million Forecast, by Application 2019 & 2032
- Table 31: Global Surface Computing Market Revenue Million Forecast, by Country 2019 & 2032
- Table 32: United States Surface Computing Market Revenue (Million) Forecast, by Application 2019 & 2032
- Table 33: Canada Surface Computing Market Revenue (Million) Forecast, by Application 2019 & 2032
- Table 34: Global Surface Computing Market Revenue Million Forecast, by Type 2019 & 2032
- Table 35: Global Surface Computing Market Revenue Million Forecast, by Touch 2019 & 2032
- Table 36: Global Surface Computing Market Revenue Million Forecast, by Vision 2019 & 2032
- Table 37: Global Surface Computing Market Revenue Million Forecast, by Application 2019 & 2032
- Table 38: Global Surface Computing Market Revenue Million Forecast, by Country 2019 & 2032
- Table 39: United Kingdom Surface Computing Market Revenue (Million) Forecast, by Application 2019 & 2032
- Table 40: Germany Surface Computing Market Revenue (Million) Forecast, by Application 2019 & 2032
- Table 41: France Surface Computing Market Revenue (Million) Forecast, by Application 2019 & 2032
- Table 42: Global Surface Computing Market Revenue Million Forecast, by Type 2019 & 2032
- Table 43: Global Surface Computing Market Revenue Million Forecast, by Touch 2019 & 2032
- Table 44: Global Surface Computing Market Revenue Million Forecast, by Vision 2019 & 2032
- Table 45: Global Surface Computing Market Revenue Million Forecast, by Application 2019 & 2032
- Table 46: Global Surface Computing Market Revenue Million Forecast, by Country 2019 & 2032
- Table 47: China Surface Computing Market Revenue (Million) Forecast, by Application 2019 & 2032
- Table 48: Japan Surface Computing Market Revenue (Million) Forecast, by Application 2019 & 2032
- Table 49: India Surface Computing Market Revenue (Million) Forecast, by Application 2019 & 2032
- Table 50: Australia and New Zealand Surface Computing Market Revenue (Million) Forecast, by Application 2019 & 2032
- Table 51: Global Surface Computing Market Revenue Million Forecast, by Type 2019 & 2032
- Table 52: Global Surface Computing Market Revenue Million Forecast, by Touch 2019 & 2032
- Table 53: Global Surface Computing Market Revenue Million Forecast, by Vision 2019 & 2032
- Table 54: Global Surface Computing Market Revenue Million Forecast, by Application 2019 & 2032
- Table 55: Global Surface Computing Market Revenue Million Forecast, by Country 2019 & 2032
- Table 56: Mexico Surface Computing Market Revenue (Million) Forecast, by Application 2019 & 2032
- Table 57: Brazil Surface Computing Market Revenue (Million) Forecast, by Application 2019 & 2032
- Table 58: Argentina Surface Computing Market Revenue (Million) Forecast, by Application 2019 & 2032
- Table 59: Global Surface Computing Market Revenue Million Forecast, by Type 2019 & 2032
- Table 60: Global Surface Computing Market Revenue Million Forecast, by Touch 2019 & 2032
- Table 61: Global Surface Computing Market Revenue Million Forecast, by Vision 2019 & 2032
- Table 62: Global Surface Computing Market Revenue Million Forecast, by Application 2019 & 2032
- Table 63: Global Surface Computing Market Revenue Million Forecast, by Country 2019 & 2032
- Table 64: Saudi Arabia Surface Computing Market Revenue (Million) Forecast, by Application 2019 & 2032
- Table 65: United Arab Emirates Surface Computing Market Revenue (Million) Forecast, by Application 2019 & 2032
- Table 66: South Africa Surface Computing Market Revenue (Million) Forecast, by Application 2019 & 2032
Frequently Asked Questions
1. What is the projected Compound Annual Growth Rate (CAGR) of the Surface Computing Market?
The projected CAGR is approximately 35.23%.
2. Which companies are prominent players in the Surface Computing Market?
Key companies in the market include Viewsonic Corporation, Samsung Electronic Co Ltd, Acer Inc *List Not Exhaustive, IBM Corporation, Toshiba Corporation, LG Electronics Inc, Fujitsu Ltd, Planar Systems Inc, Microsoft Corporation, Dell Inc, 3M Co, Qualcomm Technologies Inc, Hewlett-Packard Ltd, Lenovo Group Ltd, Apple Inc, Panasonic Corporation, Intel Corporation, Sony Corporation.
3. What are the main segments of the Surface Computing Market?
The market segments include Type, Touch, Vision, Application.
4. Can you provide details about the market size?
The market size is estimated to be USD 81.94 Million as of 2022.
5. What are some drivers contributing to market growth?
More Advanced and User-friendly Interface - Natural User Interface (NUI); Increasing Business Revenue Due to Adoption of Multi-user Tabletops.
6. What are the notable trends driving market growth?
The Retail Sector is Expected to Hold a Significant Market Share.
7. Are there any restraints impacting market growth?
Limited Availability of Features; High Cost of Surface Computers.
8. Can you provide examples of recent developments in the market?
May 2024 - Microsoft announced new computers with the company’s artificial intelligence tech built directly into them, boosting the race among tech giants to push out AI tools to the public and adding computer chips that are tailored to run AI technology to the company’s PCs and tablets will make AI tools and features run faster than if the technology runs through an internet connection, as most chatbots.
9. What pricing options are available for accessing the report?
Pricing options include single-user, multi-user, and enterprise licenses priced at USD 4750, USD 5250, and USD 8750 respectively.
10. Is the market size provided in terms of value or volume?
The market size is provided in terms of value, measured in Million.
11. Are there any specific market keywords associated with the report?
Yes, the market keyword associated with the report is "Surface Computing Market," which aids in identifying and referencing the specific market segment covered.
12. How do I determine which pricing option suits my needs best?
The pricing options vary based on user requirements and access needs. Individual users may opt for single-user licenses, while businesses requiring broader access may choose multi-user or enterprise licenses for cost-effective access to the report.
13. Are there any additional resources or data provided in the Surface Computing Market report?
While the report offers comprehensive insights, it's advisable to review the specific contents or supplementary materials provided to ascertain if additional resources or data are available.
14. How can I stay updated on further developments or reports in the Surface Computing Market?
To stay informed about further developments, trends, and reports in the Surface Computing Market, consider subscribing to industry newsletters, following relevant companies and organizations, or regularly checking reputable industry news sources and publications.
Methodology
Step 1 - Identification of Relevant Samples Size from Population Database


Step 2 - Approaches for Defining Global Market Size (Value, Volume* & Price*)

Note*: In applicable scenarios
Step 3 - Data Sources
Primary Research
- Web Analytics
- Survey Reports
- Research Institute
- Latest Research Reports
- Opinion Leaders
Secondary Research
- Annual Reports
- White Paper
- Latest Press Release
- Industry Association
- Paid Database
- Investor Presentations

Step 4 - Data Triangulation
Involves using different sources of information in order to increase the validity of a study
These sources are likely to be stakeholders in a program - participants, other researchers, program staff, other community members, and so on.
Then we put all data in single framework & apply various statistical tools to find out the dynamic on the market.
During the analysis stage, feedback from the stakeholder groups would be compared to determine areas of agreement as well as areas of divergence
