

Key Insights
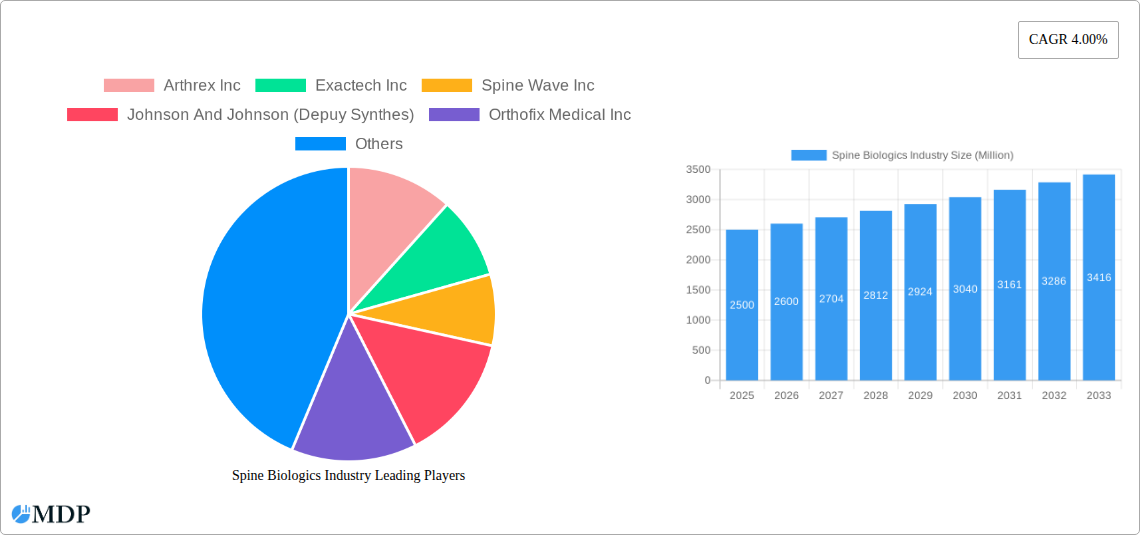
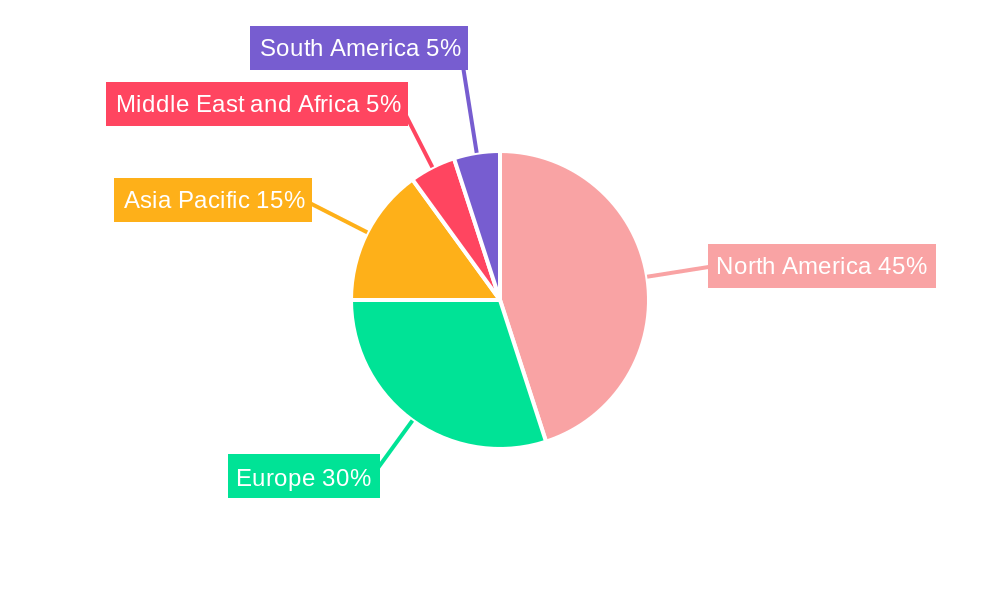
The global spine biologics market, valued at approximately $2.5 billion in 2025, is projected to experience robust growth, driven by a rising geriatric population, increasing prevalence of spinal disorders like osteoporosis and degenerative disc disease, and advancements in minimally invasive surgical techniques. The market's compound annual growth rate (CAGR) of 4.00% from 2025 to 2033 indicates a steady expansion, with significant contributions expected from both bone graft substitutes (including synthetic bone grafts, demineralized bone matrix, and allografts) and spinal allografts. The demand for less invasive procedures and faster recovery times fuels the adoption of these biologics, particularly within the hospital and ambulatory surgical center segments. North America currently holds a dominant market share due to high healthcare expenditure and technological advancements, but the Asia-Pacific region is poised for significant growth, fueled by rising disposable incomes and improved healthcare infrastructure in countries like China and India. However, the market faces restraints such as high costs associated with biologics, stringent regulatory approvals, and potential complications associated with their use. Nevertheless, ongoing research and development efforts focusing on efficacy and safety are expected to mitigate these challenges and contribute to the market's continued expansion.
The competitive landscape is marked by the presence of established players like Johnson & Johnson (Depuy Synthes), Medtronic plc, Stryker Corporation, and Zimmer Biomet, alongside specialized companies like Arthrex Inc, Exactech Inc, and NuVasive Inc. These companies are engaged in intense competition, focusing on product innovation, strategic partnerships, and geographic expansion to maintain their market position. The increasing emphasis on personalized medicine and the development of novel biologics with enhanced efficacy and reduced side effects are key trends shaping the future of the spine biologics market. Further growth is anticipated through the introduction of innovative products, improved reimbursement policies, and expanding applications of spine biologics in various spinal procedures.
Spine Biologics Industry Market Report: 2019-2033
This comprehensive report provides a detailed analysis of the global spine biologics market, offering invaluable insights for stakeholders across the industry. With a focus on market dynamics, leading players, and future trends, this report is essential for strategic decision-making. The study period covers 2019-2033, with a base year of 2025 and a forecast period of 2025-2033. The market is segmented by product (Bone Graft Substitutes, Synthetic Bone Grafts, Spinal Allografts, Demineralized Bone Matrix, Others) and end-user (Hospitals, Ambulatory Surgical Centers, Others). Key players analyzed include Arthrex Inc, Exactech Inc, Spine Wave Inc, Johnson & Johnson (Depuy Synthes), Orthofix Medical Inc, NuVasive Inc, Stryker Corporation, Zimmer Biomet, and Medtronic plc. The market is projected to reach xx Million by 2033.
Spine Biologics Industry Market Dynamics & Concentration
The global spine biologics market exhibits a moderately concentrated landscape, with several major players holding significant market share. Innovation drives significant market growth, particularly in the development of advanced bone graft substitutes and minimally invasive surgical techniques. Stringent regulatory frameworks, including FDA approvals in the US and CE markings in Europe, significantly influence market entry and product development. The availability of synthetic alternatives and advancements in other surgical techniques pose competitive pressure, yet the market consistently demonstrates growth due to aging populations and increased spinal surgeries. Mergers and acquisitions (M&A) play a crucial role in shaping market dynamics, with xx M&A deals recorded between 2019 and 2024. The market share of the top five players is estimated to be approximately 60% in 2025.
- Market Concentration: Moderately concentrated, top 5 players hold ~60% market share (2025).
- Innovation Drivers: Advancements in bone graft substitutes and minimally invasive surgery.
- Regulatory Landscape: Stringent FDA and CE approvals influence market access.
- Product Substitutes: Synthetic alternatives and other surgical techniques create competitive pressure.
- End-User Trends: Growing preference for minimally invasive procedures and ambulatory surgical centers.
- M&A Activity: xx M&A deals (2019-2024).
Spine Biologics Industry Trends & Analysis
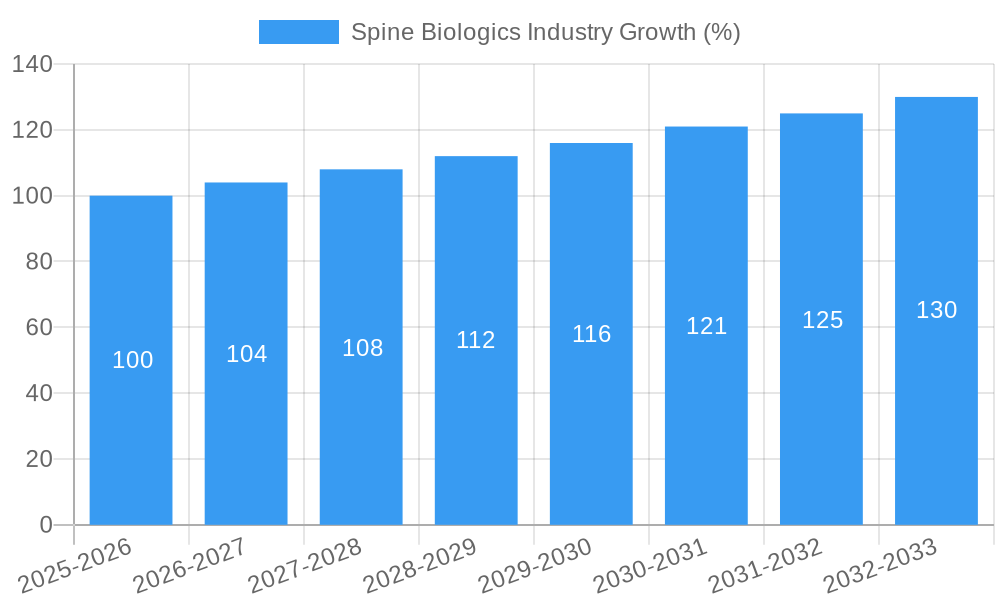
The spine biologics market is experiencing robust growth, driven by several key factors. The aging global population, coupled with rising incidence of spinal disorders, significantly fuels market demand. Technological advancements, particularly in minimally invasive surgical techniques and biomaterial science, have led to improved outcomes and expanded market applications. Consumer preference for less invasive procedures with faster recovery times further boosts market expansion. The market demonstrates a Compound Annual Growth Rate (CAGR) of xx% during the forecast period (2025-2033), with market penetration increasing steadily across various regions. Competitive dynamics are shaped by ongoing innovation, strategic partnerships, and M&A activity. Specific technological disruptions, such as the use of 3D printing in bone graft design, are accelerating growth and altering the market landscape. Market penetration in developed regions is expected to reach xx% by 2033.
Leading Markets & Segments in Spine Biologics Industry
The North American market currently dominates the global spine biologics market, driven by factors such as high healthcare expenditure, advanced medical infrastructure, and a large aging population. Within the product segments, Bone Graft Substitutes currently hold the largest market share, followed by Spinal Allografts. The Hospitals segment dominates the end-user landscape, although the Ambulatory Surgical Centers segment shows rapid growth, attributed to cost-effectiveness and reduced patient recovery times.
Key Drivers of North American Dominance:
- High healthcare expenditure.
- Advanced medical infrastructure.
- Large aging population.
- High rate of spinal surgeries.
Dominant Product Segment: Bone Graft Substitutes.
Dominant End-User Segment: Hospitals.
Rapidly Growing Segment: Ambulatory Surgical Centers
Spine Biologics Industry Product Developments
Significant advancements are occurring in biomaterial science, leading to the development of novel bone graft substitutes with improved biocompatibility, osteoconductivity, and handling characteristics. These innovations translate to enhanced clinical outcomes, shorter recovery times, and reduced complications. Technological trends focus on personalized medicine, 3D-printed bone grafts, and the integration of smart materials to monitor bone regeneration. The market fit for these new products is strong, driven by the increasing demand for minimally invasive procedures and superior patient results.
Key Drivers of Spine Biologics Industry Growth
Several key factors drive the growth of the spine biologics market. An aging global population experiencing a higher incidence of spinal disorders fuels demand for treatment. Technological advancements result in safer, more effective procedures. Favorable regulatory environments and increased healthcare expenditure in developing countries further accelerate market growth. The rising adoption of minimally invasive surgical techniques also contributes to market expansion.
Challenges in the Spine Biologics Industry Market
The spine biologics market faces several challenges. Stringent regulatory approvals increase the time and cost of product launches. Supply chain disruptions can impact the availability of raw materials. Intense competition among established players and new entrants creates pricing pressures. The high cost of treatment can limit accessibility in certain regions. Furthermore, reimbursement policies and healthcare coverage can affect market growth. The industry faces a xx Million loss annually due to supply chain issues.
Emerging Opportunities in Spine Biologics Industry
Significant long-term growth opportunities exist. Technological breakthroughs, such as the development of next-generation biomaterials, present considerable market potential. Strategic partnerships and collaborations between biologics companies and medical device manufacturers can accelerate innovation and market penetration. Expanding into emerging markets with growing healthcare infrastructure offers further opportunities.
Leading Players in the Spine Biologics Industry Sector
- Arthrex Inc
- Exactech Inc
- Spine Wave Inc
- Johnson & Johnson (Depuy Synthes)
- Orthofix Medical Inc
- NuVasive Inc
- Stryker Corporation
- Zimmer Biomet
- Medtronic plc
Key Milestones in Spine Biologics Industry Industry
- 2020: FDA approval of a novel bone graft substitute with enhanced bioactivity.
- 2021: Partnership between Company A and Company B to develop a new minimally invasive spinal fusion system.
- 2022: Launch of a new line of 3D-printed spinal implants.
- 2023: Acquisition of Company C by a major player in the spine biologics market.
- 2024: Publication of significant clinical trial data demonstrating the efficacy of a new bone graft technology.
Strategic Outlook for Spine Biologics Industry Market
The spine biologics market is poised for significant long-term growth, driven by continued technological advancements, increasing prevalence of spinal disorders, and expanding healthcare infrastructure in emerging economies. Strategic opportunities exist in developing innovative products tailored to specific patient needs, forging strategic alliances, and expanding into new geographical markets. Focusing on minimally invasive techniques and personalized medicine will be critical for future success.
Spine Biologics Industry Segmentation
-
1. Product
-
1.1. Bone Graft Substitutes
- 1.1.1. Bone Morphogenetic Proteins
- 1.1.2. Synthetic Bone Grafts
-
1.2. Spinal Allografts
- 1.2.1. Machined Bones Allograft
- 1.2.2. Demineralized Bone Matrix
- 1.3. Others
-
1.1. Bone Graft Substitutes
-
2. End User
- 2.1. Hospitals
- 2.2. Ambulatory Surgical Centers
- 2.3. Others
Spine Biologics Industry Segmentation By Geography
-
1. North America
- 1.1. United States
- 1.2. Canada
- 1.3. Mexico
-
2. Europe
- 2.1. Germany
- 2.2. United Kingdom
- 2.3. France
- 2.4. Italy
- 2.5. Spain
- 2.6. Rest of Europe
-
3. Asia Pacific
- 3.1. China
- 3.2. Japan
- 3.3. India
- 3.4. Australia
- 3.5. South Korea
- 3.6. Rest of Asia Pacific
-
4. Middle East and Africa
- 4.1. GCC
- 4.2. South Africa
- 4.3. Rest of Middle East and Africa
-
5. South America
- 5.1. Brazil
- 5.2. Argentina
- 5.3. Rest of South America
Spine Biologics Industry REPORT HIGHLIGHTS
| Aspects | Details |
|---|---|
| Study Period | 2019-2033 |
| Base Year | 2024 |
| Estimated Year | 2025 |
| Forecast Period | 2025-2033 |
| Historical Period | 2019-2024 |
| Growth Rate | CAGR of 4.00% from 2019-2033 |
| Segmentation |
|
Table of Contents
- 1. Introduction
- 1.1. Research Scope
- 1.2. Market Segmentation
- 1.3. Research Methodology
- 1.4. Definitions and Assumptions
- 2. Executive Summary
- 2.1. Introduction
- 3. Market Dynamics
- 3.1. Introduction
- 3.2. Market Drivers
- 3.2.1. ; Growing Geriatric Population; Growing Prevalence of Spine Deformities; Technological Advancements
- 3.3. Market Restrains
- 3.3.1. ; Reimbursement Policies
- 3.4. Market Trends
- 3.4.1. Spinal Allografts in Spinal Biologics is Estimated to Witness a Healthy Growth in Future
- 4. Market Factor Analysis
- 4.1. Porters Five Forces
- 4.2. Supply/Value Chain
- 4.3. PESTEL analysis
- 4.4. Market Entropy
- 4.5. Patent/Trademark Analysis
- 5. Global Spine Biologics Industry Analysis, Insights and Forecast, 2019-2031
- 5.1. Market Analysis, Insights and Forecast - by Product
- 5.1.1. Bone Graft Substitutes
- 5.1.1.1. Bone Morphogenetic Proteins
- 5.1.1.2. Synthetic Bone Grafts
- 5.1.2. Spinal Allografts
- 5.1.2.1. Machined Bones Allograft
- 5.1.2.2. Demineralized Bone Matrix
- 5.1.3. Others
- 5.1.1. Bone Graft Substitutes
- 5.2. Market Analysis, Insights and Forecast - by End User
- 5.2.1. Hospitals
- 5.2.2. Ambulatory Surgical Centers
- 5.2.3. Others
- 5.3. Market Analysis, Insights and Forecast - by Region
- 5.3.1. North America
- 5.3.2. Europe
- 5.3.3. Asia Pacific
- 5.3.4. Middle East and Africa
- 5.3.5. South America
- 5.1. Market Analysis, Insights and Forecast - by Product
- 6. North America Spine Biologics Industry Analysis, Insights and Forecast, 2019-2031
- 6.1. Market Analysis, Insights and Forecast - by Product
- 6.1.1. Bone Graft Substitutes
- 6.1.1.1. Bone Morphogenetic Proteins
- 6.1.1.2. Synthetic Bone Grafts
- 6.1.2. Spinal Allografts
- 6.1.2.1. Machined Bones Allograft
- 6.1.2.2. Demineralized Bone Matrix
- 6.1.3. Others
- 6.1.1. Bone Graft Substitutes
- 6.2. Market Analysis, Insights and Forecast - by End User
- 6.2.1. Hospitals
- 6.2.2. Ambulatory Surgical Centers
- 6.2.3. Others
- 6.1. Market Analysis, Insights and Forecast - by Product
- 7. Europe Spine Biologics Industry Analysis, Insights and Forecast, 2019-2031
- 7.1. Market Analysis, Insights and Forecast - by Product
- 7.1.1. Bone Graft Substitutes
- 7.1.1.1. Bone Morphogenetic Proteins
- 7.1.1.2. Synthetic Bone Grafts
- 7.1.2. Spinal Allografts
- 7.1.2.1. Machined Bones Allograft
- 7.1.2.2. Demineralized Bone Matrix
- 7.1.3. Others
- 7.1.1. Bone Graft Substitutes
- 7.2. Market Analysis, Insights and Forecast - by End User
- 7.2.1. Hospitals
- 7.2.2. Ambulatory Surgical Centers
- 7.2.3. Others
- 7.1. Market Analysis, Insights and Forecast - by Product
- 8. Asia Pacific Spine Biologics Industry Analysis, Insights and Forecast, 2019-2031
- 8.1. Market Analysis, Insights and Forecast - by Product
- 8.1.1. Bone Graft Substitutes
- 8.1.1.1. Bone Morphogenetic Proteins
- 8.1.1.2. Synthetic Bone Grafts
- 8.1.2. Spinal Allografts
- 8.1.2.1. Machined Bones Allograft
- 8.1.2.2. Demineralized Bone Matrix
- 8.1.3. Others
- 8.1.1. Bone Graft Substitutes
- 8.2. Market Analysis, Insights and Forecast - by End User
- 8.2.1. Hospitals
- 8.2.2. Ambulatory Surgical Centers
- 8.2.3. Others
- 8.1. Market Analysis, Insights and Forecast - by Product
- 9. Middle East and Africa Spine Biologics Industry Analysis, Insights and Forecast, 2019-2031
- 9.1. Market Analysis, Insights and Forecast - by Product
- 9.1.1. Bone Graft Substitutes
- 9.1.1.1. Bone Morphogenetic Proteins
- 9.1.1.2. Synthetic Bone Grafts
- 9.1.2. Spinal Allografts
- 9.1.2.1. Machined Bones Allograft
- 9.1.2.2. Demineralized Bone Matrix
- 9.1.3. Others
- 9.1.1. Bone Graft Substitutes
- 9.2. Market Analysis, Insights and Forecast - by End User
- 9.2.1. Hospitals
- 9.2.2. Ambulatory Surgical Centers
- 9.2.3. Others
- 9.1. Market Analysis, Insights and Forecast - by Product
- 10. South America Spine Biologics Industry Analysis, Insights and Forecast, 2019-2031
- 10.1. Market Analysis, Insights and Forecast - by Product
- 10.1.1. Bone Graft Substitutes
- 10.1.1.1. Bone Morphogenetic Proteins
- 10.1.1.2. Synthetic Bone Grafts
- 10.1.2. Spinal Allografts
- 10.1.2.1. Machined Bones Allograft
- 10.1.2.2. Demineralized Bone Matrix
- 10.1.3. Others
- 10.1.1. Bone Graft Substitutes
- 10.2. Market Analysis, Insights and Forecast - by End User
- 10.2.1. Hospitals
- 10.2.2. Ambulatory Surgical Centers
- 10.2.3. Others
- 10.1. Market Analysis, Insights and Forecast - by Product
- 11. North America Spine Biologics Industry Analysis, Insights and Forecast, 2019-2031
- 11.1. Market Analysis, Insights and Forecast - By Country/Sub-region
- 11.1.1 United States
- 11.1.2 Canada
- 11.1.3 Mexico
- 12. Europe Spine Biologics Industry Analysis, Insights and Forecast, 2019-2031
- 12.1. Market Analysis, Insights and Forecast - By Country/Sub-region
- 12.1.1 Germany
- 12.1.2 United Kingdom
- 12.1.3 France
- 12.1.4 Italy
- 12.1.5 Spain
- 12.1.6 Rest of Europe
- 13. Asia Pacific Spine Biologics Industry Analysis, Insights and Forecast, 2019-2031
- 13.1. Market Analysis, Insights and Forecast - By Country/Sub-region
- 13.1.1 China
- 13.1.2 Japan
- 13.1.3 India
- 13.1.4 Australia
- 13.1.5 South Korea
- 13.1.6 Rest of Asia Pacific
- 14. Middle East and Africa Spine Biologics Industry Analysis, Insights and Forecast, 2019-2031
- 14.1. Market Analysis, Insights and Forecast - By Country/Sub-region
- 14.1.1 GCC
- 14.1.2 South Africa
- 14.1.3 Rest of Middle East and Africa
- 15. South America Spine Biologics Industry Analysis, Insights and Forecast, 2019-2031
- 15.1. Market Analysis, Insights and Forecast - By Country/Sub-region
- 15.1.1 Brazil
- 15.1.2 Argentina
- 15.1.3 Rest of South America
- 16. Competitive Analysis
- 16.1. Global Market Share Analysis 2024
- 16.2. Company Profiles
- 16.2.1 Arthrex Inc
- 16.2.1.1. Overview
- 16.2.1.2. Products
- 16.2.1.3. SWOT Analysis
- 16.2.1.4. Recent Developments
- 16.2.1.5. Financials (Based on Availability)
- 16.2.2 Exactech Inc
- 16.2.2.1. Overview
- 16.2.2.2. Products
- 16.2.2.3. SWOT Analysis
- 16.2.2.4. Recent Developments
- 16.2.2.5. Financials (Based on Availability)
- 16.2.3 Spine Wave Inc
- 16.2.3.1. Overview
- 16.2.3.2. Products
- 16.2.3.3. SWOT Analysis
- 16.2.3.4. Recent Developments
- 16.2.3.5. Financials (Based on Availability)
- 16.2.4 Johnson And Johnson (Depuy Synthes)
- 16.2.4.1. Overview
- 16.2.4.2. Products
- 16.2.4.3. SWOT Analysis
- 16.2.4.4. Recent Developments
- 16.2.4.5. Financials (Based on Availability)
- 16.2.5 Orthofix Medical Inc
- 16.2.5.1. Overview
- 16.2.5.2. Products
- 16.2.5.3. SWOT Analysis
- 16.2.5.4. Recent Developments
- 16.2.5.5. Financials (Based on Availability)
- 16.2.6 NuVasive Inc
- 16.2.6.1. Overview
- 16.2.6.2. Products
- 16.2.6.3. SWOT Analysis
- 16.2.6.4. Recent Developments
- 16.2.6.5. Financials (Based on Availability)
- 16.2.7 Stryker Corporation
- 16.2.7.1. Overview
- 16.2.7.2. Products
- 16.2.7.3. SWOT Analysis
- 16.2.7.4. Recent Developments
- 16.2.7.5. Financials (Based on Availability)
- 16.2.8 Zimmer Biomet
- 16.2.8.1. Overview
- 16.2.8.2. Products
- 16.2.8.3. SWOT Analysis
- 16.2.8.4. Recent Developments
- 16.2.8.5. Financials (Based on Availability)
- 16.2.9 Medtronic plc
- 16.2.9.1. Overview
- 16.2.9.2. Products
- 16.2.9.3. SWOT Analysis
- 16.2.9.4. Recent Developments
- 16.2.9.5. Financials (Based on Availability)
- 16.2.1 Arthrex Inc
List of Figures
- Figure 1: Global Spine Biologics Industry Revenue Breakdown (Million, %) by Region 2024 & 2032
- Figure 2: North America Spine Biologics Industry Revenue (Million), by Country 2024 & 2032
- Figure 3: North America Spine Biologics Industry Revenue Share (%), by Country 2024 & 2032
- Figure 4: Europe Spine Biologics Industry Revenue (Million), by Country 2024 & 2032
- Figure 5: Europe Spine Biologics Industry Revenue Share (%), by Country 2024 & 2032
- Figure 6: Asia Pacific Spine Biologics Industry Revenue (Million), by Country 2024 & 2032
- Figure 7: Asia Pacific Spine Biologics Industry Revenue Share (%), by Country 2024 & 2032
- Figure 8: Middle East and Africa Spine Biologics Industry Revenue (Million), by Country 2024 & 2032
- Figure 9: Middle East and Africa Spine Biologics Industry Revenue Share (%), by Country 2024 & 2032
- Figure 10: South America Spine Biologics Industry Revenue (Million), by Country 2024 & 2032
- Figure 11: South America Spine Biologics Industry Revenue Share (%), by Country 2024 & 2032
- Figure 12: North America Spine Biologics Industry Revenue (Million), by Product 2024 & 2032
- Figure 13: North America Spine Biologics Industry Revenue Share (%), by Product 2024 & 2032
- Figure 14: North America Spine Biologics Industry Revenue (Million), by End User 2024 & 2032
- Figure 15: North America Spine Biologics Industry Revenue Share (%), by End User 2024 & 2032
- Figure 16: North America Spine Biologics Industry Revenue (Million), by Country 2024 & 2032
- Figure 17: North America Spine Biologics Industry Revenue Share (%), by Country 2024 & 2032
- Figure 18: Europe Spine Biologics Industry Revenue (Million), by Product 2024 & 2032
- Figure 19: Europe Spine Biologics Industry Revenue Share (%), by Product 2024 & 2032
- Figure 20: Europe Spine Biologics Industry Revenue (Million), by End User 2024 & 2032
- Figure 21: Europe Spine Biologics Industry Revenue Share (%), by End User 2024 & 2032
- Figure 22: Europe Spine Biologics Industry Revenue (Million), by Country 2024 & 2032
- Figure 23: Europe Spine Biologics Industry Revenue Share (%), by Country 2024 & 2032
- Figure 24: Asia Pacific Spine Biologics Industry Revenue (Million), by Product 2024 & 2032
- Figure 25: Asia Pacific Spine Biologics Industry Revenue Share (%), by Product 2024 & 2032
- Figure 26: Asia Pacific Spine Biologics Industry Revenue (Million), by End User 2024 & 2032
- Figure 27: Asia Pacific Spine Biologics Industry Revenue Share (%), by End User 2024 & 2032
- Figure 28: Asia Pacific Spine Biologics Industry Revenue (Million), by Country 2024 & 2032
- Figure 29: Asia Pacific Spine Biologics Industry Revenue Share (%), by Country 2024 & 2032
- Figure 30: Middle East and Africa Spine Biologics Industry Revenue (Million), by Product 2024 & 2032
- Figure 31: Middle East and Africa Spine Biologics Industry Revenue Share (%), by Product 2024 & 2032
- Figure 32: Middle East and Africa Spine Biologics Industry Revenue (Million), by End User 2024 & 2032
- Figure 33: Middle East and Africa Spine Biologics Industry Revenue Share (%), by End User 2024 & 2032
- Figure 34: Middle East and Africa Spine Biologics Industry Revenue (Million), by Country 2024 & 2032
- Figure 35: Middle East and Africa Spine Biologics Industry Revenue Share (%), by Country 2024 & 2032
- Figure 36: South America Spine Biologics Industry Revenue (Million), by Product 2024 & 2032
- Figure 37: South America Spine Biologics Industry Revenue Share (%), by Product 2024 & 2032
- Figure 38: South America Spine Biologics Industry Revenue (Million), by End User 2024 & 2032
- Figure 39: South America Spine Biologics Industry Revenue Share (%), by End User 2024 & 2032
- Figure 40: South America Spine Biologics Industry Revenue (Million), by Country 2024 & 2032
- Figure 41: South America Spine Biologics Industry Revenue Share (%), by Country 2024 & 2032
List of Tables
- Table 1: Global Spine Biologics Industry Revenue Million Forecast, by Region 2019 & 2032
- Table 2: Global Spine Biologics Industry Revenue Million Forecast, by Product 2019 & 2032
- Table 3: Global Spine Biologics Industry Revenue Million Forecast, by End User 2019 & 2032
- Table 4: Global Spine Biologics Industry Revenue Million Forecast, by Region 2019 & 2032
- Table 5: Global Spine Biologics Industry Revenue Million Forecast, by Country 2019 & 2032
- Table 6: United States Spine Biologics Industry Revenue (Million) Forecast, by Application 2019 & 2032
- Table 7: Canada Spine Biologics Industry Revenue (Million) Forecast, by Application 2019 & 2032
- Table 8: Mexico Spine Biologics Industry Revenue (Million) Forecast, by Application 2019 & 2032
- Table 9: Global Spine Biologics Industry Revenue Million Forecast, by Country 2019 & 2032
- Table 10: Germany Spine Biologics Industry Revenue (Million) Forecast, by Application 2019 & 2032
- Table 11: United Kingdom Spine Biologics Industry Revenue (Million) Forecast, by Application 2019 & 2032
- Table 12: France Spine Biologics Industry Revenue (Million) Forecast, by Application 2019 & 2032
- Table 13: Italy Spine Biologics Industry Revenue (Million) Forecast, by Application 2019 & 2032
- Table 14: Spain Spine Biologics Industry Revenue (Million) Forecast, by Application 2019 & 2032
- Table 15: Rest of Europe Spine Biologics Industry Revenue (Million) Forecast, by Application 2019 & 2032
- Table 16: Global Spine Biologics Industry Revenue Million Forecast, by Country 2019 & 2032
- Table 17: China Spine Biologics Industry Revenue (Million) Forecast, by Application 2019 & 2032
- Table 18: Japan Spine Biologics Industry Revenue (Million) Forecast, by Application 2019 & 2032
- Table 19: India Spine Biologics Industry Revenue (Million) Forecast, by Application 2019 & 2032
- Table 20: Australia Spine Biologics Industry Revenue (Million) Forecast, by Application 2019 & 2032
- Table 21: South Korea Spine Biologics Industry Revenue (Million) Forecast, by Application 2019 & 2032
- Table 22: Rest of Asia Pacific Spine Biologics Industry Revenue (Million) Forecast, by Application 2019 & 2032
- Table 23: Global Spine Biologics Industry Revenue Million Forecast, by Country 2019 & 2032
- Table 24: GCC Spine Biologics Industry Revenue (Million) Forecast, by Application 2019 & 2032
- Table 25: South Africa Spine Biologics Industry Revenue (Million) Forecast, by Application 2019 & 2032
- Table 26: Rest of Middle East and Africa Spine Biologics Industry Revenue (Million) Forecast, by Application 2019 & 2032
- Table 27: Global Spine Biologics Industry Revenue Million Forecast, by Country 2019 & 2032
- Table 28: Brazil Spine Biologics Industry Revenue (Million) Forecast, by Application 2019 & 2032
- Table 29: Argentina Spine Biologics Industry Revenue (Million) Forecast, by Application 2019 & 2032
- Table 30: Rest of South America Spine Biologics Industry Revenue (Million) Forecast, by Application 2019 & 2032
- Table 31: Global Spine Biologics Industry Revenue Million Forecast, by Product 2019 & 2032
- Table 32: Global Spine Biologics Industry Revenue Million Forecast, by End User 2019 & 2032
- Table 33: Global Spine Biologics Industry Revenue Million Forecast, by Country 2019 & 2032
- Table 34: United States Spine Biologics Industry Revenue (Million) Forecast, by Application 2019 & 2032
- Table 35: Canada Spine Biologics Industry Revenue (Million) Forecast, by Application 2019 & 2032
- Table 36: Mexico Spine Biologics Industry Revenue (Million) Forecast, by Application 2019 & 2032
- Table 37: Global Spine Biologics Industry Revenue Million Forecast, by Product 2019 & 2032
- Table 38: Global Spine Biologics Industry Revenue Million Forecast, by End User 2019 & 2032
- Table 39: Global Spine Biologics Industry Revenue Million Forecast, by Country 2019 & 2032
- Table 40: Germany Spine Biologics Industry Revenue (Million) Forecast, by Application 2019 & 2032
- Table 41: United Kingdom Spine Biologics Industry Revenue (Million) Forecast, by Application 2019 & 2032
- Table 42: France Spine Biologics Industry Revenue (Million) Forecast, by Application 2019 & 2032
- Table 43: Italy Spine Biologics Industry Revenue (Million) Forecast, by Application 2019 & 2032
- Table 44: Spain Spine Biologics Industry Revenue (Million) Forecast, by Application 2019 & 2032
- Table 45: Rest of Europe Spine Biologics Industry Revenue (Million) Forecast, by Application 2019 & 2032
- Table 46: Global Spine Biologics Industry Revenue Million Forecast, by Product 2019 & 2032
- Table 47: Global Spine Biologics Industry Revenue Million Forecast, by End User 2019 & 2032
- Table 48: Global Spine Biologics Industry Revenue Million Forecast, by Country 2019 & 2032
- Table 49: China Spine Biologics Industry Revenue (Million) Forecast, by Application 2019 & 2032
- Table 50: Japan Spine Biologics Industry Revenue (Million) Forecast, by Application 2019 & 2032
- Table 51: India Spine Biologics Industry Revenue (Million) Forecast, by Application 2019 & 2032
- Table 52: Australia Spine Biologics Industry Revenue (Million) Forecast, by Application 2019 & 2032
- Table 53: South Korea Spine Biologics Industry Revenue (Million) Forecast, by Application 2019 & 2032
- Table 54: Rest of Asia Pacific Spine Biologics Industry Revenue (Million) Forecast, by Application 2019 & 2032
- Table 55: Global Spine Biologics Industry Revenue Million Forecast, by Product 2019 & 2032
- Table 56: Global Spine Biologics Industry Revenue Million Forecast, by End User 2019 & 2032
- Table 57: Global Spine Biologics Industry Revenue Million Forecast, by Country 2019 & 2032
- Table 58: GCC Spine Biologics Industry Revenue (Million) Forecast, by Application 2019 & 2032
- Table 59: South Africa Spine Biologics Industry Revenue (Million) Forecast, by Application 2019 & 2032
- Table 60: Rest of Middle East and Africa Spine Biologics Industry Revenue (Million) Forecast, by Application 2019 & 2032
- Table 61: Global Spine Biologics Industry Revenue Million Forecast, by Product 2019 & 2032
- Table 62: Global Spine Biologics Industry Revenue Million Forecast, by End User 2019 & 2032
- Table 63: Global Spine Biologics Industry Revenue Million Forecast, by Country 2019 & 2032
- Table 64: Brazil Spine Biologics Industry Revenue (Million) Forecast, by Application 2019 & 2032
- Table 65: Argentina Spine Biologics Industry Revenue (Million) Forecast, by Application 2019 & 2032
- Table 66: Rest of South America Spine Biologics Industry Revenue (Million) Forecast, by Application 2019 & 2032
Frequently Asked Questions
1. What is the projected Compound Annual Growth Rate (CAGR) of the Spine Biologics Industry?
The projected CAGR is approximately 4.00%.
2. Which companies are prominent players in the Spine Biologics Industry?
Key companies in the market include Arthrex Inc, Exactech Inc, Spine Wave Inc, Johnson And Johnson (Depuy Synthes), Orthofix Medical Inc, NuVasive Inc , Stryker Corporation, Zimmer Biomet, Medtronic plc.
3. What are the main segments of the Spine Biologics Industry?
The market segments include Product, End User.
4. Can you provide details about the market size?
The market size is estimated to be USD XX Million as of 2022.
5. What are some drivers contributing to market growth?
; Growing Geriatric Population; Growing Prevalence of Spine Deformities; Technological Advancements.
6. What are the notable trends driving market growth?
Spinal Allografts in Spinal Biologics is Estimated to Witness a Healthy Growth in Future.
7. Are there any restraints impacting market growth?
; Reimbursement Policies.
8. Can you provide examples of recent developments in the market?
N/A
9. What pricing options are available for accessing the report?
Pricing options include single-user, multi-user, and enterprise licenses priced at USD 4750, USD 5250, and USD 8750 respectively.
10. Is the market size provided in terms of value or volume?
The market size is provided in terms of value, measured in Million.
11. Are there any specific market keywords associated with the report?
Yes, the market keyword associated with the report is "Spine Biologics Industry," which aids in identifying and referencing the specific market segment covered.
12. How do I determine which pricing option suits my needs best?
The pricing options vary based on user requirements and access needs. Individual users may opt for single-user licenses, while businesses requiring broader access may choose multi-user or enterprise licenses for cost-effective access to the report.
13. Are there any additional resources or data provided in the Spine Biologics Industry report?
While the report offers comprehensive insights, it's advisable to review the specific contents or supplementary materials provided to ascertain if additional resources or data are available.
14. How can I stay updated on further developments or reports in the Spine Biologics Industry?
To stay informed about further developments, trends, and reports in the Spine Biologics Industry, consider subscribing to industry newsletters, following relevant companies and organizations, or regularly checking reputable industry news sources and publications.
Methodology
Step 1 - Identification of Relevant Samples Size from Population Database


Step 2 - Approaches for Defining Global Market Size (Value, Volume* & Price*)

Note*: In applicable scenarios
Step 3 - Data Sources
Primary Research
- Web Analytics
- Survey Reports
- Research Institute
- Latest Research Reports
- Opinion Leaders
Secondary Research
- Annual Reports
- White Paper
- Latest Press Release
- Industry Association
- Paid Database
- Investor Presentations

Step 4 - Data Triangulation
Involves using different sources of information in order to increase the validity of a study
These sources are likely to be stakeholders in a program - participants, other researchers, program staff, other community members, and so on.
Then we put all data in single framework & apply various statistical tools to find out the dynamic on the market.
During the analysis stage, feedback from the stakeholder groups would be compared to determine areas of agreement as well as areas of divergence
