

Key Insights
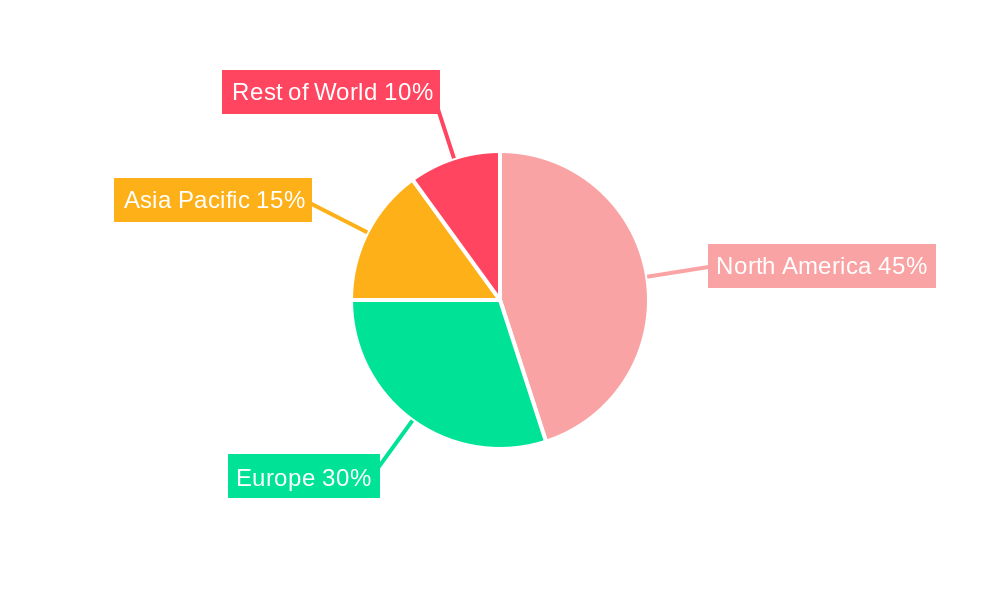
The Spinal Muscular Atrophy (SMA) medicine market is experiencing robust growth, driven by a rising prevalence of SMA, advancements in gene therapy and drug development, and increasing awareness among healthcare professionals and patients. The market's Compound Annual Growth Rate (CAGR) of 14.50% from 2019 to 2024 suggests a significant expansion, indicating strong market potential for the coming years. This growth is fueled by the approval and increasing adoption of novel therapies, particularly those based on gene replacement strategies, offering improved treatment outcomes and extending patient lifespans. Intrathecal administration is expected to witness higher growth compared to oral administration due to its efficacy in delivering drugs directly to the spinal cord. Furthermore, the market is segmented by various treatment types, including gene replacement therapy and drug therapy, with gene replacement therapies holding a dominant market share because of their ability to address the root cause of SMA. The leading players – Novartis, Biogen, Roche, and others – are actively investing in research and development, further accelerating market growth through the introduction of innovative and highly effective treatments. Geographical variations exist, with North America and Europe currently holding larger market shares due to higher healthcare expenditure and advanced healthcare infrastructure; however, the Asia-Pacific region is projected to witness substantial growth in the coming years due to increasing healthcare awareness and growing disposable incomes.
The competitive landscape is characterized by intense research and development activity, leading to a pipeline of promising new therapies. The market's future growth will be influenced by factors such as pricing strategies, reimbursement policies, ongoing clinical trials investigating newer treatment modalities, and the emergence of biosimilars. Success in these areas will depend on companies' abilities to deliver effective and affordable treatments, navigate regulatory hurdles, and address the unmet needs of SMA patients. While challenges such as high treatment costs and limited access to therapy in certain regions remain, the overall outlook for the SMA medicine market is positive, with significant opportunities for continued expansion and innovation in the years to come. Successful clinical trials focusing on earlier diagnosis and expanded patient populations will drive additional growth in the coming years.
Spinal Muscular Atrophy (SMA) Medicine Industry Market Report: 2019-2033
A Comprehensive Analysis of Market Dynamics, Trends, and Growth Opportunities
This comprehensive report provides an in-depth analysis of the Spinal Muscular Atrophy (SMA) medicine industry, offering crucial insights for stakeholders, investors, and industry professionals. With a detailed study period spanning 2019-2033 (Base Year: 2025, Forecast Period: 2025-2033), this report leverages extensive market research to provide a data-driven perspective on current trends and future projections. The global SMA medicine market is estimated to reach xx Million by 2033, showcasing significant growth potential.
Spinal Muscular Atrophy Medicine Industry Market Dynamics & Concentration
The SMA medicine market is characterized by a dynamic interplay of factors influencing its growth and concentration. Market concentration is currently [Insert Market Concentration Metric, e.g., moderately high, with a few key players holding significant market share]. Innovation is a major driver, with ongoing research and development focused on novel therapies like gene replacement therapies and improved drug delivery mechanisms. Stringent regulatory frameworks, particularly regarding drug approvals, significantly influence market entry and product lifecycles. The existence of limited therapeutic options creates a high barrier to entry, resulting in a competitive landscape dominated by established pharmaceutical companies. The emergence of biosimilars and potential substitute therapies presents a long-term challenge. End-user trends, driven by increasing awareness and improved diagnosis rates, contribute to market growth. M&A activity has been moderate in recent years, with [Insert Number] significant deals recorded between 2019 and 2024, primarily focused on strengthening R&D pipelines and expanding market access. Key players are actively pursuing strategic partnerships to enhance their market positions.
Spinal Muscular Atrophy Medicine Industry Industry Trends & Analysis
The SMA medicine market is experiencing robust growth, projected at a CAGR of xx% during the forecast period (2025-2033). This growth is propelled by several factors. Firstly, a rising prevalence of SMA globally, coupled with enhanced diagnostic capabilities, is leading to a significant increase in the patient pool. Secondly, technological advancements in gene therapy and drug development have resulted in the introduction of highly effective treatments, significantly improving patient outcomes. Thirdly, favorable reimbursement policies and increasing healthcare spending are contributing to greater market access. However, the high cost of these therapies, coupled with ongoing clinical trials and research, remains a potential barrier to widespread adoption. Market penetration is still relatively low, with [Insert Percentage] of the eligible population receiving treatment, highlighting a significant unmet need and potential for future growth. Competitive dynamics are shaped by intense R&D activities, with companies striving to develop differentiated therapies and expand their market share.
Leading Markets & Segments in Spinal Muscular Atrophy Medicine Industry
The North American market currently holds the largest share of the global SMA medicine market, driven by factors such as high healthcare expenditure, robust regulatory frameworks supporting new drug approvals, and the presence of a significant patient population.
Key Drivers for North American Dominance:
- Strong healthcare infrastructure and well-established regulatory pathways.
- High level of awareness and early diagnosis rates.
- Significant investment in R&D and clinical trials.
Segment Analysis:
- By Route of Administration: Intrathecal administration currently dominates, but oral therapies are gaining traction due to improved patient convenience and reduced invasiveness.
- By Type: [Insert Type 1, Type 2, Type 3, Type 4 specifics and market share estimations if available. Otherwise use placeholder like "Type 1 holds the largest market share, followed by Type 2, and so on."]
- By Procedure: Gene replacement therapy is gaining rapid adoption due to its potential for long-term efficacy, while drug therapy remains a significant segment, particularly for certain patient subgroups. Other procedures account for a relatively small proportion of the market.
Spinal Muscular Atrophy Medicine Industry Product Developments
Recent years have witnessed significant advancements in SMA treatment. The development of highly effective gene therapies, such as nusinersen and onasemnogene abeparvovec-xioi, has revolutionized treatment paradigms, offering improved survival rates and quality of life. Novel drug therapies are also emerging, focusing on specific disease mechanisms and potentially offering alternative treatment pathways. These advancements are accompanied by ongoing research into improving drug delivery methods and developing more personalized treatment strategies based on patient genetics and disease severity. This focus on innovation is driving the market's overall expansion and enhancing therapeutic options for individuals with SMA.
Key Drivers of Spinal Muscular Atrophy Medicine Industry Growth
Several key factors are propelling the growth of the SMA medicine market. Technological advancements, particularly in gene therapy and precision medicine, are generating novel and highly effective treatments. Increased awareness and improved diagnostic capabilities are leading to earlier detection and treatment initiation. Favorable regulatory environments in key markets are facilitating faster approval processes for new therapies. Growing healthcare spending and increased government funding for research and development are further contributing to market expansion.
Challenges in the Spinal Muscular Atrophy Medicine Industry Market
Despite significant progress, several challenges persist within the SMA medicine market. The high cost of therapies, particularly gene therapies, poses a major barrier to wider access. Regulatory hurdles and complex approval processes can delay market entry for new products. Supply chain disruptions, particularly during the COVID-19 pandemic, could impact the availability and affordability of treatments. The intense competition amongst pharmaceutical companies can further constrain pricing and market penetration. The overall market size for SMA treatments may remain comparatively smaller compared to other therapeutic areas.
Emerging Opportunities in Spinal Muscular Atrophy Medicine Industry
The future of the SMA medicine market is promising. Continued advancements in gene editing technologies and personalized medicine hold the potential to create more effective and targeted therapies. Strategic partnerships between pharmaceutical companies and research institutions can accelerate drug development and market access. Expansion into emerging markets, particularly in developing countries, presents a significant opportunity for market growth, once affordability issues are resolved. This expansion will require targeted efforts and collaborative initiatives.
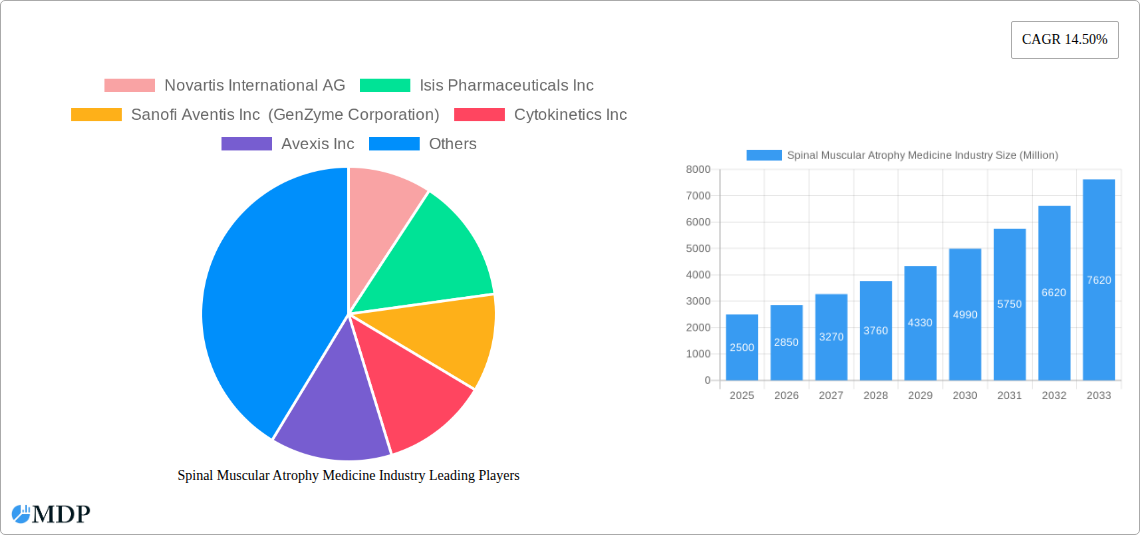
Leading Players in the Spinal Muscular Atrophy Medicine Industry Sector
- Novartis International AG
- Isis Pharmaceuticals Inc
- Sanofi Aventis Inc (GenZyme Corporation)
- Cytokinetics Inc
- Avexis Inc
- Biogen Inc
- Catalyst Pharmaceutical
- F Hoffmann - La Roche Ltd
- Chugai Pharmaceutical
- Pfizer Inc
Key Milestones in Spinal Muscular Atrophy Medicine Industry Industry
- August 2021: Novartis announced the lift of a partial clinical trial hold and planned to initiate a new, pivotal Phase 3 study of intrathecal OAV-101 in older patients with spinal muscular atrophy. This signifies a step forward in expanding treatment options.
- July 2021: Roche launched prescription medicine Evrysdi in India, expanding market access to a significant population. This milestone demonstrates efforts towards global accessibility of treatment.
Strategic Outlook for Spinal Muscular Atrophy Medicine Market
The SMA medicine market is poised for substantial growth over the next decade. Continued innovation in gene therapies, precision medicine, and drug delivery systems will drive market expansion. Strategic partnerships and collaborations will play a crucial role in accelerating the development and commercialization of new therapies. Addressing affordability challenges and expanding access to treatment in under-served populations will be crucial for unlocking the full market potential. Focus on early diagnosis and patient education will also play an important role in future growth.
Spinal Muscular Atrophy Medicine Industry Segmentation
-
1. Type
- 1.1. Type 1
- 1.2. Type 2
- 1.3. Type 3
- 1.4. Type 4
-
2. Procedure
- 2.1. Gene Replacement Therapy
- 2.2. Drug Therapy
- 2.3. Other Procedures
-
3. Route of Administration
- 3.1. Oral
- 3.2. Intrathecal
Spinal Muscular Atrophy Medicine Industry Segmentation By Geography
-
1. North America
- 1.1. United States
- 1.2. Canada
- 1.3. Mexico
-
2. Europe
- 2.1. Germany
- 2.2. United Kingdom
- 2.3. France
- 2.4. Italy
- 2.5. Spain
- 2.6. Rest of Europe
-
3. Asia Pacific
- 3.1. China
- 3.2. Japan
- 3.3. India
- 3.4. Australia
- 3.5. South Korea
- 3.6. Rest of Asia Pacific
-
4. Middle East and Africa
- 4.1. GCC
- 4.2. South Africa
- 4.3. Rest of Middle East and Africa
-
5. South America
- 5.1. Brazil
- 5.2. Argentina
- 5.3. Rest of South America
Spinal Muscular Atrophy Medicine Industry REPORT HIGHLIGHTS
| Aspects | Details |
|---|---|
| Study Period | 2019-2033 |
| Base Year | 2024 |
| Estimated Year | 2025 |
| Forecast Period | 2025-2033 |
| Historical Period | 2019-2024 |
| Growth Rate | CAGR of 14.50% from 2019-2033 |
| Segmentation |
|
Table of Contents
- 1. Introduction
- 1.1. Research Scope
- 1.2. Market Segmentation
- 1.3. Research Methodology
- 1.4. Definitions and Assumptions
- 2. Executive Summary
- 2.1. Introduction
- 3. Market Dynamics
- 3.1. Introduction
- 3.2. Market Drivers
- 3.2.1 Growing Awareness Regarding Spinal Muscular Atrophy
- 3.2.2 Its Diagnostics
- 3.2.3 and Its Treatment; Rise in the Government Initiatives to Improve Healthcare Infrastructure; Increasing R&D Activities to Develop Novel Treatment Regimens for Rare Diseases
- 3.3. Market Restrains
- 3.3.1. High Cost of Treatment; Lack of Skilled Professionals for Surgical Procedures and Physiotherapy Regimens
- 3.4. Market Trends
- 3.4.1 The Gene Replacement Therapy Segment Dominates the Market
- 3.4.2 and the Same is Expected Over the Forecast Period
- 4. Market Factor Analysis
- 4.1. Porters Five Forces
- 4.2. Supply/Value Chain
- 4.3. PESTEL analysis
- 4.4. Market Entropy
- 4.5. Patent/Trademark Analysis
- 5. Global Spinal Muscular Atrophy Medicine Industry Analysis, Insights and Forecast, 2019-2031
- 5.1. Market Analysis, Insights and Forecast - by Type
- 5.1.1. Type 1
- 5.1.2. Type 2
- 5.1.3. Type 3
- 5.1.4. Type 4
- 5.2. Market Analysis, Insights and Forecast - by Procedure
- 5.2.1. Gene Replacement Therapy
- 5.2.2. Drug Therapy
- 5.2.3. Other Procedures
- 5.3. Market Analysis, Insights and Forecast - by Route of Administration
- 5.3.1. Oral
- 5.3.2. Intrathecal
- 5.4. Market Analysis, Insights and Forecast - by Region
- 5.4.1. North America
- 5.4.2. Europe
- 5.4.3. Asia Pacific
- 5.4.4. Middle East and Africa
- 5.4.5. South America
- 5.1. Market Analysis, Insights and Forecast - by Type
- 6. North America Spinal Muscular Atrophy Medicine Industry Analysis, Insights and Forecast, 2019-2031
- 6.1. Market Analysis, Insights and Forecast - by Type
- 6.1.1. Type 1
- 6.1.2. Type 2
- 6.1.3. Type 3
- 6.1.4. Type 4
- 6.2. Market Analysis, Insights and Forecast - by Procedure
- 6.2.1. Gene Replacement Therapy
- 6.2.2. Drug Therapy
- 6.2.3. Other Procedures
- 6.3. Market Analysis, Insights and Forecast - by Route of Administration
- 6.3.1. Oral
- 6.3.2. Intrathecal
- 6.1. Market Analysis, Insights and Forecast - by Type
- 7. Europe Spinal Muscular Atrophy Medicine Industry Analysis, Insights and Forecast, 2019-2031
- 7.1. Market Analysis, Insights and Forecast - by Type
- 7.1.1. Type 1
- 7.1.2. Type 2
- 7.1.3. Type 3
- 7.1.4. Type 4
- 7.2. Market Analysis, Insights and Forecast - by Procedure
- 7.2.1. Gene Replacement Therapy
- 7.2.2. Drug Therapy
- 7.2.3. Other Procedures
- 7.3. Market Analysis, Insights and Forecast - by Route of Administration
- 7.3.1. Oral
- 7.3.2. Intrathecal
- 7.1. Market Analysis, Insights and Forecast - by Type
- 8. Asia Pacific Spinal Muscular Atrophy Medicine Industry Analysis, Insights and Forecast, 2019-2031
- 8.1. Market Analysis, Insights and Forecast - by Type
- 8.1.1. Type 1
- 8.1.2. Type 2
- 8.1.3. Type 3
- 8.1.4. Type 4
- 8.2. Market Analysis, Insights and Forecast - by Procedure
- 8.2.1. Gene Replacement Therapy
- 8.2.2. Drug Therapy
- 8.2.3. Other Procedures
- 8.3. Market Analysis, Insights and Forecast - by Route of Administration
- 8.3.1. Oral
- 8.3.2. Intrathecal
- 8.1. Market Analysis, Insights and Forecast - by Type
- 9. Middle East and Africa Spinal Muscular Atrophy Medicine Industry Analysis, Insights and Forecast, 2019-2031
- 9.1. Market Analysis, Insights and Forecast - by Type
- 9.1.1. Type 1
- 9.1.2. Type 2
- 9.1.3. Type 3
- 9.1.4. Type 4
- 9.2. Market Analysis, Insights and Forecast - by Procedure
- 9.2.1. Gene Replacement Therapy
- 9.2.2. Drug Therapy
- 9.2.3. Other Procedures
- 9.3. Market Analysis, Insights and Forecast - by Route of Administration
- 9.3.1. Oral
- 9.3.2. Intrathecal
- 9.1. Market Analysis, Insights and Forecast - by Type
- 10. South America Spinal Muscular Atrophy Medicine Industry Analysis, Insights and Forecast, 2019-2031
- 10.1. Market Analysis, Insights and Forecast - by Type
- 10.1.1. Type 1
- 10.1.2. Type 2
- 10.1.3. Type 3
- 10.1.4. Type 4
- 10.2. Market Analysis, Insights and Forecast - by Procedure
- 10.2.1. Gene Replacement Therapy
- 10.2.2. Drug Therapy
- 10.2.3. Other Procedures
- 10.3. Market Analysis, Insights and Forecast - by Route of Administration
- 10.3.1. Oral
- 10.3.2. Intrathecal
- 10.1. Market Analysis, Insights and Forecast - by Type
- 11. North America Spinal Muscular Atrophy Medicine Industry Analysis, Insights and Forecast, 2019-2031
- 11.1. Market Analysis, Insights and Forecast - By Country/Sub-region
- 11.1.1 United States
- 11.1.2 Canada
- 11.1.3 Mexico
- 12. Europe Spinal Muscular Atrophy Medicine Industry Analysis, Insights and Forecast, 2019-2031
- 12.1. Market Analysis, Insights and Forecast - By Country/Sub-region
- 12.1.1 Germany
- 12.1.2 United Kingdom
- 12.1.3 France
- 12.1.4 Italy
- 12.1.5 Spain
- 12.1.6 Rest of Europe
- 13. Asia Pacific Spinal Muscular Atrophy Medicine Industry Analysis, Insights and Forecast, 2019-2031
- 13.1. Market Analysis, Insights and Forecast - By Country/Sub-region
- 13.1.1 China
- 13.1.2 Japan
- 13.1.3 India
- 13.1.4 Australia
- 13.1.5 South Korea
- 13.1.6 Rest of Asia Pacific
- 14. Middle East and Africa Spinal Muscular Atrophy Medicine Industry Analysis, Insights and Forecast, 2019-2031
- 14.1. Market Analysis, Insights and Forecast - By Country/Sub-region
- 14.1.1 GCC
- 14.1.2 South Africa
- 14.1.3 Rest of Middle East and Africa
- 15. South America Spinal Muscular Atrophy Medicine Industry Analysis, Insights and Forecast, 2019-2031
- 15.1. Market Analysis, Insights and Forecast - By Country/Sub-region
- 15.1.1 Brazil
- 15.1.2 Argentina
- 15.1.3 Rest of South America
- 16. Competitive Analysis
- 16.1. Global Market Share Analysis 2024
- 16.2. Company Profiles
- 16.2.1 Novartis International AG
- 16.2.1.1. Overview
- 16.2.1.2. Products
- 16.2.1.3. SWOT Analysis
- 16.2.1.4. Recent Developments
- 16.2.1.5. Financials (Based on Availability)
- 16.2.2 Isis Pharmaceuticals Inc
- 16.2.2.1. Overview
- 16.2.2.2. Products
- 16.2.2.3. SWOT Analysis
- 16.2.2.4. Recent Developments
- 16.2.2.5. Financials (Based on Availability)
- 16.2.3 Sanofi Aventis Inc (GenZyme Corporation)
- 16.2.3.1. Overview
- 16.2.3.2. Products
- 16.2.3.3. SWOT Analysis
- 16.2.3.4. Recent Developments
- 16.2.3.5. Financials (Based on Availability)
- 16.2.4 Cytokinetics Inc
- 16.2.4.1. Overview
- 16.2.4.2. Products
- 16.2.4.3. SWOT Analysis
- 16.2.4.4. Recent Developments
- 16.2.4.5. Financials (Based on Availability)
- 16.2.5 Avexis Inc
- 16.2.5.1. Overview
- 16.2.5.2. Products
- 16.2.5.3. SWOT Analysis
- 16.2.5.4. Recent Developments
- 16.2.5.5. Financials (Based on Availability)
- 16.2.6 Biogen Inc
- 16.2.6.1. Overview
- 16.2.6.2. Products
- 16.2.6.3. SWOT Analysis
- 16.2.6.4. Recent Developments
- 16.2.6.5. Financials (Based on Availability)
- 16.2.7 Catalyst Pharmaceutical
- 16.2.7.1. Overview
- 16.2.7.2. Products
- 16.2.7.3. SWOT Analysis
- 16.2.7.4. Recent Developments
- 16.2.7.5. Financials (Based on Availability)
- 16.2.8 F Hoffmann - La Roche Ltd
- 16.2.8.1. Overview
- 16.2.8.2. Products
- 16.2.8.3. SWOT Analysis
- 16.2.8.4. Recent Developments
- 16.2.8.5. Financials (Based on Availability)
- 16.2.9 Chugai Pharmaceutical
- 16.2.9.1. Overview
- 16.2.9.2. Products
- 16.2.9.3. SWOT Analysis
- 16.2.9.4. Recent Developments
- 16.2.9.5. Financials (Based on Availability)
- 16.2.10 Pfizer Inc
- 16.2.10.1. Overview
- 16.2.10.2. Products
- 16.2.10.3. SWOT Analysis
- 16.2.10.4. Recent Developments
- 16.2.10.5. Financials (Based on Availability)
- 16.2.1 Novartis International AG
List of Figures
- Figure 1: Global Spinal Muscular Atrophy Medicine Industry Revenue Breakdown (Million, %) by Region 2024 & 2032
- Figure 2: Global Spinal Muscular Atrophy Medicine Industry Volume Breakdown (K Unit, %) by Region 2024 & 2032
- Figure 3: North America Spinal Muscular Atrophy Medicine Industry Revenue (Million), by Country 2024 & 2032
- Figure 4: North America Spinal Muscular Atrophy Medicine Industry Volume (K Unit), by Country 2024 & 2032
- Figure 5: North America Spinal Muscular Atrophy Medicine Industry Revenue Share (%), by Country 2024 & 2032
- Figure 6: North America Spinal Muscular Atrophy Medicine Industry Volume Share (%), by Country 2024 & 2032
- Figure 7: Europe Spinal Muscular Atrophy Medicine Industry Revenue (Million), by Country 2024 & 2032
- Figure 8: Europe Spinal Muscular Atrophy Medicine Industry Volume (K Unit), by Country 2024 & 2032
- Figure 9: Europe Spinal Muscular Atrophy Medicine Industry Revenue Share (%), by Country 2024 & 2032
- Figure 10: Europe Spinal Muscular Atrophy Medicine Industry Volume Share (%), by Country 2024 & 2032
- Figure 11: Asia Pacific Spinal Muscular Atrophy Medicine Industry Revenue (Million), by Country 2024 & 2032
- Figure 12: Asia Pacific Spinal Muscular Atrophy Medicine Industry Volume (K Unit), by Country 2024 & 2032
- Figure 13: Asia Pacific Spinal Muscular Atrophy Medicine Industry Revenue Share (%), by Country 2024 & 2032
- Figure 14: Asia Pacific Spinal Muscular Atrophy Medicine Industry Volume Share (%), by Country 2024 & 2032
- Figure 15: Middle East and Africa Spinal Muscular Atrophy Medicine Industry Revenue (Million), by Country 2024 & 2032
- Figure 16: Middle East and Africa Spinal Muscular Atrophy Medicine Industry Volume (K Unit), by Country 2024 & 2032
- Figure 17: Middle East and Africa Spinal Muscular Atrophy Medicine Industry Revenue Share (%), by Country 2024 & 2032
- Figure 18: Middle East and Africa Spinal Muscular Atrophy Medicine Industry Volume Share (%), by Country 2024 & 2032
- Figure 19: South America Spinal Muscular Atrophy Medicine Industry Revenue (Million), by Country 2024 & 2032
- Figure 20: South America Spinal Muscular Atrophy Medicine Industry Volume (K Unit), by Country 2024 & 2032
- Figure 21: South America Spinal Muscular Atrophy Medicine Industry Revenue Share (%), by Country 2024 & 2032
- Figure 22: South America Spinal Muscular Atrophy Medicine Industry Volume Share (%), by Country 2024 & 2032
- Figure 23: North America Spinal Muscular Atrophy Medicine Industry Revenue (Million), by Type 2024 & 2032
- Figure 24: North America Spinal Muscular Atrophy Medicine Industry Volume (K Unit), by Type 2024 & 2032
- Figure 25: North America Spinal Muscular Atrophy Medicine Industry Revenue Share (%), by Type 2024 & 2032
- Figure 26: North America Spinal Muscular Atrophy Medicine Industry Volume Share (%), by Type 2024 & 2032
- Figure 27: North America Spinal Muscular Atrophy Medicine Industry Revenue (Million), by Procedure 2024 & 2032
- Figure 28: North America Spinal Muscular Atrophy Medicine Industry Volume (K Unit), by Procedure 2024 & 2032
- Figure 29: North America Spinal Muscular Atrophy Medicine Industry Revenue Share (%), by Procedure 2024 & 2032
- Figure 30: North America Spinal Muscular Atrophy Medicine Industry Volume Share (%), by Procedure 2024 & 2032
- Figure 31: North America Spinal Muscular Atrophy Medicine Industry Revenue (Million), by Route of Administration 2024 & 2032
- Figure 32: North America Spinal Muscular Atrophy Medicine Industry Volume (K Unit), by Route of Administration 2024 & 2032
- Figure 33: North America Spinal Muscular Atrophy Medicine Industry Revenue Share (%), by Route of Administration 2024 & 2032
- Figure 34: North America Spinal Muscular Atrophy Medicine Industry Volume Share (%), by Route of Administration 2024 & 2032
- Figure 35: North America Spinal Muscular Atrophy Medicine Industry Revenue (Million), by Country 2024 & 2032
- Figure 36: North America Spinal Muscular Atrophy Medicine Industry Volume (K Unit), by Country 2024 & 2032
- Figure 37: North America Spinal Muscular Atrophy Medicine Industry Revenue Share (%), by Country 2024 & 2032
- Figure 38: North America Spinal Muscular Atrophy Medicine Industry Volume Share (%), by Country 2024 & 2032
- Figure 39: Europe Spinal Muscular Atrophy Medicine Industry Revenue (Million), by Type 2024 & 2032
- Figure 40: Europe Spinal Muscular Atrophy Medicine Industry Volume (K Unit), by Type 2024 & 2032
- Figure 41: Europe Spinal Muscular Atrophy Medicine Industry Revenue Share (%), by Type 2024 & 2032
- Figure 42: Europe Spinal Muscular Atrophy Medicine Industry Volume Share (%), by Type 2024 & 2032
- Figure 43: Europe Spinal Muscular Atrophy Medicine Industry Revenue (Million), by Procedure 2024 & 2032
- Figure 44: Europe Spinal Muscular Atrophy Medicine Industry Volume (K Unit), by Procedure 2024 & 2032
- Figure 45: Europe Spinal Muscular Atrophy Medicine Industry Revenue Share (%), by Procedure 2024 & 2032
- Figure 46: Europe Spinal Muscular Atrophy Medicine Industry Volume Share (%), by Procedure 2024 & 2032
- Figure 47: Europe Spinal Muscular Atrophy Medicine Industry Revenue (Million), by Route of Administration 2024 & 2032
- Figure 48: Europe Spinal Muscular Atrophy Medicine Industry Volume (K Unit), by Route of Administration 2024 & 2032
- Figure 49: Europe Spinal Muscular Atrophy Medicine Industry Revenue Share (%), by Route of Administration 2024 & 2032
- Figure 50: Europe Spinal Muscular Atrophy Medicine Industry Volume Share (%), by Route of Administration 2024 & 2032
- Figure 51: Europe Spinal Muscular Atrophy Medicine Industry Revenue (Million), by Country 2024 & 2032
- Figure 52: Europe Spinal Muscular Atrophy Medicine Industry Volume (K Unit), by Country 2024 & 2032
- Figure 53: Europe Spinal Muscular Atrophy Medicine Industry Revenue Share (%), by Country 2024 & 2032
- Figure 54: Europe Spinal Muscular Atrophy Medicine Industry Volume Share (%), by Country 2024 & 2032
- Figure 55: Asia Pacific Spinal Muscular Atrophy Medicine Industry Revenue (Million), by Type 2024 & 2032
- Figure 56: Asia Pacific Spinal Muscular Atrophy Medicine Industry Volume (K Unit), by Type 2024 & 2032
- Figure 57: Asia Pacific Spinal Muscular Atrophy Medicine Industry Revenue Share (%), by Type 2024 & 2032
- Figure 58: Asia Pacific Spinal Muscular Atrophy Medicine Industry Volume Share (%), by Type 2024 & 2032
- Figure 59: Asia Pacific Spinal Muscular Atrophy Medicine Industry Revenue (Million), by Procedure 2024 & 2032
- Figure 60: Asia Pacific Spinal Muscular Atrophy Medicine Industry Volume (K Unit), by Procedure 2024 & 2032
- Figure 61: Asia Pacific Spinal Muscular Atrophy Medicine Industry Revenue Share (%), by Procedure 2024 & 2032
- Figure 62: Asia Pacific Spinal Muscular Atrophy Medicine Industry Volume Share (%), by Procedure 2024 & 2032
- Figure 63: Asia Pacific Spinal Muscular Atrophy Medicine Industry Revenue (Million), by Route of Administration 2024 & 2032
- Figure 64: Asia Pacific Spinal Muscular Atrophy Medicine Industry Volume (K Unit), by Route of Administration 2024 & 2032
- Figure 65: Asia Pacific Spinal Muscular Atrophy Medicine Industry Revenue Share (%), by Route of Administration 2024 & 2032
- Figure 66: Asia Pacific Spinal Muscular Atrophy Medicine Industry Volume Share (%), by Route of Administration 2024 & 2032
- Figure 67: Asia Pacific Spinal Muscular Atrophy Medicine Industry Revenue (Million), by Country 2024 & 2032
- Figure 68: Asia Pacific Spinal Muscular Atrophy Medicine Industry Volume (K Unit), by Country 2024 & 2032
- Figure 69: Asia Pacific Spinal Muscular Atrophy Medicine Industry Revenue Share (%), by Country 2024 & 2032
- Figure 70: Asia Pacific Spinal Muscular Atrophy Medicine Industry Volume Share (%), by Country 2024 & 2032
- Figure 71: Middle East and Africa Spinal Muscular Atrophy Medicine Industry Revenue (Million), by Type 2024 & 2032
- Figure 72: Middle East and Africa Spinal Muscular Atrophy Medicine Industry Volume (K Unit), by Type 2024 & 2032
- Figure 73: Middle East and Africa Spinal Muscular Atrophy Medicine Industry Revenue Share (%), by Type 2024 & 2032
- Figure 74: Middle East and Africa Spinal Muscular Atrophy Medicine Industry Volume Share (%), by Type 2024 & 2032
- Figure 75: Middle East and Africa Spinal Muscular Atrophy Medicine Industry Revenue (Million), by Procedure 2024 & 2032
- Figure 76: Middle East and Africa Spinal Muscular Atrophy Medicine Industry Volume (K Unit), by Procedure 2024 & 2032
- Figure 77: Middle East and Africa Spinal Muscular Atrophy Medicine Industry Revenue Share (%), by Procedure 2024 & 2032
- Figure 78: Middle East and Africa Spinal Muscular Atrophy Medicine Industry Volume Share (%), by Procedure 2024 & 2032
- Figure 79: Middle East and Africa Spinal Muscular Atrophy Medicine Industry Revenue (Million), by Route of Administration 2024 & 2032
- Figure 80: Middle East and Africa Spinal Muscular Atrophy Medicine Industry Volume (K Unit), by Route of Administration 2024 & 2032
- Figure 81: Middle East and Africa Spinal Muscular Atrophy Medicine Industry Revenue Share (%), by Route of Administration 2024 & 2032
- Figure 82: Middle East and Africa Spinal Muscular Atrophy Medicine Industry Volume Share (%), by Route of Administration 2024 & 2032
- Figure 83: Middle East and Africa Spinal Muscular Atrophy Medicine Industry Revenue (Million), by Country 2024 & 2032
- Figure 84: Middle East and Africa Spinal Muscular Atrophy Medicine Industry Volume (K Unit), by Country 2024 & 2032
- Figure 85: Middle East and Africa Spinal Muscular Atrophy Medicine Industry Revenue Share (%), by Country 2024 & 2032
- Figure 86: Middle East and Africa Spinal Muscular Atrophy Medicine Industry Volume Share (%), by Country 2024 & 2032
- Figure 87: South America Spinal Muscular Atrophy Medicine Industry Revenue (Million), by Type 2024 & 2032
- Figure 88: South America Spinal Muscular Atrophy Medicine Industry Volume (K Unit), by Type 2024 & 2032
- Figure 89: South America Spinal Muscular Atrophy Medicine Industry Revenue Share (%), by Type 2024 & 2032
- Figure 90: South America Spinal Muscular Atrophy Medicine Industry Volume Share (%), by Type 2024 & 2032
- Figure 91: South America Spinal Muscular Atrophy Medicine Industry Revenue (Million), by Procedure 2024 & 2032
- Figure 92: South America Spinal Muscular Atrophy Medicine Industry Volume (K Unit), by Procedure 2024 & 2032
- Figure 93: South America Spinal Muscular Atrophy Medicine Industry Revenue Share (%), by Procedure 2024 & 2032
- Figure 94: South America Spinal Muscular Atrophy Medicine Industry Volume Share (%), by Procedure 2024 & 2032
- Figure 95: South America Spinal Muscular Atrophy Medicine Industry Revenue (Million), by Route of Administration 2024 & 2032
- Figure 96: South America Spinal Muscular Atrophy Medicine Industry Volume (K Unit), by Route of Administration 2024 & 2032
- Figure 97: South America Spinal Muscular Atrophy Medicine Industry Revenue Share (%), by Route of Administration 2024 & 2032
- Figure 98: South America Spinal Muscular Atrophy Medicine Industry Volume Share (%), by Route of Administration 2024 & 2032
- Figure 99: South America Spinal Muscular Atrophy Medicine Industry Revenue (Million), by Country 2024 & 2032
- Figure 100: South America Spinal Muscular Atrophy Medicine Industry Volume (K Unit), by Country 2024 & 2032
- Figure 101: South America Spinal Muscular Atrophy Medicine Industry Revenue Share (%), by Country 2024 & 2032
- Figure 102: South America Spinal Muscular Atrophy Medicine Industry Volume Share (%), by Country 2024 & 2032
List of Tables
- Table 1: Global Spinal Muscular Atrophy Medicine Industry Revenue Million Forecast, by Region 2019 & 2032
- Table 2: Global Spinal Muscular Atrophy Medicine Industry Volume K Unit Forecast, by Region 2019 & 2032
- Table 3: Global Spinal Muscular Atrophy Medicine Industry Revenue Million Forecast, by Type 2019 & 2032
- Table 4: Global Spinal Muscular Atrophy Medicine Industry Volume K Unit Forecast, by Type 2019 & 2032
- Table 5: Global Spinal Muscular Atrophy Medicine Industry Revenue Million Forecast, by Procedure 2019 & 2032
- Table 6: Global Spinal Muscular Atrophy Medicine Industry Volume K Unit Forecast, by Procedure 2019 & 2032
- Table 7: Global Spinal Muscular Atrophy Medicine Industry Revenue Million Forecast, by Route of Administration 2019 & 2032
- Table 8: Global Spinal Muscular Atrophy Medicine Industry Volume K Unit Forecast, by Route of Administration 2019 & 2032
- Table 9: Global Spinal Muscular Atrophy Medicine Industry Revenue Million Forecast, by Region 2019 & 2032
- Table 10: Global Spinal Muscular Atrophy Medicine Industry Volume K Unit Forecast, by Region 2019 & 2032
- Table 11: Global Spinal Muscular Atrophy Medicine Industry Revenue Million Forecast, by Country 2019 & 2032
- Table 12: Global Spinal Muscular Atrophy Medicine Industry Volume K Unit Forecast, by Country 2019 & 2032
- Table 13: United States Spinal Muscular Atrophy Medicine Industry Revenue (Million) Forecast, by Application 2019 & 2032
- Table 14: United States Spinal Muscular Atrophy Medicine Industry Volume (K Unit) Forecast, by Application 2019 & 2032
- Table 15: Canada Spinal Muscular Atrophy Medicine Industry Revenue (Million) Forecast, by Application 2019 & 2032
- Table 16: Canada Spinal Muscular Atrophy Medicine Industry Volume (K Unit) Forecast, by Application 2019 & 2032
- Table 17: Mexico Spinal Muscular Atrophy Medicine Industry Revenue (Million) Forecast, by Application 2019 & 2032
- Table 18: Mexico Spinal Muscular Atrophy Medicine Industry Volume (K Unit) Forecast, by Application 2019 & 2032
- Table 19: Global Spinal Muscular Atrophy Medicine Industry Revenue Million Forecast, by Country 2019 & 2032
- Table 20: Global Spinal Muscular Atrophy Medicine Industry Volume K Unit Forecast, by Country 2019 & 2032
- Table 21: Germany Spinal Muscular Atrophy Medicine Industry Revenue (Million) Forecast, by Application 2019 & 2032
- Table 22: Germany Spinal Muscular Atrophy Medicine Industry Volume (K Unit) Forecast, by Application 2019 & 2032
- Table 23: United Kingdom Spinal Muscular Atrophy Medicine Industry Revenue (Million) Forecast, by Application 2019 & 2032
- Table 24: United Kingdom Spinal Muscular Atrophy Medicine Industry Volume (K Unit) Forecast, by Application 2019 & 2032
- Table 25: France Spinal Muscular Atrophy Medicine Industry Revenue (Million) Forecast, by Application 2019 & 2032
- Table 26: France Spinal Muscular Atrophy Medicine Industry Volume (K Unit) Forecast, by Application 2019 & 2032
- Table 27: Italy Spinal Muscular Atrophy Medicine Industry Revenue (Million) Forecast, by Application 2019 & 2032
- Table 28: Italy Spinal Muscular Atrophy Medicine Industry Volume (K Unit) Forecast, by Application 2019 & 2032
- Table 29: Spain Spinal Muscular Atrophy Medicine Industry Revenue (Million) Forecast, by Application 2019 & 2032
- Table 30: Spain Spinal Muscular Atrophy Medicine Industry Volume (K Unit) Forecast, by Application 2019 & 2032
- Table 31: Rest of Europe Spinal Muscular Atrophy Medicine Industry Revenue (Million) Forecast, by Application 2019 & 2032
- Table 32: Rest of Europe Spinal Muscular Atrophy Medicine Industry Volume (K Unit) Forecast, by Application 2019 & 2032
- Table 33: Global Spinal Muscular Atrophy Medicine Industry Revenue Million Forecast, by Country 2019 & 2032
- Table 34: Global Spinal Muscular Atrophy Medicine Industry Volume K Unit Forecast, by Country 2019 & 2032
- Table 35: China Spinal Muscular Atrophy Medicine Industry Revenue (Million) Forecast, by Application 2019 & 2032
- Table 36: China Spinal Muscular Atrophy Medicine Industry Volume (K Unit) Forecast, by Application 2019 & 2032
- Table 37: Japan Spinal Muscular Atrophy Medicine Industry Revenue (Million) Forecast, by Application 2019 & 2032
- Table 38: Japan Spinal Muscular Atrophy Medicine Industry Volume (K Unit) Forecast, by Application 2019 & 2032
- Table 39: India Spinal Muscular Atrophy Medicine Industry Revenue (Million) Forecast, by Application 2019 & 2032
- Table 40: India Spinal Muscular Atrophy Medicine Industry Volume (K Unit) Forecast, by Application 2019 & 2032
- Table 41: Australia Spinal Muscular Atrophy Medicine Industry Revenue (Million) Forecast, by Application 2019 & 2032
- Table 42: Australia Spinal Muscular Atrophy Medicine Industry Volume (K Unit) Forecast, by Application 2019 & 2032
- Table 43: South Korea Spinal Muscular Atrophy Medicine Industry Revenue (Million) Forecast, by Application 2019 & 2032
- Table 44: South Korea Spinal Muscular Atrophy Medicine Industry Volume (K Unit) Forecast, by Application 2019 & 2032
- Table 45: Rest of Asia Pacific Spinal Muscular Atrophy Medicine Industry Revenue (Million) Forecast, by Application 2019 & 2032
- Table 46: Rest of Asia Pacific Spinal Muscular Atrophy Medicine Industry Volume (K Unit) Forecast, by Application 2019 & 2032
- Table 47: Global Spinal Muscular Atrophy Medicine Industry Revenue Million Forecast, by Country 2019 & 2032
- Table 48: Global Spinal Muscular Atrophy Medicine Industry Volume K Unit Forecast, by Country 2019 & 2032
- Table 49: GCC Spinal Muscular Atrophy Medicine Industry Revenue (Million) Forecast, by Application 2019 & 2032
- Table 50: GCC Spinal Muscular Atrophy Medicine Industry Volume (K Unit) Forecast, by Application 2019 & 2032
- Table 51: South Africa Spinal Muscular Atrophy Medicine Industry Revenue (Million) Forecast, by Application 2019 & 2032
- Table 52: South Africa Spinal Muscular Atrophy Medicine Industry Volume (K Unit) Forecast, by Application 2019 & 2032
- Table 53: Rest of Middle East and Africa Spinal Muscular Atrophy Medicine Industry Revenue (Million) Forecast, by Application 2019 & 2032
- Table 54: Rest of Middle East and Africa Spinal Muscular Atrophy Medicine Industry Volume (K Unit) Forecast, by Application 2019 & 2032
- Table 55: Global Spinal Muscular Atrophy Medicine Industry Revenue Million Forecast, by Country 2019 & 2032
- Table 56: Global Spinal Muscular Atrophy Medicine Industry Volume K Unit Forecast, by Country 2019 & 2032
- Table 57: Brazil Spinal Muscular Atrophy Medicine Industry Revenue (Million) Forecast, by Application 2019 & 2032
- Table 58: Brazil Spinal Muscular Atrophy Medicine Industry Volume (K Unit) Forecast, by Application 2019 & 2032
- Table 59: Argentina Spinal Muscular Atrophy Medicine Industry Revenue (Million) Forecast, by Application 2019 & 2032
- Table 60: Argentina Spinal Muscular Atrophy Medicine Industry Volume (K Unit) Forecast, by Application 2019 & 2032
- Table 61: Rest of South America Spinal Muscular Atrophy Medicine Industry Revenue (Million) Forecast, by Application 2019 & 2032
- Table 62: Rest of South America Spinal Muscular Atrophy Medicine Industry Volume (K Unit) Forecast, by Application 2019 & 2032
- Table 63: Global Spinal Muscular Atrophy Medicine Industry Revenue Million Forecast, by Type 2019 & 2032
- Table 64: Global Spinal Muscular Atrophy Medicine Industry Volume K Unit Forecast, by Type 2019 & 2032
- Table 65: Global Spinal Muscular Atrophy Medicine Industry Revenue Million Forecast, by Procedure 2019 & 2032
- Table 66: Global Spinal Muscular Atrophy Medicine Industry Volume K Unit Forecast, by Procedure 2019 & 2032
- Table 67: Global Spinal Muscular Atrophy Medicine Industry Revenue Million Forecast, by Route of Administration 2019 & 2032
- Table 68: Global Spinal Muscular Atrophy Medicine Industry Volume K Unit Forecast, by Route of Administration 2019 & 2032
- Table 69: Global Spinal Muscular Atrophy Medicine Industry Revenue Million Forecast, by Country 2019 & 2032
- Table 70: Global Spinal Muscular Atrophy Medicine Industry Volume K Unit Forecast, by Country 2019 & 2032
- Table 71: United States Spinal Muscular Atrophy Medicine Industry Revenue (Million) Forecast, by Application 2019 & 2032
- Table 72: United States Spinal Muscular Atrophy Medicine Industry Volume (K Unit) Forecast, by Application 2019 & 2032
- Table 73: Canada Spinal Muscular Atrophy Medicine Industry Revenue (Million) Forecast, by Application 2019 & 2032
- Table 74: Canada Spinal Muscular Atrophy Medicine Industry Volume (K Unit) Forecast, by Application 2019 & 2032
- Table 75: Mexico Spinal Muscular Atrophy Medicine Industry Revenue (Million) Forecast, by Application 2019 & 2032
- Table 76: Mexico Spinal Muscular Atrophy Medicine Industry Volume (K Unit) Forecast, by Application 2019 & 2032
- Table 77: Global Spinal Muscular Atrophy Medicine Industry Revenue Million Forecast, by Type 2019 & 2032
- Table 78: Global Spinal Muscular Atrophy Medicine Industry Volume K Unit Forecast, by Type 2019 & 2032
- Table 79: Global Spinal Muscular Atrophy Medicine Industry Revenue Million Forecast, by Procedure 2019 & 2032
- Table 80: Global Spinal Muscular Atrophy Medicine Industry Volume K Unit Forecast, by Procedure 2019 & 2032
- Table 81: Global Spinal Muscular Atrophy Medicine Industry Revenue Million Forecast, by Route of Administration 2019 & 2032
- Table 82: Global Spinal Muscular Atrophy Medicine Industry Volume K Unit Forecast, by Route of Administration 2019 & 2032
- Table 83: Global Spinal Muscular Atrophy Medicine Industry Revenue Million Forecast, by Country 2019 & 2032
- Table 84: Global Spinal Muscular Atrophy Medicine Industry Volume K Unit Forecast, by Country 2019 & 2032
- Table 85: Germany Spinal Muscular Atrophy Medicine Industry Revenue (Million) Forecast, by Application 2019 & 2032
- Table 86: Germany Spinal Muscular Atrophy Medicine Industry Volume (K Unit) Forecast, by Application 2019 & 2032
- Table 87: United Kingdom Spinal Muscular Atrophy Medicine Industry Revenue (Million) Forecast, by Application 2019 & 2032
- Table 88: United Kingdom Spinal Muscular Atrophy Medicine Industry Volume (K Unit) Forecast, by Application 2019 & 2032
- Table 89: France Spinal Muscular Atrophy Medicine Industry Revenue (Million) Forecast, by Application 2019 & 2032
- Table 90: France Spinal Muscular Atrophy Medicine Industry Volume (K Unit) Forecast, by Application 2019 & 2032
- Table 91: Italy Spinal Muscular Atrophy Medicine Industry Revenue (Million) Forecast, by Application 2019 & 2032
- Table 92: Italy Spinal Muscular Atrophy Medicine Industry Volume (K Unit) Forecast, by Application 2019 & 2032
- Table 93: Spain Spinal Muscular Atrophy Medicine Industry Revenue (Million) Forecast, by Application 2019 & 2032
- Table 94: Spain Spinal Muscular Atrophy Medicine Industry Volume (K Unit) Forecast, by Application 2019 & 2032
- Table 95: Rest of Europe Spinal Muscular Atrophy Medicine Industry Revenue (Million) Forecast, by Application 2019 & 2032
- Table 96: Rest of Europe Spinal Muscular Atrophy Medicine Industry Volume (K Unit) Forecast, by Application 2019 & 2032
- Table 97: Global Spinal Muscular Atrophy Medicine Industry Revenue Million Forecast, by Type 2019 & 2032
- Table 98: Global Spinal Muscular Atrophy Medicine Industry Volume K Unit Forecast, by Type 2019 & 2032
- Table 99: Global Spinal Muscular Atrophy Medicine Industry Revenue Million Forecast, by Procedure 2019 & 2032
- Table 100: Global Spinal Muscular Atrophy Medicine Industry Volume K Unit Forecast, by Procedure 2019 & 2032
- Table 101: Global Spinal Muscular Atrophy Medicine Industry Revenue Million Forecast, by Route of Administration 2019 & 2032
- Table 102: Global Spinal Muscular Atrophy Medicine Industry Volume K Unit Forecast, by Route of Administration 2019 & 2032
- Table 103: Global Spinal Muscular Atrophy Medicine Industry Revenue Million Forecast, by Country 2019 & 2032
- Table 104: Global Spinal Muscular Atrophy Medicine Industry Volume K Unit Forecast, by Country 2019 & 2032
- Table 105: China Spinal Muscular Atrophy Medicine Industry Revenue (Million) Forecast, by Application 2019 & 2032
- Table 106: China Spinal Muscular Atrophy Medicine Industry Volume (K Unit) Forecast, by Application 2019 & 2032
- Table 107: Japan Spinal Muscular Atrophy Medicine Industry Revenue (Million) Forecast, by Application 2019 & 2032
- Table 108: Japan Spinal Muscular Atrophy Medicine Industry Volume (K Unit) Forecast, by Application 2019 & 2032
- Table 109: India Spinal Muscular Atrophy Medicine Industry Revenue (Million) Forecast, by Application 2019 & 2032
- Table 110: India Spinal Muscular Atrophy Medicine Industry Volume (K Unit) Forecast, by Application 2019 & 2032
- Table 111: Australia Spinal Muscular Atrophy Medicine Industry Revenue (Million) Forecast, by Application 2019 & 2032
- Table 112: Australia Spinal Muscular Atrophy Medicine Industry Volume (K Unit) Forecast, by Application 2019 & 2032
- Table 113: South Korea Spinal Muscular Atrophy Medicine Industry Revenue (Million) Forecast, by Application 2019 & 2032
- Table 114: South Korea Spinal Muscular Atrophy Medicine Industry Volume (K Unit) Forecast, by Application 2019 & 2032
- Table 115: Rest of Asia Pacific Spinal Muscular Atrophy Medicine Industry Revenue (Million) Forecast, by Application 2019 & 2032
- Table 116: Rest of Asia Pacific Spinal Muscular Atrophy Medicine Industry Volume (K Unit) Forecast, by Application 2019 & 2032
- Table 117: Global Spinal Muscular Atrophy Medicine Industry Revenue Million Forecast, by Type 2019 & 2032
- Table 118: Global Spinal Muscular Atrophy Medicine Industry Volume K Unit Forecast, by Type 2019 & 2032
- Table 119: Global Spinal Muscular Atrophy Medicine Industry Revenue Million Forecast, by Procedure 2019 & 2032
- Table 120: Global Spinal Muscular Atrophy Medicine Industry Volume K Unit Forecast, by Procedure 2019 & 2032
- Table 121: Global Spinal Muscular Atrophy Medicine Industry Revenue Million Forecast, by Route of Administration 2019 & 2032
- Table 122: Global Spinal Muscular Atrophy Medicine Industry Volume K Unit Forecast, by Route of Administration 2019 & 2032
- Table 123: Global Spinal Muscular Atrophy Medicine Industry Revenue Million Forecast, by Country 2019 & 2032
- Table 124: Global Spinal Muscular Atrophy Medicine Industry Volume K Unit Forecast, by Country 2019 & 2032
- Table 125: GCC Spinal Muscular Atrophy Medicine Industry Revenue (Million) Forecast, by Application 2019 & 2032
- Table 126: GCC Spinal Muscular Atrophy Medicine Industry Volume (K Unit) Forecast, by Application 2019 & 2032
- Table 127: South Africa Spinal Muscular Atrophy Medicine Industry Revenue (Million) Forecast, by Application 2019 & 2032
- Table 128: South Africa Spinal Muscular Atrophy Medicine Industry Volume (K Unit) Forecast, by Application 2019 & 2032
- Table 129: Rest of Middle East and Africa Spinal Muscular Atrophy Medicine Industry Revenue (Million) Forecast, by Application 2019 & 2032
- Table 130: Rest of Middle East and Africa Spinal Muscular Atrophy Medicine Industry Volume (K Unit) Forecast, by Application 2019 & 2032
- Table 131: Global Spinal Muscular Atrophy Medicine Industry Revenue Million Forecast, by Type 2019 & 2032
- Table 132: Global Spinal Muscular Atrophy Medicine Industry Volume K Unit Forecast, by Type 2019 & 2032
- Table 133: Global Spinal Muscular Atrophy Medicine Industry Revenue Million Forecast, by Procedure 2019 & 2032
- Table 134: Global Spinal Muscular Atrophy Medicine Industry Volume K Unit Forecast, by Procedure 2019 & 2032
- Table 135: Global Spinal Muscular Atrophy Medicine Industry Revenue Million Forecast, by Route of Administration 2019 & 2032
- Table 136: Global Spinal Muscular Atrophy Medicine Industry Volume K Unit Forecast, by Route of Administration 2019 & 2032
- Table 137: Global Spinal Muscular Atrophy Medicine Industry Revenue Million Forecast, by Country 2019 & 2032
- Table 138: Global Spinal Muscular Atrophy Medicine Industry Volume K Unit Forecast, by Country 2019 & 2032
- Table 139: Brazil Spinal Muscular Atrophy Medicine Industry Revenue (Million) Forecast, by Application 2019 & 2032
- Table 140: Brazil Spinal Muscular Atrophy Medicine Industry Volume (K Unit) Forecast, by Application 2019 & 2032
- Table 141: Argentina Spinal Muscular Atrophy Medicine Industry Revenue (Million) Forecast, by Application 2019 & 2032
- Table 142: Argentina Spinal Muscular Atrophy Medicine Industry Volume (K Unit) Forecast, by Application 2019 & 2032
- Table 143: Rest of South America Spinal Muscular Atrophy Medicine Industry Revenue (Million) Forecast, by Application 2019 & 2032
- Table 144: Rest of South America Spinal Muscular Atrophy Medicine Industry Volume (K Unit) Forecast, by Application 2019 & 2032
Frequently Asked Questions
1. What is the projected Compound Annual Growth Rate (CAGR) of the Spinal Muscular Atrophy Medicine Industry?
The projected CAGR is approximately 14.50%.
2. Which companies are prominent players in the Spinal Muscular Atrophy Medicine Industry?
Key companies in the market include Novartis International AG, Isis Pharmaceuticals Inc, Sanofi Aventis Inc (GenZyme Corporation), Cytokinetics Inc, Avexis Inc, Biogen Inc, Catalyst Pharmaceutical, F Hoffmann - La Roche Ltd, Chugai Pharmaceutical, Pfizer Inc.
3. What are the main segments of the Spinal Muscular Atrophy Medicine Industry?
The market segments include Type, Procedure, Route of Administration.
4. Can you provide details about the market size?
The market size is estimated to be USD XX Million as of 2022.
5. What are some drivers contributing to market growth?
Growing Awareness Regarding Spinal Muscular Atrophy. Its Diagnostics. and Its Treatment; Rise in the Government Initiatives to Improve Healthcare Infrastructure; Increasing R&D Activities to Develop Novel Treatment Regimens for Rare Diseases.
6. What are the notable trends driving market growth?
The Gene Replacement Therapy Segment Dominates the Market. and the Same is Expected Over the Forecast Period.
7. Are there any restraints impacting market growth?
High Cost of Treatment; Lack of Skilled Professionals for Surgical Procedures and Physiotherapy Regimens.
8. Can you provide examples of recent developments in the market?
In August 2021, Novartis announced the lift of a partial clinical trial hold and planned to initiate a new, pivotal Phase 3 study of intrathecal OAV-101 in older patients with spinal muscular atrophy.
9. What pricing options are available for accessing the report?
Pricing options include single-user, multi-user, and enterprise licenses priced at USD 4750, USD 5250, and USD 8750 respectively.
10. Is the market size provided in terms of value or volume?
The market size is provided in terms of value, measured in Million and volume, measured in K Unit.
11. Are there any specific market keywords associated with the report?
Yes, the market keyword associated with the report is "Spinal Muscular Atrophy Medicine Industry," which aids in identifying and referencing the specific market segment covered.
12. How do I determine which pricing option suits my needs best?
The pricing options vary based on user requirements and access needs. Individual users may opt for single-user licenses, while businesses requiring broader access may choose multi-user or enterprise licenses for cost-effective access to the report.
13. Are there any additional resources or data provided in the Spinal Muscular Atrophy Medicine Industry report?
While the report offers comprehensive insights, it's advisable to review the specific contents or supplementary materials provided to ascertain if additional resources or data are available.
14. How can I stay updated on further developments or reports in the Spinal Muscular Atrophy Medicine Industry?
To stay informed about further developments, trends, and reports in the Spinal Muscular Atrophy Medicine Industry, consider subscribing to industry newsletters, following relevant companies and organizations, or regularly checking reputable industry news sources and publications.
Methodology
Step 1 - Identification of Relevant Samples Size from Population Database


Step 2 - Approaches for Defining Global Market Size (Value, Volume* & Price*)

Note*: In applicable scenarios
Step 3 - Data Sources
Primary Research
- Web Analytics
- Survey Reports
- Research Institute
- Latest Research Reports
- Opinion Leaders
Secondary Research
- Annual Reports
- White Paper
- Latest Press Release
- Industry Association
- Paid Database
- Investor Presentations

Step 4 - Data Triangulation
Involves using different sources of information in order to increase the validity of a study
These sources are likely to be stakeholders in a program - participants, other researchers, program staff, other community members, and so on.
Then we put all data in single framework & apply various statistical tools to find out the dynamic on the market.
During the analysis stage, feedback from the stakeholder groups would be compared to determine areas of agreement as well as areas of divergence
