

Key Insights
The global solar photovoltaic (PV) glass market, valued at $17.09 billion in the 2025 base year, is projected for substantial expansion. Anticipated to grow at a compound annual growth rate (CAGR) of 31.2% from 2025 to 2033, this growth is propelled by the escalating global demand for renewable energy. Key drivers include climate change mitigation efforts and supportive government incentives promoting solar energy adoption. Technological advancements in solar cell efficiency, particularly within crystalline silicon and thin-film technologies (Cadmium Telluride and CIGS), are further accelerating market penetration. While the residential sector currently leads in applications, significant growth is expected in the non-residential sector, driven by large-scale solar power plant installations and the increasing integration of solar panels into commercial infrastructure. The market offers a diverse product landscape, encompassing AR-coated, tempered, and TCO-coated glass to meet varied requirements.
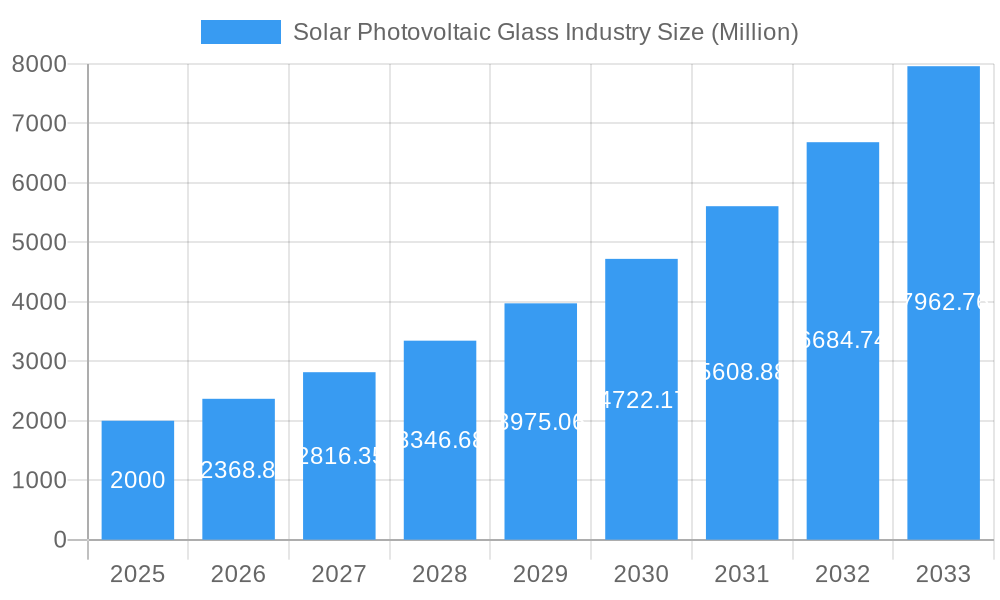
Solar Photovoltaic Glass Industry Market Size (In Billion)
Geographically, the Asia-Pacific region, led by China and India, dominates market share due to extensive manufacturing capabilities and proactive solar energy initiatives. North America and Europe are also experiencing robust growth, supported by strong governmental backing and heightened environmental consciousness. Competitive dynamics among key industry players, including Nippon Sheet Glass, Saint-Gobain, and Xinyi Solar, are fostering innovation and price competitiveness.
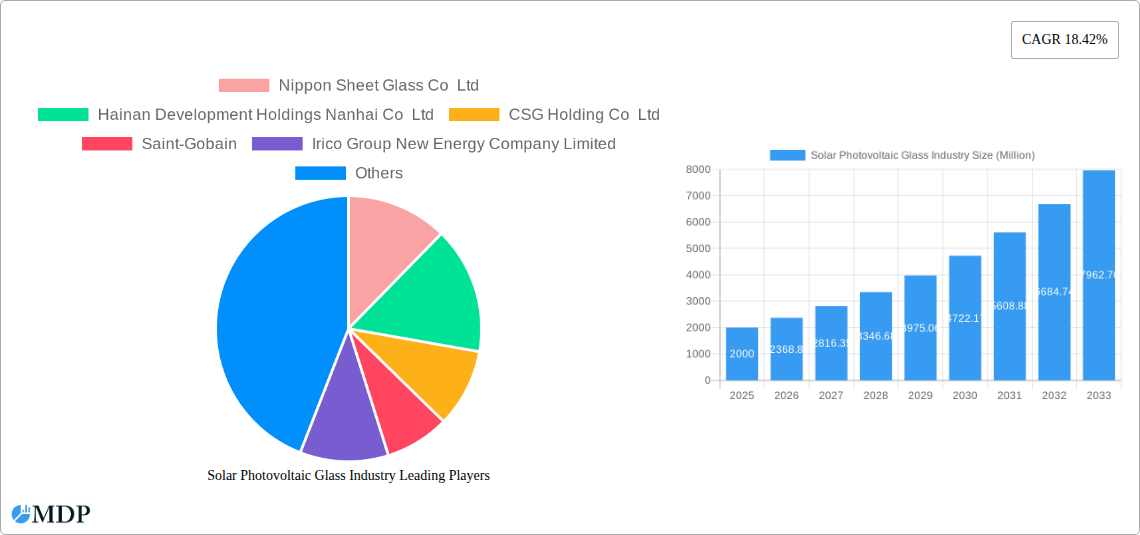
Solar Photovoltaic Glass Industry Company Market Share
Market growth is subject to restraints such as fluctuating raw material prices (silica, tin) and environmental considerations associated with glass production and disposal. However, ongoing research and development in eco-friendly production methods and recycling programs are poised to mitigate these challenges. The solar PV glass market's future is promising, with continuous technological innovation, expanding applications, and favorable government policies anticipated to sustain high growth throughout the forecast period. The market segmentation by type, technology, and application presents opportunities for specialized players to cater to niche demands and drive further market evolution.
Solar Photovoltaic Glass Industry Market Report: 2025-2033
This comprehensive report delivers an in-depth analysis of the global solar photovoltaic (PV) glass industry, detailing market dynamics, emerging trends, leading companies, and future growth trajectories. The study encompasses the period from 2025 to 2033, with 2025 serving as the base year. This report provides critical insights for industry stakeholders, including manufacturers, investors, and policymakers, to effectively navigate this dynamic market. Valuations are presented in billions.
Solar Photovoltaic Glass Industry Market Dynamics & Concentration
The solar PV glass market is characterized by a dynamic interplay of factors influencing its growth and concentration. The market exhibits moderate concentration, with several key players holding significant market share, but also allowing for smaller, specialized companies to thrive. Innovation in glass coatings, particularly Anti-Reflective (AR) and Transparent Conductive Oxide (TCO) coatings, is a major driver, improving energy efficiency and cost-effectiveness. Stringent environmental regulations globally are pushing adoption of solar energy, indirectly boosting demand for PV glass. However, the availability of substitute materials and the fluctuating prices of raw materials pose significant challenges.
- Market Share: The top 5 players account for approximately xx% of the global market in 2025 (Estimated Year).
- M&A Activity: The number of mergers and acquisitions (M&A) deals in the sector has seen a xx% increase from 2022 to 2023, reflecting consolidation and expansion strategies of major players. This is driven by the desire to secure raw material supplies and expand manufacturing capacity.
- Innovation: Continuous innovation in coating technologies and glass manufacturing processes is leading to improved product performance, reduced costs, and higher efficiency.
- Regulatory Landscape: Government incentives and supportive policies significantly influence market growth in various regions. The imposition of carbon taxes and sustainability targets is pushing further market growth.
Solar Photovoltaic Glass Industry Industry Trends & Analysis
The global solar PV glass market is experiencing robust growth, driven primarily by the increasing demand for renewable energy sources and supportive government policies worldwide. The market’s Compound Annual Growth Rate (CAGR) is projected to be xx% during the forecast period (2025-2033). Technological advancements, such as the development of more efficient and durable glass coatings, are also contributing to market expansion. The growing popularity of large-scale solar power plants and the integration of solar PV systems in residential and commercial buildings are major factors boosting the market. Consumer preferences are shifting towards environmentally friendly energy solutions, driving this growth. Competitive dynamics are intense, with key players investing heavily in R&D and capacity expansion to gain a competitive edge. The market penetration of solar PV glass is steadily increasing, fueled by decreasing production costs and rising energy demand.
Leading Markets & Segments in Solar Photovoltaic Glass Industry
The Asia-Pacific region dominates the global solar PV glass market, primarily driven by strong demand from China and India. Within the market segmentation:
- By Type: AR coated glass holds the largest market share, followed by tempered glass. The demand for TCO coated glass is also witnessing significant growth due to its superior efficiency.
- By Technology: Crystalline silicon technology currently dominates, accounting for the majority of the market share due to mature technology and economies of scale, yet thin-film technologies are steadily gaining traction.
- By Application: The non-residential segment is currently the largest market, but the residential sector shows strong growth potential.
Key Drivers:
- China: Massive government investment in renewable energy projects and supportive policies.
- India: Growing energy demand and government initiatives to promote solar energy adoption.
- Europe: Stringent environmental regulations and increasing awareness of climate change.
- United States: Tax incentives and renewable energy targets are stimulating growth.
Solar Photovoltaic Glass Industry Product Developments
Recent product innovations focus on enhancing the efficiency, durability, and aesthetics of solar PV glass. New coatings are being developed to improve light transmission and reduce reflection losses. Lightweight and more flexible glass designs are emerging to cater to diverse applications. The market is also seeing increased focus on developing self-cleaning and anti-soiling glass solutions. These advancements improve the overall performance and lifespan of solar PV systems, making them more appealing to consumers and investors.
Key Drivers of Solar Photovoltaic Glass Industry Growth
The growth of the solar PV glass industry is fueled by several factors:
- Technological Advancements: Continuous improvements in solar cell efficiency and glass coating technologies are leading to cost reductions and increased energy output.
- Government Policies: Substantial government support in the form of subsidies, tax incentives, and renewable energy mandates are driving market growth globally.
- Economic Factors: The increasing cost of fossil fuels and the growing awareness of climate change are making solar energy a more attractive and economically viable option.
Challenges in the Solar Photovoltaic Glass Industry Market
Several factors hinder the growth of the solar PV glass market:
- Raw Material Costs: Fluctuations in the prices of raw materials, such as silica sand and soda ash, impact production costs and profitability.
- Supply Chain Disruptions: Geopolitical events and logistical challenges can disrupt the supply chain, affecting production and delivery times.
- Competition: The market is characterized by intense competition, especially amongst large players driving down price margins.
Emerging Opportunities in Solar Photovoltaic Glass Industry
Emerging opportunities exist within the solar PV glass market:
- Technological Breakthroughs: The development of new glass materials and coating technologies will further enhance the efficiency and performance of solar PV systems.
- Strategic Partnerships: Collaborations between glass manufacturers, solar panel producers, and energy companies will help optimize the supply chain and accelerate market penetration.
- Market Expansion: Growing demand for renewable energy in emerging economies presents significant growth opportunities.
Leading Players in the Solar Photovoltaic Glass Industry Sector
- Nippon Sheet Glass Co Ltd
- Hainan Development Holdings Nanhai Co Ltd
- CSG Holding Co Ltd
- Saint-Gobain
- Irico Group New Energy Company Limited
- Sisecam
- Jinjing (Group) Co Ltd
- Taiwan Glass Ind Corp
- Onyx Solar Group LLC
- Guardian Industries Holdings
- Flat Glass Group Co Ltd
- Xinyi Solar Holdings Limited
- Kaneka Energy Management Solutions
- AGC Inc
- Borosil Limited
Key Milestones in Solar Photovoltaic Glass Industry Industry
- October 2023: Borosil Renewables Limited acquired an 86% stake in Interfloat Corporation and Glasmanufaktur Brandenburg (GMB), boosting its European solar glass manufacturing capacity to 750 TPD from 450 TPD.
- July 2023: AGC Flat Glass Ibérica commissioned a 4,600 kW photovoltaic plant at the Port of Sagunto, showcasing the integration of PV glass in industrial applications.
Strategic Outlook for Solar Photovoltaic Glass Industry Market
The future of the solar PV glass industry appears bright, with continued growth driven by technological innovation, supportive government policies, and increasing environmental awareness. Strategic opportunities exist for companies to invest in R&D, expand manufacturing capacity, and forge strategic partnerships to capitalize on the growing demand for renewable energy. The market is expected to see further consolidation as companies strive for economies of scale and market dominance.
Solar Photovoltaic Glass Industry Segmentation
-
1. Type
- 1.1. AR Coated Glass
- 1.2. Tempered Glass
- 1.3. TCO Coated Glass
- 1.4. Other Types
-
2. Technology
- 2.1. Crystalline Silicon
- 2.2. Cadmium Telluride Thin Film
- 2.3. Amorphous Silicon Solar
- 2.4. Copper Indium Gallium Diselenide (cigs)
- 2.5. Other Technologies
-
3. Application
- 3.1. Residential
-
3.2. Non-residential
- 3.2.1. Commercial
- 3.2.2. Industrial/institutional
- 3.2.3. Other Applications
Solar Photovoltaic Glass Industry Segmentation By Geography
-
1. Asia Pacific
- 1.1. China
- 1.2. India
- 1.3. Japan
- 1.4. South Korea
- 1.5. Rest of Asia Pacific
-
2. North America
- 2.1. United States
- 2.2. Canada
- 2.3. Mexico
-
3. Europe
- 3.1. Germany
- 3.2. United Kingdom
- 3.3. France
- 3.4. Italy
- 3.5. Rest of Europe
-
4. South America
- 4.1. Brazil
- 4.2. Argentina
- 4.3. Rest of South America
-
5. Middle East and Africa
- 5.1. Saudi Arabia
- 5.2. South Africa
- 5.3. Morocco
- 5.4. Rest of Middle East and Africa
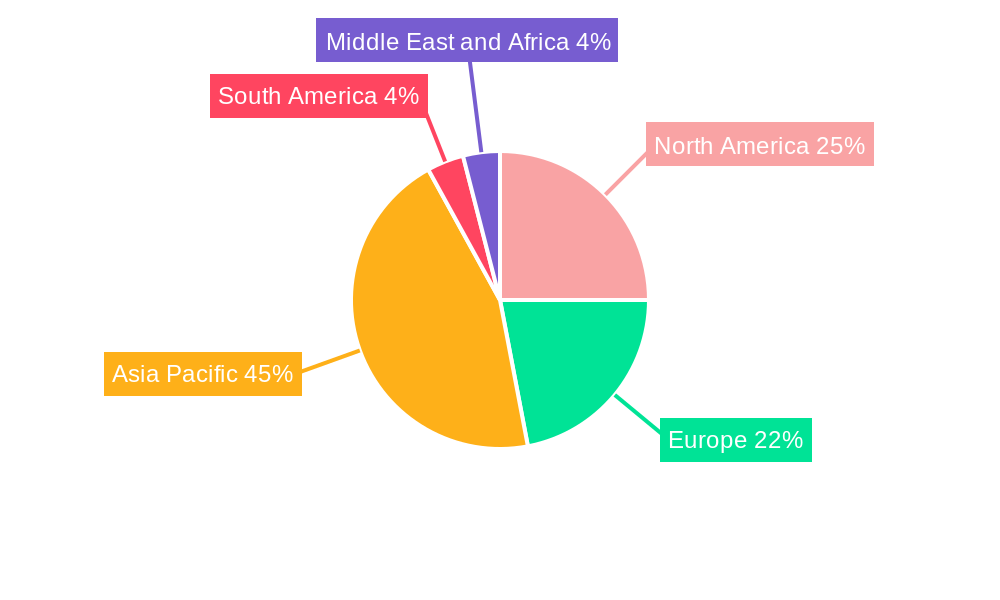
Solar Photovoltaic Glass Industry Regional Market Share
Geographic Coverage of Solar Photovoltaic Glass Industry
Solar Photovoltaic Glass Industry REPORT HIGHLIGHTS
| Aspects | Details |
|---|---|
| Study Period | 2020-2034 |
| Base Year | 2025 |
| Estimated Year | 2026 |
| Forecast Period | 2026-2034 |
| Historical Period | 2020-2025 |
| Growth Rate | CAGR of 31.2% from 2020-2034 |
| Segmentation |
|
Table of Contents
- 1. Introduction
- 1.1. Research Scope
- 1.2. Market Segmentation
- 1.3. Research Objective
- 1.4. Definitions and Assumptions
- 2. Executive Summary
- 2.1. Market Snapshot
- 3. Market Dynamics
- 3.1. Market Drivers
- 3.2. Market Restrains
- 3.3. Market Trends
- 3.4. Market Opportunities
- 4. Market Factor Analysis
- 4.1. Porters Five Forces
- 4.1.1. Bargaining Power of Suppliers
- 4.1.2. Bargaining Power of Buyers
- 4.1.3. Threat of New Entrants
- 4.1.4. Threat of Substitutes
- 4.1.5. Competitive Rivalry
- 4.2. PESTEL analysis
- 4.3. BCG Analysis
- 4.3.1. Stars (High Growth, High Market Share)
- 4.3.2. Cash Cows (Low Growth, High Market Share)
- 4.3.3. Question Mark (High Growth, Low Market Share)
- 4.3.4. Dogs (Low Growth, Low Market Share)
- 4.4. Ansoff Matrix Analysis
- 4.5. Supply Chain Analysis
- 4.6. Regulatory Landscape
- 4.7. Current Market Potential and Opportunity Assessment (TAM–SAM–SOM Framework)
- 4.8. MDP Analyst Note
- 4.1. Porters Five Forces
- 5. Market Analysis, Insights and Forecast 2021-2033
- 5.1. Market Analysis, Insights and Forecast - by Type
- 5.1.1. AR Coated Glass
- 5.1.2. Tempered Glass
- 5.1.3. TCO Coated Glass
- 5.1.4. Other Types
- 5.2. Market Analysis, Insights and Forecast - by Technology
- 5.2.1. Crystalline Silicon
- 5.2.2. Cadmium Telluride Thin Film
- 5.2.3. Amorphous Silicon Solar
- 5.2.4. Copper Indium Gallium Diselenide (cigs)
- 5.2.5. Other Technologies
- 5.3. Market Analysis, Insights and Forecast - by Application
- 5.3.1. Residential
- 5.3.2. Non-residential
- 5.3.2.1. Commercial
- 5.3.2.2. Industrial/institutional
- 5.3.2.3. Other Applications
- 5.4. Market Analysis, Insights and Forecast - by Region
- 5.4.1. Asia Pacific
- 5.4.2. North America
- 5.4.3. Europe
- 5.4.4. South America
- 5.4.5. Middle East and Africa
- 5.1. Market Analysis, Insights and Forecast - by Type
- 6. Global Solar Photovoltaic Glass Industry Analysis, Insights and Forecast, 2021-2033
- 6.1. Market Analysis, Insights and Forecast - by Type
- 6.1.1. AR Coated Glass
- 6.1.2. Tempered Glass
- 6.1.3. TCO Coated Glass
- 6.1.4. Other Types
- 6.2. Market Analysis, Insights and Forecast - by Technology
- 6.2.1. Crystalline Silicon
- 6.2.2. Cadmium Telluride Thin Film
- 6.2.3. Amorphous Silicon Solar
- 6.2.4. Copper Indium Gallium Diselenide (cigs)
- 6.2.5. Other Technologies
- 6.3. Market Analysis, Insights and Forecast - by Application
- 6.3.1. Residential
- 6.3.2. Non-residential
- 6.3.2.1. Commercial
- 6.3.2.2. Industrial/institutional
- 6.3.2.3. Other Applications
- 6.1. Market Analysis, Insights and Forecast - by Type
- 7. Asia Pacific Solar Photovoltaic Glass Industry Analysis, Insights and Forecast, 2020-2032
- 7.1. Market Analysis, Insights and Forecast - by Type
- 7.1.1. AR Coated Glass
- 7.1.2. Tempered Glass
- 7.1.3. TCO Coated Glass
- 7.1.4. Other Types
- 7.2. Market Analysis, Insights and Forecast - by Technology
- 7.2.1. Crystalline Silicon
- 7.2.2. Cadmium Telluride Thin Film
- 7.2.3. Amorphous Silicon Solar
- 7.2.4. Copper Indium Gallium Diselenide (cigs)
- 7.2.5. Other Technologies
- 7.3. Market Analysis, Insights and Forecast - by Application
- 7.3.1. Residential
- 7.3.2. Non-residential
- 7.3.2.1. Commercial
- 7.3.2.2. Industrial/institutional
- 7.3.2.3. Other Applications
- 7.1. Market Analysis, Insights and Forecast - by Type
- 8. North America Solar Photovoltaic Glass Industry Analysis, Insights and Forecast, 2020-2032
- 8.1. Market Analysis, Insights and Forecast - by Type
- 8.1.1. AR Coated Glass
- 8.1.2. Tempered Glass
- 8.1.3. TCO Coated Glass
- 8.1.4. Other Types
- 8.2. Market Analysis, Insights and Forecast - by Technology
- 8.2.1. Crystalline Silicon
- 8.2.2. Cadmium Telluride Thin Film
- 8.2.3. Amorphous Silicon Solar
- 8.2.4. Copper Indium Gallium Diselenide (cigs)
- 8.2.5. Other Technologies
- 8.3. Market Analysis, Insights and Forecast - by Application
- 8.3.1. Residential
- 8.3.2. Non-residential
- 8.3.2.1. Commercial
- 8.3.2.2. Industrial/institutional
- 8.3.2.3. Other Applications
- 8.1. Market Analysis, Insights and Forecast - by Type
- 9. Europe Solar Photovoltaic Glass Industry Analysis, Insights and Forecast, 2020-2032
- 9.1. Market Analysis, Insights and Forecast - by Type
- 9.1.1. AR Coated Glass
- 9.1.2. Tempered Glass
- 9.1.3. TCO Coated Glass
- 9.1.4. Other Types
- 9.2. Market Analysis, Insights and Forecast - by Technology
- 9.2.1. Crystalline Silicon
- 9.2.2. Cadmium Telluride Thin Film
- 9.2.3. Amorphous Silicon Solar
- 9.2.4. Copper Indium Gallium Diselenide (cigs)
- 9.2.5. Other Technologies
- 9.3. Market Analysis, Insights and Forecast - by Application
- 9.3.1. Residential
- 9.3.2. Non-residential
- 9.3.2.1. Commercial
- 9.3.2.2. Industrial/institutional
- 9.3.2.3. Other Applications
- 9.1. Market Analysis, Insights and Forecast - by Type
- 10. South America Solar Photovoltaic Glass Industry Analysis, Insights and Forecast, 2020-2032
- 10.1. Market Analysis, Insights and Forecast - by Type
- 10.1.1. AR Coated Glass
- 10.1.2. Tempered Glass
- 10.1.3. TCO Coated Glass
- 10.1.4. Other Types
- 10.2. Market Analysis, Insights and Forecast - by Technology
- 10.2.1. Crystalline Silicon
- 10.2.2. Cadmium Telluride Thin Film
- 10.2.3. Amorphous Silicon Solar
- 10.2.4. Copper Indium Gallium Diselenide (cigs)
- 10.2.5. Other Technologies
- 10.3. Market Analysis, Insights and Forecast - by Application
- 10.3.1. Residential
- 10.3.2. Non-residential
- 10.3.2.1. Commercial
- 10.3.2.2. Industrial/institutional
- 10.3.2.3. Other Applications
- 10.1. Market Analysis, Insights and Forecast - by Type
- 11. Middle East and Africa Solar Photovoltaic Glass Industry Analysis, Insights and Forecast, 2020-2032
- 11.1. Market Analysis, Insights and Forecast - by Type
- 11.1.1. AR Coated Glass
- 11.1.2. Tempered Glass
- 11.1.3. TCO Coated Glass
- 11.1.4. Other Types
- 11.2. Market Analysis, Insights and Forecast - by Technology
- 11.2.1. Crystalline Silicon
- 11.2.2. Cadmium Telluride Thin Film
- 11.2.3. Amorphous Silicon Solar
- 11.2.4. Copper Indium Gallium Diselenide (cigs)
- 11.2.5. Other Technologies
- 11.3. Market Analysis, Insights and Forecast - by Application
- 11.3.1. Residential
- 11.3.2. Non-residential
- 11.3.2.1. Commercial
- 11.3.2.2. Industrial/institutional
- 11.3.2.3. Other Applications
- 11.1. Market Analysis, Insights and Forecast - by Type
- 12. Competitive Analysis
- 12.1. Company Profiles
- 12.1.1 Nippon Sheet Glass Co Ltd
- 12.1.1.1. Company Overview
- 12.1.1.2. Products
- 12.1.1.3. Company Financials
- 12.1.1.4. SWOT Analysis
- 12.1.2 Hainan Development Holdings Nanhai Co Ltd
- 12.1.2.1. Company Overview
- 12.1.2.2. Products
- 12.1.2.3. Company Financials
- 12.1.2.4. SWOT Analysis
- 12.1.3 CSG Holding Co Ltd
- 12.1.3.1. Company Overview
- 12.1.3.2. Products
- 12.1.3.3. Company Financials
- 12.1.3.4. SWOT Analysis
- 12.1.4 Saint-Gobain
- 12.1.4.1. Company Overview
- 12.1.4.2. Products
- 12.1.4.3. Company Financials
- 12.1.4.4. SWOT Analysis
- 12.1.5 Irico Group New Energy Company Limited
- 12.1.5.1. Company Overview
- 12.1.5.2. Products
- 12.1.5.3. Company Financials
- 12.1.5.4. SWOT Analysis
- 12.1.6 Sisecam
- 12.1.6.1. Company Overview
- 12.1.6.2. Products
- 12.1.6.3. Company Financials
- 12.1.6.4. SWOT Analysis
- 12.1.7 Jinjing (Group) Co Ltd
- 12.1.7.1. Company Overview
- 12.1.7.2. Products
- 12.1.7.3. Company Financials
- 12.1.7.4. SWOT Analysis
- 12.1.8 Taiwan Glass Ind Corp
- 12.1.8.1. Company Overview
- 12.1.8.2. Products
- 12.1.8.3. Company Financials
- 12.1.8.4. SWOT Analysis
- 12.1.9 Onyx Solar Group LLC
- 12.1.9.1. Company Overview
- 12.1.9.2. Products
- 12.1.9.3. Company Financials
- 12.1.9.4. SWOT Analysis
- 12.1.10 Guardian Industries Holdings
- 12.1.10.1. Company Overview
- 12.1.10.2. Products
- 12.1.10.3. Company Financials
- 12.1.10.4. SWOT Analysis
- 12.1.11 Flat Glass Group Co Ltd
- 12.1.11.1. Company Overview
- 12.1.11.2. Products
- 12.1.11.3. Company Financials
- 12.1.11.4. SWOT Analysis
- 12.1.12 Xinyi Solar Holdings Limited*List Not Exhaustive
- 12.1.12.1. Company Overview
- 12.1.12.2. Products
- 12.1.12.3. Company Financials
- 12.1.12.4. SWOT Analysis
- 12.1.13 Kaneka Energy Management Solutions
- 12.1.13.1. Company Overview
- 12.1.13.2. Products
- 12.1.13.3. Company Financials
- 12.1.13.4. SWOT Analysis
- 12.1.14 AGC Inc
- 12.1.14.1. Company Overview
- 12.1.14.2. Products
- 12.1.14.3. Company Financials
- 12.1.14.4. SWOT Analysis
- 12.1.15 Borosil Limited
- 12.1.15.1. Company Overview
- 12.1.15.2. Products
- 12.1.15.3. Company Financials
- 12.1.15.4. SWOT Analysis
- 12.1.1 Nippon Sheet Glass Co Ltd
- 12.2. Market Entropy
- 12.2.1 Company's Key Areas Served
- 12.2.2 Recent Developments
- 12.3. Company Market Share Analysis 2025
- 12.3.1 Top 5 Companies Market Share Analysis
- 12.3.2 Top 3 Companies Market Share Analysis
- 12.4. List of Potential Customers
- 13. Research Methodology
List of Figures
- Figure 1: Global Solar Photovoltaic Glass Industry Revenue Breakdown (billion, %) by Region 2025 & 2033
- Figure 2: Global Solar Photovoltaic Glass Industry Volume Breakdown (Million, %) by Region 2025 & 2033
- Figure 3: Asia Pacific Solar Photovoltaic Glass Industry Revenue (billion), by Type 2025 & 2033
- Figure 4: Asia Pacific Solar Photovoltaic Glass Industry Volume (Million), by Type 2025 & 2033
- Figure 5: Asia Pacific Solar Photovoltaic Glass Industry Revenue Share (%), by Type 2025 & 2033
- Figure 6: Asia Pacific Solar Photovoltaic Glass Industry Volume Share (%), by Type 2025 & 2033
- Figure 7: Asia Pacific Solar Photovoltaic Glass Industry Revenue (billion), by Technology 2025 & 2033
- Figure 8: Asia Pacific Solar Photovoltaic Glass Industry Volume (Million), by Technology 2025 & 2033
- Figure 9: Asia Pacific Solar Photovoltaic Glass Industry Revenue Share (%), by Technology 2025 & 2033
- Figure 10: Asia Pacific Solar Photovoltaic Glass Industry Volume Share (%), by Technology 2025 & 2033
- Figure 11: Asia Pacific Solar Photovoltaic Glass Industry Revenue (billion), by Application 2025 & 2033
- Figure 12: Asia Pacific Solar Photovoltaic Glass Industry Volume (Million), by Application 2025 & 2033
- Figure 13: Asia Pacific Solar Photovoltaic Glass Industry Revenue Share (%), by Application 2025 & 2033
- Figure 14: Asia Pacific Solar Photovoltaic Glass Industry Volume Share (%), by Application 2025 & 2033
- Figure 15: Asia Pacific Solar Photovoltaic Glass Industry Revenue (billion), by Country 2025 & 2033
- Figure 16: Asia Pacific Solar Photovoltaic Glass Industry Volume (Million), by Country 2025 & 2033
- Figure 17: Asia Pacific Solar Photovoltaic Glass Industry Revenue Share (%), by Country 2025 & 2033
- Figure 18: Asia Pacific Solar Photovoltaic Glass Industry Volume Share (%), by Country 2025 & 2033
- Figure 19: North America Solar Photovoltaic Glass Industry Revenue (billion), by Type 2025 & 2033
- Figure 20: North America Solar Photovoltaic Glass Industry Volume (Million), by Type 2025 & 2033
- Figure 21: North America Solar Photovoltaic Glass Industry Revenue Share (%), by Type 2025 & 2033
- Figure 22: North America Solar Photovoltaic Glass Industry Volume Share (%), by Type 2025 & 2033
- Figure 23: North America Solar Photovoltaic Glass Industry Revenue (billion), by Technology 2025 & 2033
- Figure 24: North America Solar Photovoltaic Glass Industry Volume (Million), by Technology 2025 & 2033
- Figure 25: North America Solar Photovoltaic Glass Industry Revenue Share (%), by Technology 2025 & 2033
- Figure 26: North America Solar Photovoltaic Glass Industry Volume Share (%), by Technology 2025 & 2033
- Figure 27: North America Solar Photovoltaic Glass Industry Revenue (billion), by Application 2025 & 2033
- Figure 28: North America Solar Photovoltaic Glass Industry Volume (Million), by Application 2025 & 2033
- Figure 29: North America Solar Photovoltaic Glass Industry Revenue Share (%), by Application 2025 & 2033
- Figure 30: North America Solar Photovoltaic Glass Industry Volume Share (%), by Application 2025 & 2033
- Figure 31: North America Solar Photovoltaic Glass Industry Revenue (billion), by Country 2025 & 2033
- Figure 32: North America Solar Photovoltaic Glass Industry Volume (Million), by Country 2025 & 2033
- Figure 33: North America Solar Photovoltaic Glass Industry Revenue Share (%), by Country 2025 & 2033
- Figure 34: North America Solar Photovoltaic Glass Industry Volume Share (%), by Country 2025 & 2033
- Figure 35: Europe Solar Photovoltaic Glass Industry Revenue (billion), by Type 2025 & 2033
- Figure 36: Europe Solar Photovoltaic Glass Industry Volume (Million), by Type 2025 & 2033
- Figure 37: Europe Solar Photovoltaic Glass Industry Revenue Share (%), by Type 2025 & 2033
- Figure 38: Europe Solar Photovoltaic Glass Industry Volume Share (%), by Type 2025 & 2033
- Figure 39: Europe Solar Photovoltaic Glass Industry Revenue (billion), by Technology 2025 & 2033
- Figure 40: Europe Solar Photovoltaic Glass Industry Volume (Million), by Technology 2025 & 2033
- Figure 41: Europe Solar Photovoltaic Glass Industry Revenue Share (%), by Technology 2025 & 2033
- Figure 42: Europe Solar Photovoltaic Glass Industry Volume Share (%), by Technology 2025 & 2033
- Figure 43: Europe Solar Photovoltaic Glass Industry Revenue (billion), by Application 2025 & 2033
- Figure 44: Europe Solar Photovoltaic Glass Industry Volume (Million), by Application 2025 & 2033
- Figure 45: Europe Solar Photovoltaic Glass Industry Revenue Share (%), by Application 2025 & 2033
- Figure 46: Europe Solar Photovoltaic Glass Industry Volume Share (%), by Application 2025 & 2033
- Figure 47: Europe Solar Photovoltaic Glass Industry Revenue (billion), by Country 2025 & 2033
- Figure 48: Europe Solar Photovoltaic Glass Industry Volume (Million), by Country 2025 & 2033
- Figure 49: Europe Solar Photovoltaic Glass Industry Revenue Share (%), by Country 2025 & 2033
- Figure 50: Europe Solar Photovoltaic Glass Industry Volume Share (%), by Country 2025 & 2033
- Figure 51: South America Solar Photovoltaic Glass Industry Revenue (billion), by Type 2025 & 2033
- Figure 52: South America Solar Photovoltaic Glass Industry Volume (Million), by Type 2025 & 2033
- Figure 53: South America Solar Photovoltaic Glass Industry Revenue Share (%), by Type 2025 & 2033
- Figure 54: South America Solar Photovoltaic Glass Industry Volume Share (%), by Type 2025 & 2033
- Figure 55: South America Solar Photovoltaic Glass Industry Revenue (billion), by Technology 2025 & 2033
- Figure 56: South America Solar Photovoltaic Glass Industry Volume (Million), by Technology 2025 & 2033
- Figure 57: South America Solar Photovoltaic Glass Industry Revenue Share (%), by Technology 2025 & 2033
- Figure 58: South America Solar Photovoltaic Glass Industry Volume Share (%), by Technology 2025 & 2033
- Figure 59: South America Solar Photovoltaic Glass Industry Revenue (billion), by Application 2025 & 2033
- Figure 60: South America Solar Photovoltaic Glass Industry Volume (Million), by Application 2025 & 2033
- Figure 61: South America Solar Photovoltaic Glass Industry Revenue Share (%), by Application 2025 & 2033
- Figure 62: South America Solar Photovoltaic Glass Industry Volume Share (%), by Application 2025 & 2033
- Figure 63: South America Solar Photovoltaic Glass Industry Revenue (billion), by Country 2025 & 2033
- Figure 64: South America Solar Photovoltaic Glass Industry Volume (Million), by Country 2025 & 2033
- Figure 65: South America Solar Photovoltaic Glass Industry Revenue Share (%), by Country 2025 & 2033
- Figure 66: South America Solar Photovoltaic Glass Industry Volume Share (%), by Country 2025 & 2033
- Figure 67: Middle East and Africa Solar Photovoltaic Glass Industry Revenue (billion), by Type 2025 & 2033
- Figure 68: Middle East and Africa Solar Photovoltaic Glass Industry Volume (Million), by Type 2025 & 2033
- Figure 69: Middle East and Africa Solar Photovoltaic Glass Industry Revenue Share (%), by Type 2025 & 2033
- Figure 70: Middle East and Africa Solar Photovoltaic Glass Industry Volume Share (%), by Type 2025 & 2033
- Figure 71: Middle East and Africa Solar Photovoltaic Glass Industry Revenue (billion), by Technology 2025 & 2033
- Figure 72: Middle East and Africa Solar Photovoltaic Glass Industry Volume (Million), by Technology 2025 & 2033
- Figure 73: Middle East and Africa Solar Photovoltaic Glass Industry Revenue Share (%), by Technology 2025 & 2033
- Figure 74: Middle East and Africa Solar Photovoltaic Glass Industry Volume Share (%), by Technology 2025 & 2033
- Figure 75: Middle East and Africa Solar Photovoltaic Glass Industry Revenue (billion), by Application 2025 & 2033
- Figure 76: Middle East and Africa Solar Photovoltaic Glass Industry Volume (Million), by Application 2025 & 2033
- Figure 77: Middle East and Africa Solar Photovoltaic Glass Industry Revenue Share (%), by Application 2025 & 2033
- Figure 78: Middle East and Africa Solar Photovoltaic Glass Industry Volume Share (%), by Application 2025 & 2033
- Figure 79: Middle East and Africa Solar Photovoltaic Glass Industry Revenue (billion), by Country 2025 & 2033
- Figure 80: Middle East and Africa Solar Photovoltaic Glass Industry Volume (Million), by Country 2025 & 2033
- Figure 81: Middle East and Africa Solar Photovoltaic Glass Industry Revenue Share (%), by Country 2025 & 2033
- Figure 82: Middle East and Africa Solar Photovoltaic Glass Industry Volume Share (%), by Country 2025 & 2033
List of Tables
- Table 1: Global Solar Photovoltaic Glass Industry Revenue billion Forecast, by Type 2020 & 2033
- Table 2: Global Solar Photovoltaic Glass Industry Volume Million Forecast, by Type 2020 & 2033
- Table 3: Global Solar Photovoltaic Glass Industry Revenue billion Forecast, by Technology 2020 & 2033
- Table 4: Global Solar Photovoltaic Glass Industry Volume Million Forecast, by Technology 2020 & 2033
- Table 5: Global Solar Photovoltaic Glass Industry Revenue billion Forecast, by Application 2020 & 2033
- Table 6: Global Solar Photovoltaic Glass Industry Volume Million Forecast, by Application 2020 & 2033
- Table 7: Global Solar Photovoltaic Glass Industry Revenue billion Forecast, by Region 2020 & 2033
- Table 8: Global Solar Photovoltaic Glass Industry Volume Million Forecast, by Region 2020 & 2033
- Table 9: Global Solar Photovoltaic Glass Industry Revenue billion Forecast, by Type 2020 & 2033
- Table 10: Global Solar Photovoltaic Glass Industry Volume Million Forecast, by Type 2020 & 2033
- Table 11: Global Solar Photovoltaic Glass Industry Revenue billion Forecast, by Technology 2020 & 2033
- Table 12: Global Solar Photovoltaic Glass Industry Volume Million Forecast, by Technology 2020 & 2033
- Table 13: Global Solar Photovoltaic Glass Industry Revenue billion Forecast, by Application 2020 & 2033
- Table 14: Global Solar Photovoltaic Glass Industry Volume Million Forecast, by Application 2020 & 2033
- Table 15: Global Solar Photovoltaic Glass Industry Revenue billion Forecast, by Country 2020 & 2033
- Table 16: Global Solar Photovoltaic Glass Industry Volume Million Forecast, by Country 2020 & 2033
- Table 17: China Solar Photovoltaic Glass Industry Revenue (billion) Forecast, by Application 2020 & 2033
- Table 18: China Solar Photovoltaic Glass Industry Volume (Million) Forecast, by Application 2020 & 2033
- Table 19: India Solar Photovoltaic Glass Industry Revenue (billion) Forecast, by Application 2020 & 2033
- Table 20: India Solar Photovoltaic Glass Industry Volume (Million) Forecast, by Application 2020 & 2033
- Table 21: Japan Solar Photovoltaic Glass Industry Revenue (billion) Forecast, by Application 2020 & 2033
- Table 22: Japan Solar Photovoltaic Glass Industry Volume (Million) Forecast, by Application 2020 & 2033
- Table 23: South Korea Solar Photovoltaic Glass Industry Revenue (billion) Forecast, by Application 2020 & 2033
- Table 24: South Korea Solar Photovoltaic Glass Industry Volume (Million) Forecast, by Application 2020 & 2033
- Table 25: Rest of Asia Pacific Solar Photovoltaic Glass Industry Revenue (billion) Forecast, by Application 2020 & 2033
- Table 26: Rest of Asia Pacific Solar Photovoltaic Glass Industry Volume (Million) Forecast, by Application 2020 & 2033
- Table 27: Global Solar Photovoltaic Glass Industry Revenue billion Forecast, by Type 2020 & 2033
- Table 28: Global Solar Photovoltaic Glass Industry Volume Million Forecast, by Type 2020 & 2033
- Table 29: Global Solar Photovoltaic Glass Industry Revenue billion Forecast, by Technology 2020 & 2033
- Table 30: Global Solar Photovoltaic Glass Industry Volume Million Forecast, by Technology 2020 & 2033
- Table 31: Global Solar Photovoltaic Glass Industry Revenue billion Forecast, by Application 2020 & 2033
- Table 32: Global Solar Photovoltaic Glass Industry Volume Million Forecast, by Application 2020 & 2033
- Table 33: Global Solar Photovoltaic Glass Industry Revenue billion Forecast, by Country 2020 & 2033
- Table 34: Global Solar Photovoltaic Glass Industry Volume Million Forecast, by Country 2020 & 2033
- Table 35: United States Solar Photovoltaic Glass Industry Revenue (billion) Forecast, by Application 2020 & 2033
- Table 36: United States Solar Photovoltaic Glass Industry Volume (Million) Forecast, by Application 2020 & 2033
- Table 37: Canada Solar Photovoltaic Glass Industry Revenue (billion) Forecast, by Application 2020 & 2033
- Table 38: Canada Solar Photovoltaic Glass Industry Volume (Million) Forecast, by Application 2020 & 2033
- Table 39: Mexico Solar Photovoltaic Glass Industry Revenue (billion) Forecast, by Application 2020 & 2033
- Table 40: Mexico Solar Photovoltaic Glass Industry Volume (Million) Forecast, by Application 2020 & 2033
- Table 41: Global Solar Photovoltaic Glass Industry Revenue billion Forecast, by Type 2020 & 2033
- Table 42: Global Solar Photovoltaic Glass Industry Volume Million Forecast, by Type 2020 & 2033
- Table 43: Global Solar Photovoltaic Glass Industry Revenue billion Forecast, by Technology 2020 & 2033
- Table 44: Global Solar Photovoltaic Glass Industry Volume Million Forecast, by Technology 2020 & 2033
- Table 45: Global Solar Photovoltaic Glass Industry Revenue billion Forecast, by Application 2020 & 2033
- Table 46: Global Solar Photovoltaic Glass Industry Volume Million Forecast, by Application 2020 & 2033
- Table 47: Global Solar Photovoltaic Glass Industry Revenue billion Forecast, by Country 2020 & 2033
- Table 48: Global Solar Photovoltaic Glass Industry Volume Million Forecast, by Country 2020 & 2033
- Table 49: Germany Solar Photovoltaic Glass Industry Revenue (billion) Forecast, by Application 2020 & 2033
- Table 50: Germany Solar Photovoltaic Glass Industry Volume (Million) Forecast, by Application 2020 & 2033
- Table 51: United Kingdom Solar Photovoltaic Glass Industry Revenue (billion) Forecast, by Application 2020 & 2033
- Table 52: United Kingdom Solar Photovoltaic Glass Industry Volume (Million) Forecast, by Application 2020 & 2033
- Table 53: France Solar Photovoltaic Glass Industry Revenue (billion) Forecast, by Application 2020 & 2033
- Table 54: France Solar Photovoltaic Glass Industry Volume (Million) Forecast, by Application 2020 & 2033
- Table 55: Italy Solar Photovoltaic Glass Industry Revenue (billion) Forecast, by Application 2020 & 2033
- Table 56: Italy Solar Photovoltaic Glass Industry Volume (Million) Forecast, by Application 2020 & 2033
- Table 57: Rest of Europe Solar Photovoltaic Glass Industry Revenue (billion) Forecast, by Application 2020 & 2033
- Table 58: Rest of Europe Solar Photovoltaic Glass Industry Volume (Million) Forecast, by Application 2020 & 2033
- Table 59: Global Solar Photovoltaic Glass Industry Revenue billion Forecast, by Type 2020 & 2033
- Table 60: Global Solar Photovoltaic Glass Industry Volume Million Forecast, by Type 2020 & 2033
- Table 61: Global Solar Photovoltaic Glass Industry Revenue billion Forecast, by Technology 2020 & 2033
- Table 62: Global Solar Photovoltaic Glass Industry Volume Million Forecast, by Technology 2020 & 2033
- Table 63: Global Solar Photovoltaic Glass Industry Revenue billion Forecast, by Application 2020 & 2033
- Table 64: Global Solar Photovoltaic Glass Industry Volume Million Forecast, by Application 2020 & 2033
- Table 65: Global Solar Photovoltaic Glass Industry Revenue billion Forecast, by Country 2020 & 2033
- Table 66: Global Solar Photovoltaic Glass Industry Volume Million Forecast, by Country 2020 & 2033
- Table 67: Brazil Solar Photovoltaic Glass Industry Revenue (billion) Forecast, by Application 2020 & 2033
- Table 68: Brazil Solar Photovoltaic Glass Industry Volume (Million) Forecast, by Application 2020 & 2033
- Table 69: Argentina Solar Photovoltaic Glass Industry Revenue (billion) Forecast, by Application 2020 & 2033
- Table 70: Argentina Solar Photovoltaic Glass Industry Volume (Million) Forecast, by Application 2020 & 2033
- Table 71: Rest of South America Solar Photovoltaic Glass Industry Revenue (billion) Forecast, by Application 2020 & 2033
- Table 72: Rest of South America Solar Photovoltaic Glass Industry Volume (Million) Forecast, by Application 2020 & 2033
- Table 73: Global Solar Photovoltaic Glass Industry Revenue billion Forecast, by Type 2020 & 2033
- Table 74: Global Solar Photovoltaic Glass Industry Volume Million Forecast, by Type 2020 & 2033
- Table 75: Global Solar Photovoltaic Glass Industry Revenue billion Forecast, by Technology 2020 & 2033
- Table 76: Global Solar Photovoltaic Glass Industry Volume Million Forecast, by Technology 2020 & 2033
- Table 77: Global Solar Photovoltaic Glass Industry Revenue billion Forecast, by Application 2020 & 2033
- Table 78: Global Solar Photovoltaic Glass Industry Volume Million Forecast, by Application 2020 & 2033
- Table 79: Global Solar Photovoltaic Glass Industry Revenue billion Forecast, by Country 2020 & 2033
- Table 80: Global Solar Photovoltaic Glass Industry Volume Million Forecast, by Country 2020 & 2033
- Table 81: Saudi Arabia Solar Photovoltaic Glass Industry Revenue (billion) Forecast, by Application 2020 & 2033
- Table 82: Saudi Arabia Solar Photovoltaic Glass Industry Volume (Million) Forecast, by Application 2020 & 2033
- Table 83: South Africa Solar Photovoltaic Glass Industry Revenue (billion) Forecast, by Application 2020 & 2033
- Table 84: South Africa Solar Photovoltaic Glass Industry Volume (Million) Forecast, by Application 2020 & 2033
- Table 85: Morocco Solar Photovoltaic Glass Industry Revenue (billion) Forecast, by Application 2020 & 2033
- Table 86: Morocco Solar Photovoltaic Glass Industry Volume (Million) Forecast, by Application 2020 & 2033
- Table 87: Rest of Middle East and Africa Solar Photovoltaic Glass Industry Revenue (billion) Forecast, by Application 2020 & 2033
- Table 88: Rest of Middle East and Africa Solar Photovoltaic Glass Industry Volume (Million) Forecast, by Application 2020 & 2033
Frequently Asked Questions
1. What is the projected Compound Annual Growth Rate (CAGR) of the Solar Photovoltaic Glass Industry?
The projected CAGR is approximately 31.2%.
2. Which companies are prominent players in the Solar Photovoltaic Glass Industry?
Key companies in the market include Nippon Sheet Glass Co Ltd, Hainan Development Holdings Nanhai Co Ltd, CSG Holding Co Ltd, Saint-Gobain, Irico Group New Energy Company Limited, Sisecam, Jinjing (Group) Co Ltd, Taiwan Glass Ind Corp, Onyx Solar Group LLC, Guardian Industries Holdings, Flat Glass Group Co Ltd, Xinyi Solar Holdings Limited*List Not Exhaustive, Kaneka Energy Management Solutions, AGC Inc, Borosil Limited.
3. What are the main segments of the Solar Photovoltaic Glass Industry?
The market segments include Type, Technology, Application.
4. Can you provide details about the market size?
The market size is estimated to be USD 17.09 billion as of 2022.
5. What are some drivers contributing to market growth?
Increasing Demand for Renewable Energy.
6. What are the notable trends driving market growth?
Increasing Demand from the Non-residential Sector.
7. Are there any restraints impacting market growth?
Rising Adoption of Alternate Clean Power Sources.
8. Can you provide examples of recent developments in the market?
In October 2023, Borosil Renewables Limited acquired an 86% stake in the two European solar glass manufacturers, Interfloat Corporation and Glasmanufaktur Brandenburg (GMB). The acquisition has boosted the company’s solar glass manufacturing capacity in Europe to 750 TPD from 450 TPD.
9. What pricing options are available for accessing the report?
Pricing options include single-user, multi-user, and enterprise licenses priced at USD 4750, USD 5250, and USD 8750 respectively.
10. Is the market size provided in terms of value or volume?
The market size is provided in terms of value, measured in billion and volume, measured in Million.
11. Are there any specific market keywords associated with the report?
Yes, the market keyword associated with the report is "Solar Photovoltaic Glass Industry," which aids in identifying and referencing the specific market segment covered.
12. How do I determine which pricing option suits my needs best?
The pricing options vary based on user requirements and access needs. Individual users may opt for single-user licenses, while businesses requiring broader access may choose multi-user or enterprise licenses for cost-effective access to the report.
13. Are there any additional resources or data provided in the Solar Photovoltaic Glass Industry report?
While the report offers comprehensive insights, it's advisable to review the specific contents or supplementary materials provided to ascertain if additional resources or data are available.
14. How can I stay updated on further developments or reports in the Solar Photovoltaic Glass Industry?
To stay informed about further developments, trends, and reports in the Solar Photovoltaic Glass Industry, consider subscribing to industry newsletters, following relevant companies and organizations, or regularly checking reputable industry news sources and publications.
Methodology
Step 1 - Identification of Relevant Samples Size from Population Database


Step 2 - Approaches for Defining Global Market Size (Value, Volume* & Price*)

Note*: In applicable scenarios
Step 3 - Data Sources
Primary Research
- Web Analytics
- Survey Reports
- Research Institute
- Latest Research Reports
- Opinion Leaders
Secondary Research
- Annual Reports
- White Paper
- Latest Press Release
- Industry Association
- Paid Database
- Investor Presentations

Step 4 - Data Triangulation
Involves using different sources of information in order to increase the validity of a study
These sources are likely to be stakeholders in a program - participants, other researchers, program staff, other community members, and so on.
Then we put all data in single framework & apply various statistical tools to find out the dynamic on the market.
During the analysis stage, feedback from the stakeholder groups would be compared to determine areas of agreement as well as areas of divergence