

Key Insights
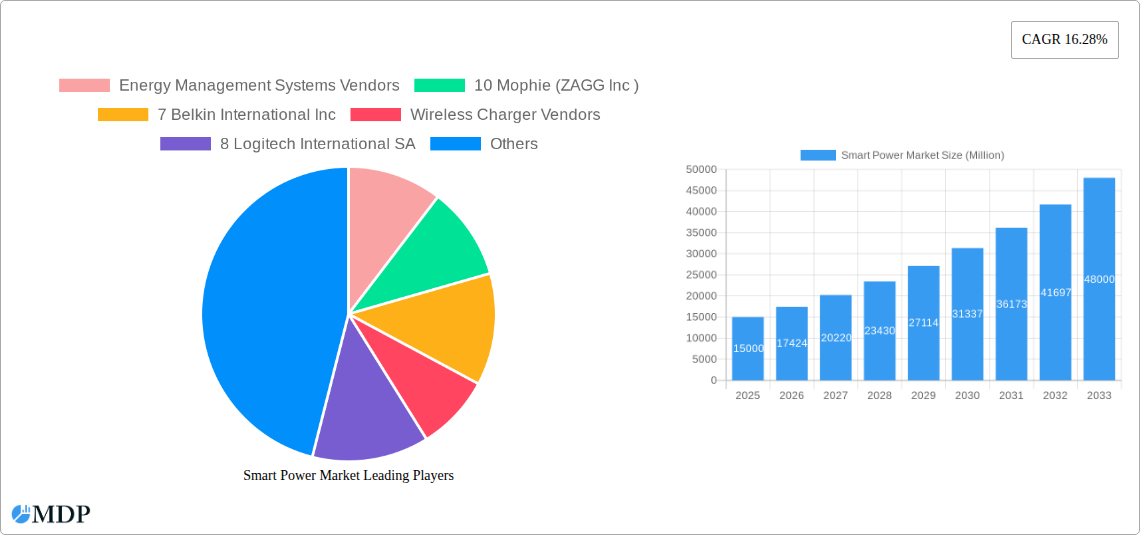
The smart power market, encompassing wireless charging, energy management systems, and power transmitters, is experiencing robust growth, projected to reach a substantial market size by 2033. A compound annual growth rate (CAGR) of 16.28% from 2019-2033 indicates a significant expansion driven by several key factors. The increasing adoption of wireless technologies in consumer electronics and the rising demand for efficient energy management solutions in commercial and residential sectors are major contributors. Furthermore, the growing awareness of energy conservation and sustainability is fueling demand for smart power solutions that optimize energy consumption. The market is segmented by product type, including wireless chargers, power transmitters deployed across various applications (standalone, hospitality, furniture, public places, and restaurants), and energy management systems. Leading companies like Apple, Anker, Belkin, and others are actively shaping the market landscape through innovation and strategic partnerships. Geographic growth is expected across all regions, with North America and Asia-Pacific likely to remain dominant due to high technology adoption rates and robust infrastructure development. However, growth in other regions like Europe and Rest of the World will be significant, driven by increasing disposable income and government initiatives supporting smart technologies. The market faces some restraints such as the high initial investment costs associated with implementing smart power solutions and concerns about cybersecurity and data privacy. Despite these challenges, the overall market trajectory indicates continued expansion and significant opportunities for market players.
The market's segmentation offers diverse avenues for growth. Wireless chargers are witnessing massive adoption across personal devices and public spaces, driven by consumer convenience and ease of use. Power transmitters, especially those integrated into furniture and hospitality settings, reflect the increasing integration of smart technology into daily life. The energy management system segment benefits from increased focus on operational efficiency, leading to wider implementation across commercial buildings and industrial facilities. Competitive dynamics are shaped by both established technology giants and innovative startups, resulting in continuous product improvements and price competition, ultimately benefiting end consumers. The long-term outlook for the smart power market remains extremely positive, promising sustained growth and technological advancements, further contributing to improved energy efficiency and a more connected world.
Smart Power Market: A Comprehensive Analysis (2019-2033)
This in-depth report provides a comprehensive analysis of the Smart Power Market, encompassing market dynamics, industry trends, leading segments, and key players. The study period covers 2019-2033, with a base year of 2025 and a forecast period of 2025-2033. This report is essential for industry stakeholders, investors, and strategists seeking to understand the current landscape and future trajectory of this rapidly evolving market. The global Smart Power Market is projected to reach xx Million by 2033, exhibiting a CAGR of xx% during the forecast period.
Smart Power Market Market Dynamics & Concentration
The Smart Power Market is characterized by a dynamic interplay of factors influencing its growth and concentration. Market concentration is moderately high, with a few major players dominating segments like Wireless Chargers and Energy Management Systems. However, the market also exhibits considerable fragmentation, particularly in the niche segments of transmitters for hospitality and other public places. Innovation is a key driver, fueled by advancements in wireless charging technology, energy-efficient designs, and smart home integration. Stringent regulatory frameworks concerning energy efficiency and safety standards significantly impact market dynamics, particularly in developed regions. Product substitutes, such as traditional wired power solutions, continue to compete, although their market share is diminishing due to the growing convenience and efficiency offered by smart power solutions. End-user trends increasingly favor eco-friendly and energy-saving solutions, creating a conducive environment for smart power adoption. M&A activities have been moderately active, with xx major deals recorded during the historical period (2019-2024). Market share is concentrated among leading players, with the top five companies accounting for approximately xx% of the global market in 2025.
- Market Share: Top 5 players holding approximately xx% of the market in 2025.
- M&A Activity: xx major deals recorded between 2019 and 2024.
- Innovation Drivers: Advancements in wireless charging, energy-efficient designs, and smart home integration.
- Regulatory Impact: Stringent regulations on energy efficiency and safety standards.
Smart Power Market Industry Trends & Analysis
The Smart Power Market is experiencing robust growth, driven by several key trends. The increasing adoption of smart devices and the proliferation of IoT (Internet of Things) applications are primary catalysts. Technological disruptions, such as the emergence of more efficient wireless charging technologies and advanced energy management systems, are further propelling market expansion. Consumer preferences are shifting towards convenient, energy-efficient, and aesthetically pleasing smart power solutions. Competitive dynamics are characterized by intense innovation and strategic partnerships, driving product differentiation and market penetration. The market penetration rate for wireless chargers is expected to reach xx% by 2033. This robust growth is reflected in the projected CAGR of xx% during the forecast period (2025-2033). The market is also witnessing increased demand for energy management systems in commercial and industrial sectors.

Leading Markets & Segments in Smart Power Market
North America currently dominates the Smart Power Market, driven by strong consumer demand for smart home technology and robust infrastructure supporting smart grid development. Within product segments, Wireless Chargers currently hold a significant market share, while the segment for Transmitters (used in various applications like standalone units, hospitality settings, furniture, public places, and restaurants) exhibits promising growth potential.
- Key Drivers in North America:
- Strong consumer demand for smart home devices.
- Advanced infrastructure supporting smart grids.
- Favorable government policies promoting energy efficiency.
- Dominant Segment: Wireless Chargers represent the largest segment, driven by consumer electronics usage.
- High Growth Potential: Transmitters, particularly in hospitality and public places, show significant growth prospects.
Smart Power Market Product Developments
Recent product innovations focus on enhancing wireless charging efficiency, miniaturization, and integration with smart home ecosystems. New applications are emerging across various sectors, including automotive, healthcare, and industrial settings. Companies are focusing on developing products with superior charging speeds, increased power output, and improved safety features to gain a competitive edge. The integration of AI and IoT capabilities is also gaining momentum, allowing for greater energy optimization and remote control functionality.
Key Drivers of Smart Power Market Growth
Several factors are driving the growth of the Smart Power Market. Technological advancements in wireless charging and energy management systems are at the forefront. Rising disposable incomes and increasing adoption of smart devices fuel consumer demand. Government initiatives aimed at promoting energy efficiency and renewable energy sources further contribute to market expansion. For example, the increasing adoption of electric vehicles also fuels the market for efficient charging solutions.
Challenges in the Smart Power Market Market
The Smart Power Market faces several challenges. Regulatory hurdles and variations in safety standards across different regions pose significant barriers. Supply chain disruptions, particularly regarding raw materials and components, impact production and costs. Intense competition among established players and the emergence of new entrants create a highly dynamic and competitive environment. The cost of advanced technology and its adoption represents another barrier to market penetration in certain segments.
Emerging Opportunities in Smart Power Market
The Smart Power Market presents numerous opportunities. Technological breakthroughs in areas such as high-efficiency wireless charging and advanced energy storage solutions will drive further growth. Strategic partnerships between technology companies and energy providers can unlock innovative solutions and expand market reach. Market expansion into developing economies with growing infrastructure needs and rising adoption of smart devices presents significant potential.
Leading Players in the Smart Power Market Sector
- Honeywell International Inc (9)
- Huawei Technologies (6)
- Anker Technologies Ltd (6)
- Belkin International Inc (7)
- Apple Inc (4)
- Logitech International SA (8)
- LG Corporation (3)
- Nokia Corporation (3)
- Mophie (ZAGG Inc) (7)
- Sony Corporation (2)
- Moshi Corp (1)
- BroadLink Technology Co Ltd (5)
- Green Energy Options Lt (2)
Key Milestones in Smart Power Market Industry
- 2020: Introduction of xx% more efficient wireless charging technology by Company A.
- 2022: Merger of Company B and Company C, expanding market presence.
- 2023: Launch of the first commercially viable smart energy management system for residential use by Company D.
- 2024: Government regulations mandating energy-efficient smart power solutions for new buildings in Country X.
Strategic Outlook for Smart Power Market Market
The Smart Power Market is poised for continued growth driven by technological advancements, expanding applications, and supportive government policies. Companies focusing on innovation, strategic partnerships, and expansion into new markets are well-positioned to capitalize on the vast potential of this sector. The integration of AI and IoT capabilities will redefine the landscape, creating opportunities for data-driven optimization and personalized energy management.
Smart Power Market Segmentation
-
1. Product
-
1.1. Wireless Chargers
- 1.1.1. Receiver
- 1.1.2. Transmit
-
1.2. Energy Management Systems
- 1.2.1. Hardware
- 1.2.2. Software (Mobile and Dashboard Applications)
-
1.1. Wireless Chargers
Smart Power Market Segmentation By Geography
-
1. North America
- 1.1. United States
- 1.2. Canada
-
2. Europe
- 2.1. Germany
- 2.2. United Kingdom
- 2.3. France
- 2.4. Spain
- 2.5. Rest of Europe
-
3. Asia Pacific
- 3.1. China
- 3.2. Japan
- 3.3. Rest of Asia Pacific
- 4. Rest of the World

Smart Power Market REPORT HIGHLIGHTS
| Aspects | Details |
|---|---|
| Study Period | 2019-2033 |
| Base Year | 2024 |
| Estimated Year | 2025 |
| Forecast Period | 2025-2033 |
| Historical Period | 2019-2024 |
| Growth Rate | CAGR of 16.28% from 2019-2033 |
| Segmentation |
|
Table of Contents
- 1. Introduction
- 1.1. Research Scope
- 1.2. Market Segmentation
- 1.3. Research Methodology
- 1.4. Definitions and Assumptions
- 2. Executive Summary
- 2.1. Introduction
- 3. Market Dynamics
- 3.1. Introduction
- 3.2. Market Drivers
- 3.2.1 ; Constantly Evolving Market for Smartphones
- 3.2.2 Wearables
- 3.2.3 and Other Portable Devices
- 3.3. Market Restrains
- 3.3.1. ; Technology is Expensive to Integrate and Comparatively Slower Charging
- 3.4. Market Trends
- 3.4.1. Wireless Charger Receivers to witness significant growth
- 4. Market Factor Analysis
- 4.1. Porters Five Forces
- 4.2. Supply/Value Chain
- 4.3. PESTEL analysis
- 4.4. Market Entropy
- 4.5. Patent/Trademark Analysis
- 5. Global Smart Power Market Analysis, Insights and Forecast, 2019-2031
- 5.1. Market Analysis, Insights and Forecast - by Product
- 5.1.1. Wireless Chargers
- 5.1.1.1. Receiver
- 5.1.1.2. Transmit
- 5.1.2. Energy Management Systems
- 5.1.2.1. Hardware
- 5.1.2.2. Software (Mobile and Dashboard Applications)
- 5.1.1. Wireless Chargers
- 5.2. Market Analysis, Insights and Forecast - by Region
- 5.2.1. North America
- 5.2.2. Europe
- 5.2.3. Asia Pacific
- 5.2.4. Rest of the World
- 5.1. Market Analysis, Insights and Forecast - by Product
- 6. North America Smart Power Market Analysis, Insights and Forecast, 2019-2031
- 6.1. Market Analysis, Insights and Forecast - by Product
- 6.1.1. Wireless Chargers
- 6.1.1.1. Receiver
- 6.1.1.2. Transmit
- 6.1.2. Energy Management Systems
- 6.1.2.1. Hardware
- 6.1.2.2. Software (Mobile and Dashboard Applications)
- 6.1.1. Wireless Chargers
- 6.1. Market Analysis, Insights and Forecast - by Product
- 7. Europe Smart Power Market Analysis, Insights and Forecast, 2019-2031
- 7.1. Market Analysis, Insights and Forecast - by Product
- 7.1.1. Wireless Chargers
- 7.1.1.1. Receiver
- 7.1.1.2. Transmit
- 7.1.2. Energy Management Systems
- 7.1.2.1. Hardware
- 7.1.2.2. Software (Mobile and Dashboard Applications)
- 7.1.1. Wireless Chargers
- 7.1. Market Analysis, Insights and Forecast - by Product
- 8. Asia Pacific Smart Power Market Analysis, Insights and Forecast, 2019-2031
- 8.1. Market Analysis, Insights and Forecast - by Product
- 8.1.1. Wireless Chargers
- 8.1.1.1. Receiver
- 8.1.1.2. Transmit
- 8.1.2. Energy Management Systems
- 8.1.2.1. Hardware
- 8.1.2.2. Software (Mobile and Dashboard Applications)
- 8.1.1. Wireless Chargers
- 8.1. Market Analysis, Insights and Forecast - by Product
- 9. Rest of the World Smart Power Market Analysis, Insights and Forecast, 2019-2031
- 9.1. Market Analysis, Insights and Forecast - by Product
- 9.1.1. Wireless Chargers
- 9.1.1.1. Receiver
- 9.1.1.2. Transmit
- 9.1.2. Energy Management Systems
- 9.1.2.1. Hardware
- 9.1.2.2. Software (Mobile and Dashboard Applications)
- 9.1.1. Wireless Chargers
- 9.1. Market Analysis, Insights and Forecast - by Product
- 10. North America Smart Power Market Analysis, Insights and Forecast, 2019-2031
- 10.1. Market Analysis, Insights and Forecast - By Country/Sub-region
- 10.1.1 United States
- 10.1.2 Canada
- 11. Europe Smart Power Market Analysis, Insights and Forecast, 2019-2031
- 11.1. Market Analysis, Insights and Forecast - By Country/Sub-region
- 11.1.1 Germany
- 11.1.2 United Kingdom
- 11.1.3 France
- 11.1.4 Spain
- 11.1.5 Rest of Europe
- 12. Asia Pacific Smart Power Market Analysis, Insights and Forecast, 2019-2031
- 12.1. Market Analysis, Insights and Forecast - By Country/Sub-region
- 12.1.1 China
- 12.1.2 Japan
- 12.1.3 Rest of Asia Pacific
- 13. Rest of the World Smart Power Market Analysis, Insights and Forecast, 2019-2031
- 13.1. Market Analysis, Insights and Forecast - By Country/Sub-region
- 13.1.1.
- 14. Competitive Analysis
- 14.1. Global Market Share Analysis 2024
- 14.2. Company Profiles
- 14.2.1 Energy Management Systems Vendors
- 14.2.1.1. Overview
- 14.2.1.2. Products
- 14.2.1.3. SWOT Analysis
- 14.2.1.4. Recent Developments
- 14.2.1.5. Financials (Based on Availability)
- 14.2.2 10 Mophie (ZAGG Inc )
- 14.2.2.1. Overview
- 14.2.2.2. Products
- 14.2.2.3. SWOT Analysis
- 14.2.2.4. Recent Developments
- 14.2.2.5. Financials (Based on Availability)
- 14.2.3 7 Belkin International Inc
- 14.2.3.1. Overview
- 14.2.3.2. Products
- 14.2.3.3. SWOT Analysis
- 14.2.3.4. Recent Developments
- 14.2.3.5. Financials (Based on Availability)
- 14.2.4 Wireless Charger Vendors
- 14.2.4.1. Overview
- 14.2.4.2. Products
- 14.2.4.3. SWOT Analysis
- 14.2.4.4. Recent Developments
- 14.2.4.5. Financials (Based on Availability)
- 14.2.5 8 Logitech International SA
- 14.2.5.1. Overview
- 14.2.5.2. Products
- 14.2.5.3. SWOT Analysis
- 14.2.5.4. Recent Developments
- 14.2.5.5. Financials (Based on Availability)
- 14.2.6 1 BroadLink Technology Co Ltd
- 14.2.6.1. Overview
- 14.2.6.2. Products
- 14.2.6.3. SWOT Analysis
- 14.2.6.4. Recent Developments
- 14.2.6.5. Financials (Based on Availability)
- 14.2.7 5 Nokia Corporation
- 14.2.7.1. Overview
- 14.2.7.2. Products
- 14.2.7.3. SWOT Analysis
- 14.2.7.4. Recent Developments
- 14.2.7.5. Financials (Based on Availability)
- 14.2.8 3 LG Corporation
- 14.2.8.1. Overview
- 14.2.8.2. Products
- 14.2.8.3. SWOT Analysis
- 14.2.8.4. Recent Developments
- 14.2.8.5. Financials (Based on Availability)
- 14.2.9 3 Green Energy Options Lt
- 14.2.9.1. Overview
- 14.2.9.2. Products
- 14.2.9.3. SWOT Analysis
- 14.2.9.4. Recent Developments
- 14.2.9.5. Financials (Based on Availability)
- 14.2.10 2 Sony Corporation
- 14.2.10.1. Overview
- 14.2.10.2. Products
- 14.2.10.3. SWOT Analysis
- 14.2.10.4. Recent Developments
- 14.2.10.5. Financials (Based on Availability)
- 14.2.11 2 Honeywell International Inc
- 14.2.11.1. Overview
- 14.2.11.2. Products
- 14.2.11.3. SWOT Analysis
- 14.2.11.4. Recent Developments
- 14.2.11.5. Financials (Based on Availability)
- 14.2.12 9 Moshi Corp
- 14.2.12.1. Overview
- 14.2.12.2. Products
- 14.2.12.3. SWOT Analysis
- 14.2.12.4. Recent Developments
- 14.2.12.5. Financials (Based on Availability)
- 14.2.13 1 Apple Inc
- 14.2.13.1. Overview
- 14.2.13.2. Products
- 14.2.13.3. SWOT Analysis
- 14.2.13.4. Recent Developments
- 14.2.13.5. Financials (Based on Availability)
- 14.2.14 4 Huawei Technologies
- 14.2.14.1. Overview
- 14.2.14.2. Products
- 14.2.14.3. SWOT Analysis
- 14.2.14.4. Recent Developments
- 14.2.14.5. Financials (Based on Availability)
- 14.2.15 6 Anker Technologies Ltd
- 14.2.15.1. Overview
- 14.2.15.2. Products
- 14.2.15.3. SWOT Analysis
- 14.2.15.4. Recent Developments
- 14.2.15.5. Financials (Based on Availability)
- 14.2.1 Energy Management Systems Vendors
List of Figures
- Figure 1: Global Smart Power Market Revenue Breakdown (Million, %) by Region 2024 & 2032
- Figure 2: North America Smart Power Market Revenue (Million), by Country 2024 & 2032
- Figure 3: North America Smart Power Market Revenue Share (%), by Country 2024 & 2032
- Figure 4: Europe Smart Power Market Revenue (Million), by Country 2024 & 2032
- Figure 5: Europe Smart Power Market Revenue Share (%), by Country 2024 & 2032
- Figure 6: Asia Pacific Smart Power Market Revenue (Million), by Country 2024 & 2032
- Figure 7: Asia Pacific Smart Power Market Revenue Share (%), by Country 2024 & 2032
- Figure 8: Rest of the World Smart Power Market Revenue (Million), by Country 2024 & 2032
- Figure 9: Rest of the World Smart Power Market Revenue Share (%), by Country 2024 & 2032
- Figure 10: North America Smart Power Market Revenue (Million), by Product 2024 & 2032
- Figure 11: North America Smart Power Market Revenue Share (%), by Product 2024 & 2032
- Figure 12: North America Smart Power Market Revenue (Million), by Country 2024 & 2032
- Figure 13: North America Smart Power Market Revenue Share (%), by Country 2024 & 2032
- Figure 14: Europe Smart Power Market Revenue (Million), by Product 2024 & 2032
- Figure 15: Europe Smart Power Market Revenue Share (%), by Product 2024 & 2032
- Figure 16: Europe Smart Power Market Revenue (Million), by Country 2024 & 2032
- Figure 17: Europe Smart Power Market Revenue Share (%), by Country 2024 & 2032
- Figure 18: Asia Pacific Smart Power Market Revenue (Million), by Product 2024 & 2032
- Figure 19: Asia Pacific Smart Power Market Revenue Share (%), by Product 2024 & 2032
- Figure 20: Asia Pacific Smart Power Market Revenue (Million), by Country 2024 & 2032
- Figure 21: Asia Pacific Smart Power Market Revenue Share (%), by Country 2024 & 2032
- Figure 22: Rest of the World Smart Power Market Revenue (Million), by Product 2024 & 2032
- Figure 23: Rest of the World Smart Power Market Revenue Share (%), by Product 2024 & 2032
- Figure 24: Rest of the World Smart Power Market Revenue (Million), by Country 2024 & 2032
- Figure 25: Rest of the World Smart Power Market Revenue Share (%), by Country 2024 & 2032
List of Tables
- Table 1: Global Smart Power Market Revenue Million Forecast, by Region 2019 & 2032
- Table 2: Global Smart Power Market Revenue Million Forecast, by Product 2019 & 2032
- Table 3: Global Smart Power Market Revenue Million Forecast, by Region 2019 & 2032
- Table 4: Global Smart Power Market Revenue Million Forecast, by Country 2019 & 2032
- Table 5: United States Smart Power Market Revenue (Million) Forecast, by Application 2019 & 2032
- Table 6: Canada Smart Power Market Revenue (Million) Forecast, by Application 2019 & 2032
- Table 7: Global Smart Power Market Revenue Million Forecast, by Country 2019 & 2032
- Table 8: Germany Smart Power Market Revenue (Million) Forecast, by Application 2019 & 2032
- Table 9: United Kingdom Smart Power Market Revenue (Million) Forecast, by Application 2019 & 2032
- Table 10: France Smart Power Market Revenue (Million) Forecast, by Application 2019 & 2032
- Table 11: Spain Smart Power Market Revenue (Million) Forecast, by Application 2019 & 2032
- Table 12: Rest of Europe Smart Power Market Revenue (Million) Forecast, by Application 2019 & 2032
- Table 13: Global Smart Power Market Revenue Million Forecast, by Country 2019 & 2032
- Table 14: China Smart Power Market Revenue (Million) Forecast, by Application 2019 & 2032
- Table 15: Japan Smart Power Market Revenue (Million) Forecast, by Application 2019 & 2032
- Table 16: Rest of Asia Pacific Smart Power Market Revenue (Million) Forecast, by Application 2019 & 2032
- Table 17: Global Smart Power Market Revenue Million Forecast, by Country 2019 & 2032
- Table 18: Smart Power Market Revenue (Million) Forecast, by Application 2019 & 2032
- Table 19: Global Smart Power Market Revenue Million Forecast, by Product 2019 & 2032
- Table 20: Global Smart Power Market Revenue Million Forecast, by Country 2019 & 2032
- Table 21: United States Smart Power Market Revenue (Million) Forecast, by Application 2019 & 2032
- Table 22: Canada Smart Power Market Revenue (Million) Forecast, by Application 2019 & 2032
- Table 23: Global Smart Power Market Revenue Million Forecast, by Product 2019 & 2032
- Table 24: Global Smart Power Market Revenue Million Forecast, by Country 2019 & 2032
- Table 25: Germany Smart Power Market Revenue (Million) Forecast, by Application 2019 & 2032
- Table 26: United Kingdom Smart Power Market Revenue (Million) Forecast, by Application 2019 & 2032
- Table 27: France Smart Power Market Revenue (Million) Forecast, by Application 2019 & 2032
- Table 28: Spain Smart Power Market Revenue (Million) Forecast, by Application 2019 & 2032
- Table 29: Rest of Europe Smart Power Market Revenue (Million) Forecast, by Application 2019 & 2032
- Table 30: Global Smart Power Market Revenue Million Forecast, by Product 2019 & 2032
- Table 31: Global Smart Power Market Revenue Million Forecast, by Country 2019 & 2032
- Table 32: China Smart Power Market Revenue (Million) Forecast, by Application 2019 & 2032
- Table 33: Japan Smart Power Market Revenue (Million) Forecast, by Application 2019 & 2032
- Table 34: Rest of Asia Pacific Smart Power Market Revenue (Million) Forecast, by Application 2019 & 2032
- Table 35: Global Smart Power Market Revenue Million Forecast, by Product 2019 & 2032
- Table 36: Global Smart Power Market Revenue Million Forecast, by Country 2019 & 2032
Frequently Asked Questions
1. What is the projected Compound Annual Growth Rate (CAGR) of the Smart Power Market?
The projected CAGR is approximately 16.28%.
2. Which companies are prominent players in the Smart Power Market?
Key companies in the market include Energy Management Systems Vendors, 10 Mophie (ZAGG Inc ), 7 Belkin International Inc, Wireless Charger Vendors, 8 Logitech International SA, 1 BroadLink Technology Co Ltd, 5 Nokia Corporation, 3 LG Corporation, 3 Green Energy Options Lt, 2 Sony Corporation, 2 Honeywell International Inc, 9 Moshi Corp, 1 Apple Inc, 4 Huawei Technologies, 6 Anker Technologies Ltd.
3. What are the main segments of the Smart Power Market?
The market segments include Product .
4. Can you provide details about the market size?
The market size is estimated to be USD XX Million as of 2022.
5. What are some drivers contributing to market growth?
; Constantly Evolving Market for Smartphones. Wearables. and Other Portable Devices.
6. What are the notable trends driving market growth?
Wireless Charger Receivers to witness significant growth.
7. Are there any restraints impacting market growth?
; Technology is Expensive to Integrate and Comparatively Slower Charging.
8. Can you provide examples of recent developments in the market?
N/A
9. What pricing options are available for accessing the report?
Pricing options include single-user, multi-user, and enterprise licenses priced at USD 4750, USD 5250, and USD 8750 respectively.
10. Is the market size provided in terms of value or volume?
The market size is provided in terms of value, measured in Million.
11. Are there any specific market keywords associated with the report?
Yes, the market keyword associated with the report is "Smart Power Market," which aids in identifying and referencing the specific market segment covered.
12. How do I determine which pricing option suits my needs best?
The pricing options vary based on user requirements and access needs. Individual users may opt for single-user licenses, while businesses requiring broader access may choose multi-user or enterprise licenses for cost-effective access to the report.
13. Are there any additional resources or data provided in the Smart Power Market report?
While the report offers comprehensive insights, it's advisable to review the specific contents or supplementary materials provided to ascertain if additional resources or data are available.
14. How can I stay updated on further developments or reports in the Smart Power Market?
To stay informed about further developments, trends, and reports in the Smart Power Market, consider subscribing to industry newsletters, following relevant companies and organizations, or regularly checking reputable industry news sources and publications.
Methodology
Step 1 - Identification of Relevant Samples Size from Population Database


Step 2 - Approaches for Defining Global Market Size (Value, Volume* & Price*)

Note*: In applicable scenarios
Step 3 - Data Sources
Primary Research
- Web Analytics
- Survey Reports
- Research Institute
- Latest Research Reports
- Opinion Leaders
Secondary Research
- Annual Reports
- White Paper
- Latest Press Release
- Industry Association
- Paid Database
- Investor Presentations

Step 4 - Data Triangulation
Involves using different sources of information in order to increase the validity of a study
These sources are likely to be stakeholders in a program - participants, other researchers, program staff, other community members, and so on.
Then we put all data in single framework & apply various statistical tools to find out the dynamic on the market.
During the analysis stage, feedback from the stakeholder groups would be compared to determine areas of agreement as well as areas of divergence
