

Key Insights
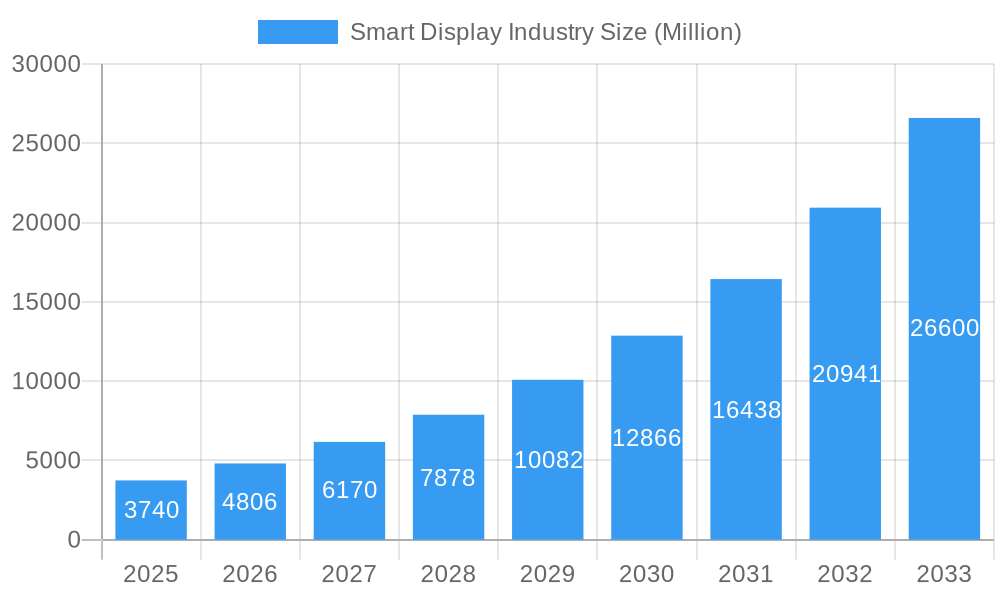
The smart display market, encompassing smart home displays, smart speakers, smart clocks, and smart glasses, is experiencing robust growth, projected to reach a market size of $3.74 billion in 2025 and exhibiting a remarkable Compound Annual Growth Rate (CAGR) of 28.40% from 2019 to 2033. Several factors fuel this expansion. The increasing integration of smart devices into homes and businesses, driven by the rising demand for convenience, automation, and enhanced user experiences, is a primary driver. Technological advancements, such as improved voice recognition, enhanced display quality, and increased processing power, are continually enhancing the functionality and appeal of smart displays. Furthermore, the expanding availability of affordable high-speed internet and the proliferation of smart home ecosystems are contributing to market penetration. The diverse applications across residential, commercial, and industrial sectors further broaden the market's potential. Competition among leading players like Google, Amazon, Baidu, and Lenovo fosters innovation and drives down prices, making these devices increasingly accessible to consumers.
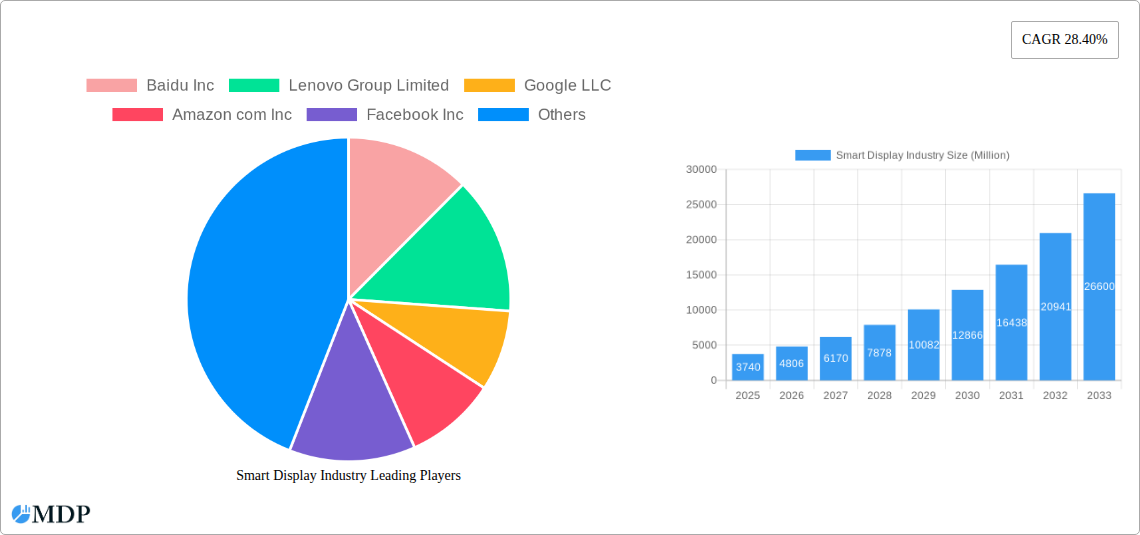
Smart Display Industry Market Size (In Billion)
However, the market faces certain restraints. Concerns regarding data privacy and security continue to be a significant obstacle, impacting consumer confidence. The complexity of integrating various smart devices into a cohesive smart home system can also deter adoption. Moreover, the market is characterized by a relatively short product lifecycle, requiring companies to continually innovate and introduce new features to maintain competitiveness. Regional variations in adoption rates also exist, with North America and Asia-Pacific currently leading the market, while other regions exhibit significant growth potential as infrastructure and awareness improve. Successfully navigating these challenges and capitalizing on ongoing technological advancements will be crucial for continued market expansion in the coming years. The market's projected expansion suggests a substantial investment opportunity for companies capable of innovating and addressing consumer concerns effectively.
Smart Display Industry Company Market Share
Smart Display Industry Market Report: 2019-2033 Forecast
This comprehensive report offers an in-depth analysis of the global Smart Display Industry, providing crucial insights for stakeholders, investors, and industry professionals. With a study period spanning 2019-2033, a base year of 2025, and a forecast period of 2025-2033, this report delivers a complete picture of market dynamics, trends, and future prospects. The market is expected to reach xx Million by 2033, exhibiting a CAGR of xx% during the forecast period. This report covers key segments including Smart Home Displays, Smart Speakers, Smart Clocks, and Smart Glasses, across Home, Business, and Industrial applications. Leading players like Baidu Inc, Lenovo Group Limited, Google LLC, Amazon.com Inc, Facebook Inc, JBL (Harman International), and LG Electronics Inc are analyzed in detail.
Smart Display Industry Market Dynamics & Concentration
The Smart Display market exhibits a moderately concentrated landscape, with a few major players holding significant market share. In 2024, the top five companies collectively held approximately 60% of the global market share, while numerous smaller players compete for the remaining share. This concentration is driven by significant investments in R&D, extensive distribution networks, and strong brand recognition. However, continuous innovation and the entry of new players are expected to increase competition in the coming years. Several factors shape market dynamics, including:
Innovation Drivers: Advancements in display technology (e.g., micro-OLED), voice recognition, AI integration, and connectivity (e.g., Wi-Fi 6E) are key drivers, leading to enhanced user experiences and new product functionalities.
Regulatory Frameworks: Government regulations concerning data privacy, security, and interoperability impact market growth and player strategies. Compliance costs and evolving standards require continuous adaptation.
Product Substitutes: While smart displays offer a unique blend of functionalities, they face competition from traditional displays, smartphones, and tablets. The market will depend on differentiation through enhanced features and value proposition.
End-User Trends: The rising demand for smart home automation, voice-controlled devices, and personalized entertainment experiences significantly fuel market growth. Increasing internet penetration and consumer adoption of IoT devices are also pivotal factors.
M&A Activities: The number of M&A deals in the Smart Display sector has been steadily increasing over the past five years. In 2024, there were approximately xx M&A deals, primarily focused on acquiring smaller technology companies with specialized expertise.
Smart Display Industry Industry Trends & Analysis
The Smart Display industry is characterized by rapid technological advancements and evolving consumer preferences. The market is experiencing robust growth, fueled by several factors:
Market Growth Drivers: The increasing adoption of smart home technology, the demand for personalized user experiences, and the integration of AI and voice assistants are key drivers. Furthermore, declining device costs and expanding product applications across various sectors contribute to market expansion.
Technological Disruptions: The emergence of new display technologies (e.g., micro-LED, flexible displays), improved processor capabilities, and advanced AI algorithms are reshaping the industry landscape. These advancements enhance device performance, efficiency, and user interaction.
Consumer Preferences: Consumers increasingly prefer convenient, personalized, and voice-controlled devices, driving demand for smart displays with seamless integration into their daily lives. Features like enhanced audio quality, improved screen resolution, and broader application compatibility influence buying decisions.
Competitive Dynamics: The market is characterized by intense competition among established players and emerging startups. The competition focuses on delivering superior user experiences, innovative features, and competitive pricing strategies. The overall market exhibits a CAGR of xx% from 2019 to 2024 and is expected to reach xx Million by 2025, with a market penetration of approximately xx%.
Leading Markets & Segments in Smart Display Industry
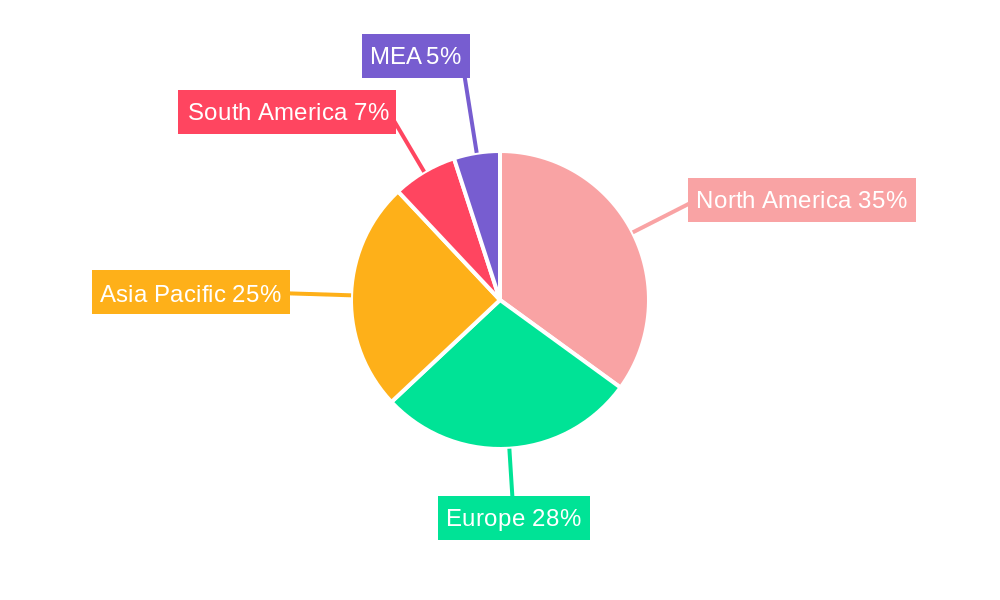
The North American market currently dominates the global Smart Display industry, followed by Asia-Pacific. This leadership is attributed to several key factors:
North America: High disposable incomes, early adoption of technology, and a well-developed infrastructure for smart home technologies drive growth in this region.
Asia-Pacific: Rapid economic development, increasing urbanization, and growing internet penetration, particularly in China and India, propel significant market expansion. Government initiatives supporting digital transformation also boost growth.
Key Drivers (by region and segment):
- North America (Smart Home Displays): High disposable income, advanced smart home infrastructure, and consumer preference for convenient home automation solutions.
- Asia-Pacific (Smart Speakers): Rapid growth of the middle class, increasing internet penetration, and the popularity of voice assistants.
- Europe (Smart Clocks): Strong emphasis on health and wellness, adoption of smart wearables, and growing awareness of sleep tracking technology.
Within product types, Smart Home Displays hold the largest market share, driven by the increasing demand for centralized control of smart home devices. Smart speakers follow closely, fueled by the rise in voice-based interactions and entertainment. The smart glasses segment is currently witnessing the highest growth, driven by technological advancements.
Smart Display Industry Product Developments
Recent product innovations focus on improved display quality, enhanced voice recognition, increased processing power, and better integration with smart home ecosystems. New features such as augmented reality (AR) functionalities in smart glasses and improved audio capabilities in smart speakers are gaining traction. The emphasis is on creating user-friendly interfaces and delivering seamless experiences across various applications. This focus on improved user experience and functional integration creates a significant competitive advantage in the market.
Key Drivers of Smart Display Industry Growth
Several factors fuel the growth of the Smart Display industry:
Technological Advancements: Continuous innovations in display technology, voice recognition, and AI capabilities enhance product functionality and user experience.
Economic Growth: Rising disposable incomes, particularly in developing economies, drive increased consumer spending on smart devices.
Government Regulations: Government initiatives promoting digital transformation and smart city development create a favorable environment for market expansion.
Challenges in the Smart Display Industry Market
The Smart Display market faces challenges including:
- Data Privacy Concerns: Concerns around data security and privacy associated with voice-activated devices limit widespread adoption.
- Supply Chain Disruptions: Global supply chain vulnerabilities impact production costs and timelines.
- Intense Competition: The competitive landscape necessitates continuous innovation and aggressive pricing strategies to maintain market share. The combined effect of these challenges resulted in an estimated xx% decrease in market growth in 2024.
Emerging Opportunities in Smart Display Industry
Significant opportunities exist for long-term growth, including:
Technological Breakthroughs: The development of advanced display technologies, like micro-LED and flexible displays, will unlock new possibilities for product differentiation.
Strategic Partnerships: Collaborations between technology companies and retailers can improve market reach and distribution efficiency.
Market Expansion: Growth in emerging markets, driven by rising internet penetration and affordability, presents significant potential.
Leading Players in the Smart Display Industry Sector
Key Milestones in Smart Display Industry Industry
January 2022: Google launched its second-generation Nest Hub in India, showcasing a floating glass display and improved Nest Audio technology. This move expanded Google's presence in a key growth market.
September 2022: Lenovo introduced its Lenovo Glasses T1 (also known as Lenovo Yoga Glasses in China), featuring micro-OLED displays and USB-C connectivity. This launch marked Lenovo's entry into the smart glasses market, signifying a growing interest in this segment.
Strategic Outlook for Smart Display Industry Market
The Smart Display market holds substantial long-term potential. Continuous innovation, expanding applications across various sectors, and growing consumer adoption will drive significant growth in the coming years. Strategic partnerships, focusing on product differentiation, and expanding into emerging markets are crucial for success. The market's future will be shaped by the ability of players to adapt to changing consumer needs and technological advancements.
Smart Display Industry Segmentation
-
1. Product Type
- 1.1. Smart home displays
- 1.2. Smart speakers
- 1.3. Smart clocks
- 1.4. Smart glasses
-
2. Application
- 2.1. Home
- 2.2. Business
- 2.3. Industry
Smart Display Industry Segmentation By Geography
- 1. North America
- 2. Europe
- 3. Asia Pacific
- 4. Rest of the World
Smart Display Industry Regional Market Share
Geographic Coverage of Smart Display Industry
Smart Display Industry REPORT HIGHLIGHTS
| Aspects | Details |
|---|---|
| Study Period | 2020-2034 |
| Base Year | 2025 |
| Estimated Year | 2026 |
| Forecast Period | 2026-2034 |
| Historical Period | 2020-2025 |
| Growth Rate | CAGR of 28.40% from 2020-2034 |
| Segmentation |
|
Table of Contents
- 1. Introduction
- 1.1. Research Scope
- 1.2. Market Segmentation
- 1.3. Research Methodology
- 1.4. Definitions and Assumptions
- 2. Executive Summary
- 2.1. Introduction
- 3. Market Dynamics
- 3.1. Introduction
- 3.2. Market Drivers
- 3.2.1. Increasing Demand of Smart Home Devices
- 3.3. Market Restrains
- 3.3.1. High Cost and Limited Set of Vocabulary
- 3.4. Market Trends
- 3.4.1. Connected Device to Drive the Market Growth
- 4. Market Factor Analysis
- 4.1. Porters Five Forces
- 4.2. Supply/Value Chain
- 4.3. PESTEL analysis
- 4.4. Market Entropy
- 4.5. Patent/Trademark Analysis
- 5. Global Smart Display Industry Analysis, Insights and Forecast, 2020-2032
- 5.1. Market Analysis, Insights and Forecast - by Product Type
- 5.1.1. Smart home displays
- 5.1.2. Smart speakers
- 5.1.3. Smart clocks
- 5.1.4. Smart glasses
- 5.2. Market Analysis, Insights and Forecast - by Application
- 5.2.1. Home
- 5.2.2. Business
- 5.2.3. Industry
- 5.3. Market Analysis, Insights and Forecast - by Region
- 5.3.1. North America
- 5.3.2. Europe
- 5.3.3. Asia Pacific
- 5.3.4. Rest of the World
- 5.1. Market Analysis, Insights and Forecast - by Product Type
- 6. North America Smart Display Industry Analysis, Insights and Forecast, 2020-2032
- 6.1. Market Analysis, Insights and Forecast - by Product Type
- 6.1.1. Smart home displays
- 6.1.2. Smart speakers
- 6.1.3. Smart clocks
- 6.1.4. Smart glasses
- 6.2. Market Analysis, Insights and Forecast - by Application
- 6.2.1. Home
- 6.2.2. Business
- 6.2.3. Industry
- 6.1. Market Analysis, Insights and Forecast - by Product Type
- 7. Europe Smart Display Industry Analysis, Insights and Forecast, 2020-2032
- 7.1. Market Analysis, Insights and Forecast - by Product Type
- 7.1.1. Smart home displays
- 7.1.2. Smart speakers
- 7.1.3. Smart clocks
- 7.1.4. Smart glasses
- 7.2. Market Analysis, Insights and Forecast - by Application
- 7.2.1. Home
- 7.2.2. Business
- 7.2.3. Industry
- 7.1. Market Analysis, Insights and Forecast - by Product Type
- 8. Asia Pacific Smart Display Industry Analysis, Insights and Forecast, 2020-2032
- 8.1. Market Analysis, Insights and Forecast - by Product Type
- 8.1.1. Smart home displays
- 8.1.2. Smart speakers
- 8.1.3. Smart clocks
- 8.1.4. Smart glasses
- 8.2. Market Analysis, Insights and Forecast - by Application
- 8.2.1. Home
- 8.2.2. Business
- 8.2.3. Industry
- 8.1. Market Analysis, Insights and Forecast - by Product Type
- 9. Rest of the World Smart Display Industry Analysis, Insights and Forecast, 2020-2032
- 9.1. Market Analysis, Insights and Forecast - by Product Type
- 9.1.1. Smart home displays
- 9.1.2. Smart speakers
- 9.1.3. Smart clocks
- 9.1.4. Smart glasses
- 9.2. Market Analysis, Insights and Forecast - by Application
- 9.2.1. Home
- 9.2.2. Business
- 9.2.3. Industry
- 9.1. Market Analysis, Insights and Forecast - by Product Type
- 10. Competitive Analysis
- 10.1. Global Market Share Analysis 2025
- 10.2. Company Profiles
- 10.2.1 Baidu Inc
- 10.2.1.1. Overview
- 10.2.1.2. Products
- 10.2.1.3. SWOT Analysis
- 10.2.1.4. Recent Developments
- 10.2.1.5. Financials (Based on Availability)
- 10.2.2 Lenovo Group Limited
- 10.2.2.1. Overview
- 10.2.2.2. Products
- 10.2.2.3. SWOT Analysis
- 10.2.2.4. Recent Developments
- 10.2.2.5. Financials (Based on Availability)
- 10.2.3 Google LLC
- 10.2.3.1. Overview
- 10.2.3.2. Products
- 10.2.3.3. SWOT Analysis
- 10.2.3.4. Recent Developments
- 10.2.3.5. Financials (Based on Availability)
- 10.2.4 Amazon com Inc
- 10.2.4.1. Overview
- 10.2.4.2. Products
- 10.2.4.3. SWOT Analysis
- 10.2.4.4. Recent Developments
- 10.2.4.5. Financials (Based on Availability)
- 10.2.5 Facebook Inc
- 10.2.5.1. Overview
- 10.2.5.2. Products
- 10.2.5.3. SWOT Analysis
- 10.2.5.4. Recent Developments
- 10.2.5.5. Financials (Based on Availability)
- 10.2.6 JBL ( Harman International)
- 10.2.6.1. Overview
- 10.2.6.2. Products
- 10.2.6.3. SWOT Analysis
- 10.2.6.4. Recent Developments
- 10.2.6.5. Financials (Based on Availability)
- 10.2.7 LG Electronics Inc
- 10.2.7.1. Overview
- 10.2.7.2. Products
- 10.2.7.3. SWOT Analysis
- 10.2.7.4. Recent Developments
- 10.2.7.5. Financials (Based on Availability)
- 10.2.1 Baidu Inc
List of Figures
- Figure 1: Global Smart Display Industry Revenue Breakdown (Million, %) by Region 2025 & 2033
- Figure 2: Global Smart Display Industry Volume Breakdown (K Unit, %) by Region 2025 & 2033
- Figure 3: North America Smart Display Industry Revenue (Million), by Product Type 2025 & 2033
- Figure 4: North America Smart Display Industry Volume (K Unit), by Product Type 2025 & 2033
- Figure 5: North America Smart Display Industry Revenue Share (%), by Product Type 2025 & 2033
- Figure 6: North America Smart Display Industry Volume Share (%), by Product Type 2025 & 2033
- Figure 7: North America Smart Display Industry Revenue (Million), by Application 2025 & 2033
- Figure 8: North America Smart Display Industry Volume (K Unit), by Application 2025 & 2033
- Figure 9: North America Smart Display Industry Revenue Share (%), by Application 2025 & 2033
- Figure 10: North America Smart Display Industry Volume Share (%), by Application 2025 & 2033
- Figure 11: North America Smart Display Industry Revenue (Million), by Country 2025 & 2033
- Figure 12: North America Smart Display Industry Volume (K Unit), by Country 2025 & 2033
- Figure 13: North America Smart Display Industry Revenue Share (%), by Country 2025 & 2033
- Figure 14: North America Smart Display Industry Volume Share (%), by Country 2025 & 2033
- Figure 15: Europe Smart Display Industry Revenue (Million), by Product Type 2025 & 2033
- Figure 16: Europe Smart Display Industry Volume (K Unit), by Product Type 2025 & 2033
- Figure 17: Europe Smart Display Industry Revenue Share (%), by Product Type 2025 & 2033
- Figure 18: Europe Smart Display Industry Volume Share (%), by Product Type 2025 & 2033
- Figure 19: Europe Smart Display Industry Revenue (Million), by Application 2025 & 2033
- Figure 20: Europe Smart Display Industry Volume (K Unit), by Application 2025 & 2033
- Figure 21: Europe Smart Display Industry Revenue Share (%), by Application 2025 & 2033
- Figure 22: Europe Smart Display Industry Volume Share (%), by Application 2025 & 2033
- Figure 23: Europe Smart Display Industry Revenue (Million), by Country 2025 & 2033
- Figure 24: Europe Smart Display Industry Volume (K Unit), by Country 2025 & 2033
- Figure 25: Europe Smart Display Industry Revenue Share (%), by Country 2025 & 2033
- Figure 26: Europe Smart Display Industry Volume Share (%), by Country 2025 & 2033
- Figure 27: Asia Pacific Smart Display Industry Revenue (Million), by Product Type 2025 & 2033
- Figure 28: Asia Pacific Smart Display Industry Volume (K Unit), by Product Type 2025 & 2033
- Figure 29: Asia Pacific Smart Display Industry Revenue Share (%), by Product Type 2025 & 2033
- Figure 30: Asia Pacific Smart Display Industry Volume Share (%), by Product Type 2025 & 2033
- Figure 31: Asia Pacific Smart Display Industry Revenue (Million), by Application 2025 & 2033
- Figure 32: Asia Pacific Smart Display Industry Volume (K Unit), by Application 2025 & 2033
- Figure 33: Asia Pacific Smart Display Industry Revenue Share (%), by Application 2025 & 2033
- Figure 34: Asia Pacific Smart Display Industry Volume Share (%), by Application 2025 & 2033
- Figure 35: Asia Pacific Smart Display Industry Revenue (Million), by Country 2025 & 2033
- Figure 36: Asia Pacific Smart Display Industry Volume (K Unit), by Country 2025 & 2033
- Figure 37: Asia Pacific Smart Display Industry Revenue Share (%), by Country 2025 & 2033
- Figure 38: Asia Pacific Smart Display Industry Volume Share (%), by Country 2025 & 2033
- Figure 39: Rest of the World Smart Display Industry Revenue (Million), by Product Type 2025 & 2033
- Figure 40: Rest of the World Smart Display Industry Volume (K Unit), by Product Type 2025 & 2033
- Figure 41: Rest of the World Smart Display Industry Revenue Share (%), by Product Type 2025 & 2033
- Figure 42: Rest of the World Smart Display Industry Volume Share (%), by Product Type 2025 & 2033
- Figure 43: Rest of the World Smart Display Industry Revenue (Million), by Application 2025 & 2033
- Figure 44: Rest of the World Smart Display Industry Volume (K Unit), by Application 2025 & 2033
- Figure 45: Rest of the World Smart Display Industry Revenue Share (%), by Application 2025 & 2033
- Figure 46: Rest of the World Smart Display Industry Volume Share (%), by Application 2025 & 2033
- Figure 47: Rest of the World Smart Display Industry Revenue (Million), by Country 2025 & 2033
- Figure 48: Rest of the World Smart Display Industry Volume (K Unit), by Country 2025 & 2033
- Figure 49: Rest of the World Smart Display Industry Revenue Share (%), by Country 2025 & 2033
- Figure 50: Rest of the World Smart Display Industry Volume Share (%), by Country 2025 & 2033
List of Tables
- Table 1: Global Smart Display Industry Revenue Million Forecast, by Product Type 2020 & 2033
- Table 2: Global Smart Display Industry Volume K Unit Forecast, by Product Type 2020 & 2033
- Table 3: Global Smart Display Industry Revenue Million Forecast, by Application 2020 & 2033
- Table 4: Global Smart Display Industry Volume K Unit Forecast, by Application 2020 & 2033
- Table 5: Global Smart Display Industry Revenue Million Forecast, by Region 2020 & 2033
- Table 6: Global Smart Display Industry Volume K Unit Forecast, by Region 2020 & 2033
- Table 7: Global Smart Display Industry Revenue Million Forecast, by Product Type 2020 & 2033
- Table 8: Global Smart Display Industry Volume K Unit Forecast, by Product Type 2020 & 2033
- Table 9: Global Smart Display Industry Revenue Million Forecast, by Application 2020 & 2033
- Table 10: Global Smart Display Industry Volume K Unit Forecast, by Application 2020 & 2033
- Table 11: Global Smart Display Industry Revenue Million Forecast, by Country 2020 & 2033
- Table 12: Global Smart Display Industry Volume K Unit Forecast, by Country 2020 & 2033
- Table 13: Global Smart Display Industry Revenue Million Forecast, by Product Type 2020 & 2033
- Table 14: Global Smart Display Industry Volume K Unit Forecast, by Product Type 2020 & 2033
- Table 15: Global Smart Display Industry Revenue Million Forecast, by Application 2020 & 2033
- Table 16: Global Smart Display Industry Volume K Unit Forecast, by Application 2020 & 2033
- Table 17: Global Smart Display Industry Revenue Million Forecast, by Country 2020 & 2033
- Table 18: Global Smart Display Industry Volume K Unit Forecast, by Country 2020 & 2033
- Table 19: Global Smart Display Industry Revenue Million Forecast, by Product Type 2020 & 2033
- Table 20: Global Smart Display Industry Volume K Unit Forecast, by Product Type 2020 & 2033
- Table 21: Global Smart Display Industry Revenue Million Forecast, by Application 2020 & 2033
- Table 22: Global Smart Display Industry Volume K Unit Forecast, by Application 2020 & 2033
- Table 23: Global Smart Display Industry Revenue Million Forecast, by Country 2020 & 2033
- Table 24: Global Smart Display Industry Volume K Unit Forecast, by Country 2020 & 2033
- Table 25: Global Smart Display Industry Revenue Million Forecast, by Product Type 2020 & 2033
- Table 26: Global Smart Display Industry Volume K Unit Forecast, by Product Type 2020 & 2033
- Table 27: Global Smart Display Industry Revenue Million Forecast, by Application 2020 & 2033
- Table 28: Global Smart Display Industry Volume K Unit Forecast, by Application 2020 & 2033
- Table 29: Global Smart Display Industry Revenue Million Forecast, by Country 2020 & 2033
- Table 30: Global Smart Display Industry Volume K Unit Forecast, by Country 2020 & 2033
Frequently Asked Questions
1. What is the projected Compound Annual Growth Rate (CAGR) of the Smart Display Industry?
The projected CAGR is approximately 28.40%.
2. Which companies are prominent players in the Smart Display Industry?
Key companies in the market include Baidu Inc, Lenovo Group Limited, Google LLC, Amazon com Inc, Facebook Inc, JBL ( Harman International), LG Electronics Inc .
3. What are the main segments of the Smart Display Industry?
The market segments include Product Type, Application.
4. Can you provide details about the market size?
The market size is estimated to be USD 3.74 Million as of 2022.
5. What are some drivers contributing to market growth?
Increasing Demand of Smart Home Devices.
6. What are the notable trends driving market growth?
Connected Device to Drive the Market Growth.
7. Are there any restraints impacting market growth?
High Cost and Limited Set of Vocabulary.
8. Can you provide examples of recent developments in the market?
September 2022: Lenovo launched its first smart glasses called Lenovo Glasses T1. The highlights of the smart glasses include two micro OLED displays, a USB-C port for connectivity, and built-in speakers. The Lenovo smart glasses are also called Lenovo Yoga Glasses in China.
9. What pricing options are available for accessing the report?
Pricing options include single-user, multi-user, and enterprise licenses priced at USD 4750, USD 5250, and USD 8750 respectively.
10. Is the market size provided in terms of value or volume?
The market size is provided in terms of value, measured in Million and volume, measured in K Unit.
11. Are there any specific market keywords associated with the report?
Yes, the market keyword associated with the report is "Smart Display Industry," which aids in identifying and referencing the specific market segment covered.
12. How do I determine which pricing option suits my needs best?
The pricing options vary based on user requirements and access needs. Individual users may opt for single-user licenses, while businesses requiring broader access may choose multi-user or enterprise licenses for cost-effective access to the report.
13. Are there any additional resources or data provided in the Smart Display Industry report?
While the report offers comprehensive insights, it's advisable to review the specific contents or supplementary materials provided to ascertain if additional resources or data are available.
14. How can I stay updated on further developments or reports in the Smart Display Industry?
To stay informed about further developments, trends, and reports in the Smart Display Industry, consider subscribing to industry newsletters, following relevant companies and organizations, or regularly checking reputable industry news sources and publications.
Methodology
Step 1 - Identification of Relevant Samples Size from Population Database


Step 2 - Approaches for Defining Global Market Size (Value, Volume* & Price*)

Note*: In applicable scenarios
Step 3 - Data Sources
Primary Research
- Web Analytics
- Survey Reports
- Research Institute
- Latest Research Reports
- Opinion Leaders
Secondary Research
- Annual Reports
- White Paper
- Latest Press Release
- Industry Association
- Paid Database
- Investor Presentations

Step 4 - Data Triangulation
Involves using different sources of information in order to increase the validity of a study
These sources are likely to be stakeholders in a program - participants, other researchers, program staff, other community members, and so on.
Then we put all data in single framework & apply various statistical tools to find out the dynamic on the market.
During the analysis stage, feedback from the stakeholder groups would be compared to determine areas of agreement as well as areas of divergence