

Key Insights
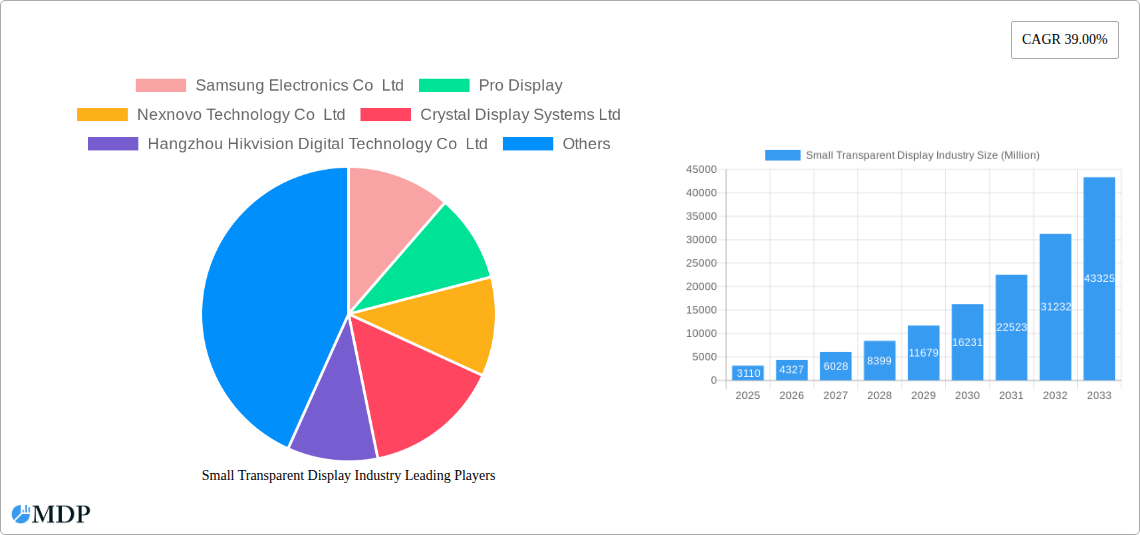
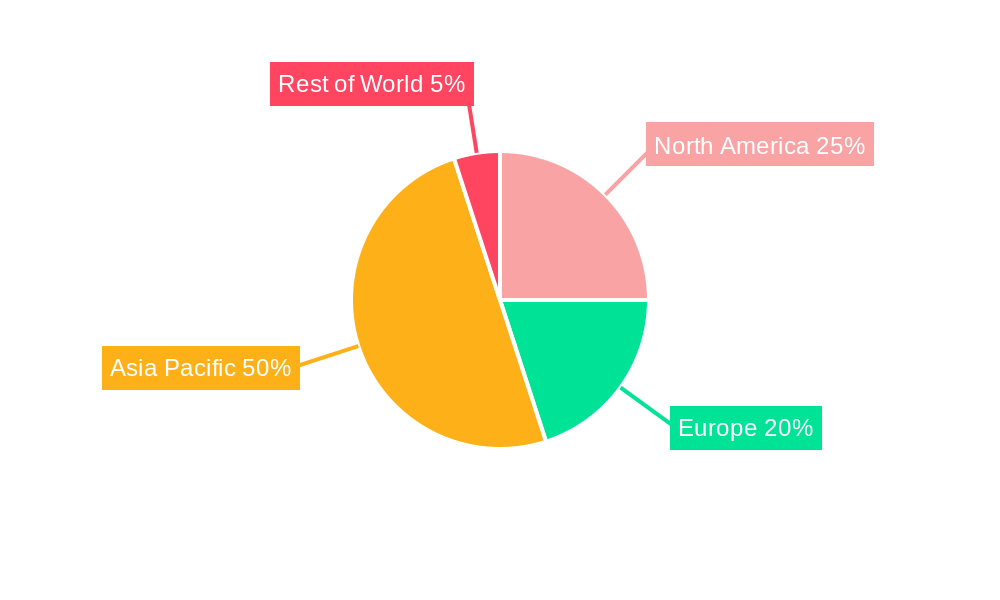
The small transparent display market, valued at $3.11 billion in 2025, is experiencing robust growth, projected to expand at a Compound Annual Growth Rate (CAGR) of 39% from 2025 to 2033. This surge is driven by increasing demand from diverse sectors, particularly consumer electronics (smartwatches, head-up displays), automotive (in-car displays and transparent instrument panels), and retail (interactive displays and digital signage). Technological advancements in OLED and other emerging display technologies are enabling thinner, more energy-efficient, and visually appealing transparent displays, further fueling market expansion. The Asia-Pacific region, especially China and South Korea, is expected to dominate the market due to strong manufacturing capabilities and high consumer electronics adoption rates. However, challenges remain, including the relatively high cost of production for advanced technologies like OLED and the need for further technological improvements to enhance brightness and viewing angles in various lighting conditions. The market is segmented by technology (LCD, OLED, others) and end-user industry (retail, consumer electronics, automotive, aerospace & defense, others). Companies like Samsung, LG, and BOE Technology Group are leading the innovation and market share, but smaller, specialized companies are also contributing to the rapid technological advancements.
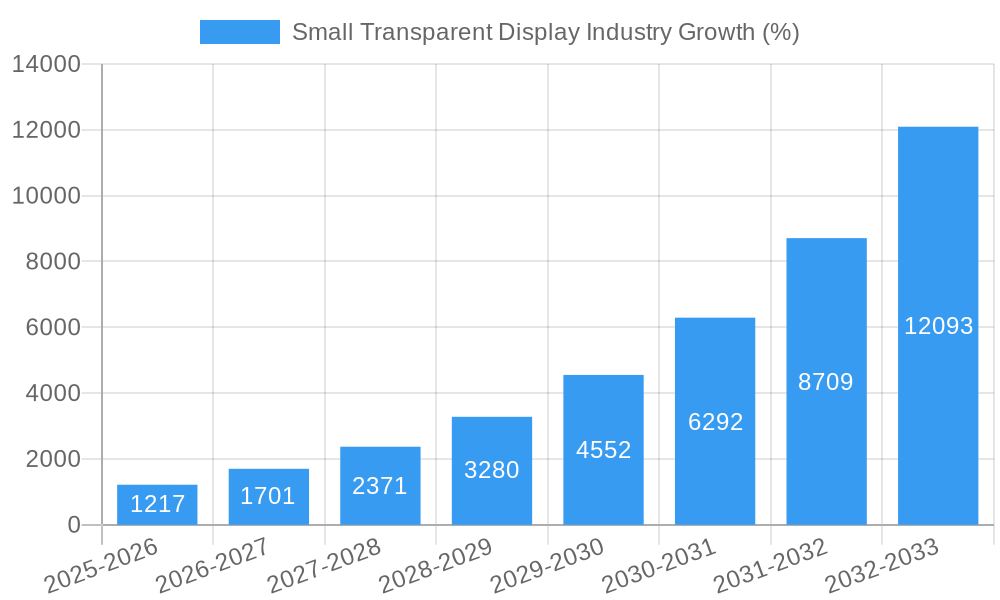
The forecast period (2025-2033) promises continued growth, though the CAGR may moderate slightly towards the end as the market matures. Competition is expected to intensify, with companies focusing on differentiation through improved display quality, cost reduction, and specialized applications. Successful players will be those who can effectively integrate innovative technologies, meet the stringent requirements of diverse industries, and adapt to the evolving consumer preferences for seamless integration of technology into daily life. Further research and development into materials science and display technologies will be crucial to unlocking the full potential of transparent displays and driving further market penetration across diverse applications.
Small Transparent Display Industry Market Report: 2019-2033
Dive deep into the burgeoning world of small transparent displays with this comprehensive market report, projecting a xx Million USD market by 2033. This in-depth analysis covers market dynamics, leading players, technological advancements, and future growth opportunities within the small transparent display industry. Ideal for industry stakeholders, investors, and businesses seeking to understand and capitalize on this rapidly evolving sector.
Small Transparent Display Industry Market Dynamics & Concentration
The small transparent display market, valued at xx Million USD in 2025, is experiencing significant growth fueled by innovation and increasing adoption across diverse sectors. Market concentration is currently moderate, with key players like Samsung Electronics Co Ltd, LG Electronics Co Ltd, and BOE Technology Group holding significant shares, although the exact percentages vary across specific segments. However, the market exhibits a dynamic landscape with frequent mergers and acquisitions (M&A) activity, suggesting consolidation and strategic expansion. For example, the number of M&A deals in the sector between 2019 and 2024 totalled approximately xx.
- Innovation Drivers: Advancements in OLED and microLED technologies are driving miniaturization and enhanced transparency, opening up new applications.
- Regulatory Frameworks: Government regulations regarding energy efficiency and display standards influence market growth and product development.
- Product Substitutes: Traditional displays and alternative technologies pose competition, albeit with limitations in transparency and flexibility.
- End-User Trends: The growing demand for interactive and visually appealing displays across retail, automotive, and consumer electronics is a key growth driver.
- M&A Activities: Strategic acquisitions and partnerships are shaping the competitive landscape, creating larger entities with broader technological capabilities.
Small Transparent Display Industry Industry Trends & Analysis
The small transparent display market is projected to achieve a Compound Annual Growth Rate (CAGR) of xx% during the forecast period (2025-2033). This robust growth is attributed to multiple factors. The increasing demand for transparent displays in consumer electronics, including smartphones with integrated head-up displays, is driving substantial market expansion. Technological disruptions, such as the development of improved microLED displays with higher transparency and resolution, are further boosting growth. Consumer preference for innovative and aesthetically pleasing devices is pushing manufacturers to continuously improve the quality and affordability of transparent displays. Furthermore, the competitive dynamics, driven by the entry of new players and ongoing R&D, ensure ongoing innovation and cost reduction. Market penetration in key sectors like automotive is expected to increase from xx% in 2025 to xx% by 2033, demonstrating substantial future growth potential.
Leading Markets & Segments in Small Transparent Display Industry
Asia dominates the small transparent display market, primarily driven by robust manufacturing capabilities and a high concentration of key players in countries like China, South Korea, and Japan. Within the segments, OLED technology currently leads in terms of market share due to its superior performance characteristics, however microLED is quickly gaining traction.
By Technology:
- OLED: High demand for superior image quality, color accuracy and flexibility in consumer electronics and automotive applications.
- LCD: Cost-effectiveness and relatively mature manufacturing processes make it a significant player in certain end-user segments.
- Other Technologies (e.g., MicroLED): Emerging technologies promise higher performance but currently face higher production costs.
By End-user Industry:
- Automotive: Rapid adoption of head-up displays and transparent instrument panels in high-end vehicles. Key drivers include advanced driver-assistance systems (ADAS) and enhanced user experiences.
- Consumer Electronics: Integration in smartphones, smartwatches, and other wearable devices is fueling demand.
- Retail: Interactive displays and transparent signage are becoming increasingly popular in retail settings.
- Aerospace & Defense: Niche applications in aircraft cockpits and military equipment represent a smaller yet significant market segment.
The dominance of Asia is underpinned by robust government support for technological innovation, a large and growing consumer market, and highly efficient manufacturing infrastructures.
Small Transparent Display Industry Product Developments
Recent advancements have focused on improving transparency, resolution, and brightness while reducing production costs. Tianma's microLED prototypes and LG's diverse transparent OLED offerings showcase the industry's drive to create versatile and high-performing displays suitable for multiple applications. These developments highlight the industry's competitive drive for superior market fit and technological advantage.
Key Drivers of Small Transparent Display Industry Growth
Several factors are driving market expansion:
- Technological Advancements: Continuous improvements in display technologies (OLED, microLED) are leading to superior product performance.
- Economic Growth: Increased disposable income in developing countries fuels demand for advanced consumer electronics and automotive vehicles.
- Favorable Government Policies: Government support for R&D and technological innovation is driving market development.
Challenges in the Small Transparent Display Industry Market
The industry faces several challenges:
- High Production Costs: The manufacturing processes for advanced technologies like microLED remain expensive, limiting widespread adoption.
- Supply Chain Disruptions: Geopolitical factors and resource constraints can impact production and supply chains.
- Intense Competition: The market is characterized by intense competition among established and emerging players.
Emerging Opportunities in Small Transparent Display Industry
The long-term growth outlook is positive, fueled by several key opportunities:
- Technological Breakthroughs: Further advancements in microLED and other display technologies promise higher performance and cost reductions.
- Strategic Partnerships: Collaboration between display manufacturers and end-user industries will expedite market adoption.
- Market Expansion: Penetration into new markets, such as augmented and virtual reality devices, presents significant growth potential.
Leading Players in the Small Transparent Display Industry Sector
- Samsung Electronics Co Ltd
- Pro Display
- Nexnovo Technology Co Ltd
- Crystal Display Systems Ltd
- Hangzhou Hikvision Digital Technology Co Ltd
- Planar Systems Inc (Leyard Optoelectronic Co )
- Shenzhen AuroLED Technology Co Ltd
- BOE Technology Group
- LG Electronics Co Ltd
- Panasonic Corporation
- 2Point0 Concepts
Key Milestones in Small Transparent Display Industry Industry
- July 2023: Tianma unveils transparent microLED display prototypes at Display Week 2023, targeting the automotive sector. The 8.75” panel boasts 880x480 resolution, 800 nits brightness, and >70% transparency. This signals a significant step towards higher-resolution, brighter transparent displays.
- June 2023: LG Business Solutions USA showcases various transparent digital displays (LED films, OLED panels) at InfoComm 2023, demonstrating versatility across applications. This broadens the potential applications of transparent displays, especially for businesses and interior design.
Strategic Outlook for Small Transparent Display Industry Market
The small transparent display market is poised for continued expansion, driven by technological innovation, increasing demand across various sectors, and strategic partnerships. The focus on improving efficiency, reducing costs, and expanding into new applications will further enhance market penetration and propel future growth. Companies strategically investing in R&D and adopting flexible manufacturing models will be best positioned to capitalize on the significant market opportunities presented in the coming years.
Small Transparent Display Industry Segmentation
-
1. Technology
- 1.1. LCD
- 1.2. OLED
- 1.3. Other Technologies
-
2. End-user Industry
- 2.1. Retail
- 2.2. Consumer Electronics
- 2.3. Automotive
- 2.4. Aerospace and Defense
- 2.5. Other End-user Industries
Small Transparent Display Industry Segmentation By Geography
-
1. North America
- 1.1. United States
- 1.2. Canada
-
2. Europe
- 2.1. Germany
- 2.2. United Kingdom
- 2.3. France
-
3. Asia
- 3.1. China
- 3.2. Japan
- 3.3. India
- 3.4. South Korea
- 3.5. Australia and New Zealand
- 4. Latin America
- 5. Middle East and Africa
Small Transparent Display Industry REPORT HIGHLIGHTS
| Aspects | Details |
|---|---|
| Study Period | 2019-2033 |
| Base Year | 2024 |
| Estimated Year | 2025 |
| Forecast Period | 2025-2033 |
| Historical Period | 2019-2024 |
| Growth Rate | CAGR of 39.00% from 2019-2033 |
| Segmentation |
|
Table of Contents
- 1. Introduction
- 1.1. Research Scope
- 1.2. Market Segmentation
- 1.3. Research Methodology
- 1.4. Definitions and Assumptions
- 2. Executive Summary
- 2.1. Introduction
- 3. Market Dynamics
- 3.1. Introduction
- 3.2. Market Drivers
- 3.2.1. Increasing Demand for Advanced Displays in the Automotive Market; Growth of Augmented and Virtual Reality
- 3.3. Market Restrains
- 3.3.1. Complex Manufacturing Process and Expensive to Deploy in Consumer Products
- 3.4. Market Trends
- 3.4.1. Retail Sector to Hold a Significant Market Share
- 4. Market Factor Analysis
- 4.1. Porters Five Forces
- 4.2. Supply/Value Chain
- 4.3. PESTEL analysis
- 4.4. Market Entropy
- 4.5. Patent/Trademark Analysis
- 5. Global Small Transparent Display Industry Analysis, Insights and Forecast, 2019-2031
- 5.1. Market Analysis, Insights and Forecast - by Technology
- 5.1.1. LCD
- 5.1.2. OLED
- 5.1.3. Other Technologies
- 5.2. Market Analysis, Insights and Forecast - by End-user Industry
- 5.2.1. Retail
- 5.2.2. Consumer Electronics
- 5.2.3. Automotive
- 5.2.4. Aerospace and Defense
- 5.2.5. Other End-user Industries
- 5.3. Market Analysis, Insights and Forecast - by Region
- 5.3.1. North America
- 5.3.2. Europe
- 5.3.3. Asia
- 5.3.4. Latin America
- 5.3.5. Middle East and Africa
- 5.1. Market Analysis, Insights and Forecast - by Technology
- 6. North America Small Transparent Display Industry Analysis, Insights and Forecast, 2019-2031
- 6.1. Market Analysis, Insights and Forecast - by Technology
- 6.1.1. LCD
- 6.1.2. OLED
- 6.1.3. Other Technologies
- 6.2. Market Analysis, Insights and Forecast - by End-user Industry
- 6.2.1. Retail
- 6.2.2. Consumer Electronics
- 6.2.3. Automotive
- 6.2.4. Aerospace and Defense
- 6.2.5. Other End-user Industries
- 6.1. Market Analysis, Insights and Forecast - by Technology
- 7. Europe Small Transparent Display Industry Analysis, Insights and Forecast, 2019-2031
- 7.1. Market Analysis, Insights and Forecast - by Technology
- 7.1.1. LCD
- 7.1.2. OLED
- 7.1.3. Other Technologies
- 7.2. Market Analysis, Insights and Forecast - by End-user Industry
- 7.2.1. Retail
- 7.2.2. Consumer Electronics
- 7.2.3. Automotive
- 7.2.4. Aerospace and Defense
- 7.2.5. Other End-user Industries
- 7.1. Market Analysis, Insights and Forecast - by Technology
- 8. Asia Small Transparent Display Industry Analysis, Insights and Forecast, 2019-2031
- 8.1. Market Analysis, Insights and Forecast - by Technology
- 8.1.1. LCD
- 8.1.2. OLED
- 8.1.3. Other Technologies
- 8.2. Market Analysis, Insights and Forecast - by End-user Industry
- 8.2.1. Retail
- 8.2.2. Consumer Electronics
- 8.2.3. Automotive
- 8.2.4. Aerospace and Defense
- 8.2.5. Other End-user Industries
- 8.1. Market Analysis, Insights and Forecast - by Technology
- 9. Latin America Small Transparent Display Industry Analysis, Insights and Forecast, 2019-2031
- 9.1. Market Analysis, Insights and Forecast - by Technology
- 9.1.1. LCD
- 9.1.2. OLED
- 9.1.3. Other Technologies
- 9.2. Market Analysis, Insights and Forecast - by End-user Industry
- 9.2.1. Retail
- 9.2.2. Consumer Electronics
- 9.2.3. Automotive
- 9.2.4. Aerospace and Defense
- 9.2.5. Other End-user Industries
- 9.1. Market Analysis, Insights and Forecast - by Technology
- 10. Middle East and Africa Small Transparent Display Industry Analysis, Insights and Forecast, 2019-2031
- 10.1. Market Analysis, Insights and Forecast - by Technology
- 10.1.1. LCD
- 10.1.2. OLED
- 10.1.3. Other Technologies
- 10.2. Market Analysis, Insights and Forecast - by End-user Industry
- 10.2.1. Retail
- 10.2.2. Consumer Electronics
- 10.2.3. Automotive
- 10.2.4. Aerospace and Defense
- 10.2.5. Other End-user Industries
- 10.1. Market Analysis, Insights and Forecast - by Technology
- 11. North America Small Transparent Display Industry Analysis, Insights and Forecast, 2019-2031
- 11.1. Market Analysis, Insights and Forecast - By Country/Sub-region
- 11.1.1 United States
- 11.1.2 Canada
- 12. Europe Small Transparent Display Industry Analysis, Insights and Forecast, 2019-2031
- 12.1. Market Analysis, Insights and Forecast - By Country/Sub-region
- 12.1.1 Germany
- 12.1.2 United Kingdom
- 12.1.3 France
- 12.1.4 Rest of Europe
- 13. Asia Pacific Small Transparent Display Industry Analysis, Insights and Forecast, 2019-2031
- 13.1. Market Analysis, Insights and Forecast - By Country/Sub-region
- 13.1.1 China
- 13.1.2 Japan
- 13.1.3 India
- 13.1.4 South Korea
- 13.1.5 Rest of Asia Pacific
- 14. Rest of the World Small Transparent Display Industry Analysis, Insights and Forecast, 2019-2031
- 14.1. Market Analysis, Insights and Forecast - By Country/Sub-region
- 14.1.1.
- 15. Competitive Analysis
- 15.1. Global Market Share Analysis 2024
- 15.2. Company Profiles
- 15.2.1 Samsung Electronics Co Ltd
- 15.2.1.1. Overview
- 15.2.1.2. Products
- 15.2.1.3. SWOT Analysis
- 15.2.1.4. Recent Developments
- 15.2.1.5. Financials (Based on Availability)
- 15.2.2 Pro Display
- 15.2.2.1. Overview
- 15.2.2.2. Products
- 15.2.2.3. SWOT Analysis
- 15.2.2.4. Recent Developments
- 15.2.2.5. Financials (Based on Availability)
- 15.2.3 Nexnovo Technology Co Ltd
- 15.2.3.1. Overview
- 15.2.3.2. Products
- 15.2.3.3. SWOT Analysis
- 15.2.3.4. Recent Developments
- 15.2.3.5. Financials (Based on Availability)
- 15.2.4 Crystal Display Systems Ltd
- 15.2.4.1. Overview
- 15.2.4.2. Products
- 15.2.4.3. SWOT Analysis
- 15.2.4.4. Recent Developments
- 15.2.4.5. Financials (Based on Availability)
- 15.2.5 Hangzhou Hikvision Digital Technology Co Ltd
- 15.2.5.1. Overview
- 15.2.5.2. Products
- 15.2.5.3. SWOT Analysis
- 15.2.5.4. Recent Developments
- 15.2.5.5. Financials (Based on Availability)
- 15.2.6 Planar Systems Inc (Leyard Optoelectronic Co )
- 15.2.6.1. Overview
- 15.2.6.2. Products
- 15.2.6.3. SWOT Analysis
- 15.2.6.4. Recent Developments
- 15.2.6.5. Financials (Based on Availability)
- 15.2.7 Shenzhen AuroLED Technology Co Ltd
- 15.2.7.1. Overview
- 15.2.7.2. Products
- 15.2.7.3. SWOT Analysis
- 15.2.7.4. Recent Developments
- 15.2.7.5. Financials (Based on Availability)
- 15.2.8 BOE Technology Grou
- 15.2.8.1. Overview
- 15.2.8.2. Products
- 15.2.8.3. SWOT Analysis
- 15.2.8.4. Recent Developments
- 15.2.8.5. Financials (Based on Availability)
- 15.2.9 LG Electronics Co Ltd
- 15.2.9.1. Overview
- 15.2.9.2. Products
- 15.2.9.3. SWOT Analysis
- 15.2.9.4. Recent Developments
- 15.2.9.5. Financials (Based on Availability)
- 15.2.10 Panasonic Corporation
- 15.2.10.1. Overview
- 15.2.10.2. Products
- 15.2.10.3. SWOT Analysis
- 15.2.10.4. Recent Developments
- 15.2.10.5. Financials (Based on Availability)
- 15.2.11 2Point0 Concepts
- 15.2.11.1. Overview
- 15.2.11.2. Products
- 15.2.11.3. SWOT Analysis
- 15.2.11.4. Recent Developments
- 15.2.11.5. Financials (Based on Availability)
- 15.2.1 Samsung Electronics Co Ltd
List of Figures
- Figure 1: Global Small Transparent Display Industry Revenue Breakdown (Million, %) by Region 2024 & 2032
- Figure 2: North America Small Transparent Display Industry Revenue (Million), by Country 2024 & 2032
- Figure 3: North America Small Transparent Display Industry Revenue Share (%), by Country 2024 & 2032
- Figure 4: Europe Small Transparent Display Industry Revenue (Million), by Country 2024 & 2032
- Figure 5: Europe Small Transparent Display Industry Revenue Share (%), by Country 2024 & 2032
- Figure 6: Asia Pacific Small Transparent Display Industry Revenue (Million), by Country 2024 & 2032
- Figure 7: Asia Pacific Small Transparent Display Industry Revenue Share (%), by Country 2024 & 2032
- Figure 8: Rest of the World Small Transparent Display Industry Revenue (Million), by Country 2024 & 2032
- Figure 9: Rest of the World Small Transparent Display Industry Revenue Share (%), by Country 2024 & 2032
- Figure 10: North America Small Transparent Display Industry Revenue (Million), by Technology 2024 & 2032
- Figure 11: North America Small Transparent Display Industry Revenue Share (%), by Technology 2024 & 2032
- Figure 12: North America Small Transparent Display Industry Revenue (Million), by End-user Industry 2024 & 2032
- Figure 13: North America Small Transparent Display Industry Revenue Share (%), by End-user Industry 2024 & 2032
- Figure 14: North America Small Transparent Display Industry Revenue (Million), by Country 2024 & 2032
- Figure 15: North America Small Transparent Display Industry Revenue Share (%), by Country 2024 & 2032
- Figure 16: Europe Small Transparent Display Industry Revenue (Million), by Technology 2024 & 2032
- Figure 17: Europe Small Transparent Display Industry Revenue Share (%), by Technology 2024 & 2032
- Figure 18: Europe Small Transparent Display Industry Revenue (Million), by End-user Industry 2024 & 2032
- Figure 19: Europe Small Transparent Display Industry Revenue Share (%), by End-user Industry 2024 & 2032
- Figure 20: Europe Small Transparent Display Industry Revenue (Million), by Country 2024 & 2032
- Figure 21: Europe Small Transparent Display Industry Revenue Share (%), by Country 2024 & 2032
- Figure 22: Asia Small Transparent Display Industry Revenue (Million), by Technology 2024 & 2032
- Figure 23: Asia Small Transparent Display Industry Revenue Share (%), by Technology 2024 & 2032
- Figure 24: Asia Small Transparent Display Industry Revenue (Million), by End-user Industry 2024 & 2032
- Figure 25: Asia Small Transparent Display Industry Revenue Share (%), by End-user Industry 2024 & 2032
- Figure 26: Asia Small Transparent Display Industry Revenue (Million), by Country 2024 & 2032
- Figure 27: Asia Small Transparent Display Industry Revenue Share (%), by Country 2024 & 2032
- Figure 28: Latin America Small Transparent Display Industry Revenue (Million), by Technology 2024 & 2032
- Figure 29: Latin America Small Transparent Display Industry Revenue Share (%), by Technology 2024 & 2032
- Figure 30: Latin America Small Transparent Display Industry Revenue (Million), by End-user Industry 2024 & 2032
- Figure 31: Latin America Small Transparent Display Industry Revenue Share (%), by End-user Industry 2024 & 2032
- Figure 32: Latin America Small Transparent Display Industry Revenue (Million), by Country 2024 & 2032
- Figure 33: Latin America Small Transparent Display Industry Revenue Share (%), by Country 2024 & 2032
- Figure 34: Middle East and Africa Small Transparent Display Industry Revenue (Million), by Technology 2024 & 2032
- Figure 35: Middle East and Africa Small Transparent Display Industry Revenue Share (%), by Technology 2024 & 2032
- Figure 36: Middle East and Africa Small Transparent Display Industry Revenue (Million), by End-user Industry 2024 & 2032
- Figure 37: Middle East and Africa Small Transparent Display Industry Revenue Share (%), by End-user Industry 2024 & 2032
- Figure 38: Middle East and Africa Small Transparent Display Industry Revenue (Million), by Country 2024 & 2032
- Figure 39: Middle East and Africa Small Transparent Display Industry Revenue Share (%), by Country 2024 & 2032
List of Tables
- Table 1: Global Small Transparent Display Industry Revenue Million Forecast, by Region 2019 & 2032
- Table 2: Global Small Transparent Display Industry Revenue Million Forecast, by Technology 2019 & 2032
- Table 3: Global Small Transparent Display Industry Revenue Million Forecast, by End-user Industry 2019 & 2032
- Table 4: Global Small Transparent Display Industry Revenue Million Forecast, by Region 2019 & 2032
- Table 5: Global Small Transparent Display Industry Revenue Million Forecast, by Country 2019 & 2032
- Table 6: United States Small Transparent Display Industry Revenue (Million) Forecast, by Application 2019 & 2032
- Table 7: Canada Small Transparent Display Industry Revenue (Million) Forecast, by Application 2019 & 2032
- Table 8: Global Small Transparent Display Industry Revenue Million Forecast, by Country 2019 & 2032
- Table 9: Germany Small Transparent Display Industry Revenue (Million) Forecast, by Application 2019 & 2032
- Table 10: United Kingdom Small Transparent Display Industry Revenue (Million) Forecast, by Application 2019 & 2032
- Table 11: France Small Transparent Display Industry Revenue (Million) Forecast, by Application 2019 & 2032
- Table 12: Rest of Europe Small Transparent Display Industry Revenue (Million) Forecast, by Application 2019 & 2032
- Table 13: Global Small Transparent Display Industry Revenue Million Forecast, by Country 2019 & 2032
- Table 14: China Small Transparent Display Industry Revenue (Million) Forecast, by Application 2019 & 2032
- Table 15: Japan Small Transparent Display Industry Revenue (Million) Forecast, by Application 2019 & 2032
- Table 16: India Small Transparent Display Industry Revenue (Million) Forecast, by Application 2019 & 2032
- Table 17: South Korea Small Transparent Display Industry Revenue (Million) Forecast, by Application 2019 & 2032
- Table 18: Rest of Asia Pacific Small Transparent Display Industry Revenue (Million) Forecast, by Application 2019 & 2032
- Table 19: Global Small Transparent Display Industry Revenue Million Forecast, by Country 2019 & 2032
- Table 20: Small Transparent Display Industry Revenue (Million) Forecast, by Application 2019 & 2032
- Table 21: Global Small Transparent Display Industry Revenue Million Forecast, by Technology 2019 & 2032
- Table 22: Global Small Transparent Display Industry Revenue Million Forecast, by End-user Industry 2019 & 2032
- Table 23: Global Small Transparent Display Industry Revenue Million Forecast, by Country 2019 & 2032
- Table 24: United States Small Transparent Display Industry Revenue (Million) Forecast, by Application 2019 & 2032
- Table 25: Canada Small Transparent Display Industry Revenue (Million) Forecast, by Application 2019 & 2032
- Table 26: Global Small Transparent Display Industry Revenue Million Forecast, by Technology 2019 & 2032
- Table 27: Global Small Transparent Display Industry Revenue Million Forecast, by End-user Industry 2019 & 2032
- Table 28: Global Small Transparent Display Industry Revenue Million Forecast, by Country 2019 & 2032
- Table 29: Germany Small Transparent Display Industry Revenue (Million) Forecast, by Application 2019 & 2032
- Table 30: United Kingdom Small Transparent Display Industry Revenue (Million) Forecast, by Application 2019 & 2032
- Table 31: France Small Transparent Display Industry Revenue (Million) Forecast, by Application 2019 & 2032
- Table 32: Global Small Transparent Display Industry Revenue Million Forecast, by Technology 2019 & 2032
- Table 33: Global Small Transparent Display Industry Revenue Million Forecast, by End-user Industry 2019 & 2032
- Table 34: Global Small Transparent Display Industry Revenue Million Forecast, by Country 2019 & 2032
- Table 35: China Small Transparent Display Industry Revenue (Million) Forecast, by Application 2019 & 2032
- Table 36: Japan Small Transparent Display Industry Revenue (Million) Forecast, by Application 2019 & 2032
- Table 37: India Small Transparent Display Industry Revenue (Million) Forecast, by Application 2019 & 2032
- Table 38: South Korea Small Transparent Display Industry Revenue (Million) Forecast, by Application 2019 & 2032
- Table 39: Australia and New Zealand Small Transparent Display Industry Revenue (Million) Forecast, by Application 2019 & 2032
- Table 40: Global Small Transparent Display Industry Revenue Million Forecast, by Technology 2019 & 2032
- Table 41: Global Small Transparent Display Industry Revenue Million Forecast, by End-user Industry 2019 & 2032
- Table 42: Global Small Transparent Display Industry Revenue Million Forecast, by Country 2019 & 2032
- Table 43: Global Small Transparent Display Industry Revenue Million Forecast, by Technology 2019 & 2032
- Table 44: Global Small Transparent Display Industry Revenue Million Forecast, by End-user Industry 2019 & 2032
- Table 45: Global Small Transparent Display Industry Revenue Million Forecast, by Country 2019 & 2032
Frequently Asked Questions
1. What is the projected Compound Annual Growth Rate (CAGR) of the Small Transparent Display Industry?
The projected CAGR is approximately 39.00%.
2. Which companies are prominent players in the Small Transparent Display Industry?
Key companies in the market include Samsung Electronics Co Ltd, Pro Display, Nexnovo Technology Co Ltd, Crystal Display Systems Ltd, Hangzhou Hikvision Digital Technology Co Ltd, Planar Systems Inc (Leyard Optoelectronic Co ), Shenzhen AuroLED Technology Co Ltd, BOE Technology Grou, LG Electronics Co Ltd, Panasonic Corporation, 2Point0 Concepts.
3. What are the main segments of the Small Transparent Display Industry?
The market segments include Technology, End-user Industry.
4. Can you provide details about the market size?
The market size is estimated to be USD 3.11 Million as of 2022.
5. What are some drivers contributing to market growth?
Increasing Demand for Advanced Displays in the Automotive Market; Growth of Augmented and Virtual Reality.
6. What are the notable trends driving market growth?
Retail Sector to Hold a Significant Market Share.
7. Are there any restraints impacting market growth?
Complex Manufacturing Process and Expensive to Deploy in Consumer Products.
8. Can you provide examples of recent developments in the market?
Jul 2023: Tianma unveiled the latest transparent microLED display prototypes demonstrated at Display Week 2023. The company claims that the automotive sector is the primary application for these displays. The first display is an 8.75” (114 PPI) panel with an 880x480 resolution, 800 nits brightness, and more than 70% transparency.
9. What pricing options are available for accessing the report?
Pricing options include single-user, multi-user, and enterprise licenses priced at USD 4750, USD 5250, and USD 8750 respectively.
10. Is the market size provided in terms of value or volume?
The market size is provided in terms of value, measured in Million.
11. Are there any specific market keywords associated with the report?
Yes, the market keyword associated with the report is "Small Transparent Display Industry," which aids in identifying and referencing the specific market segment covered.
12. How do I determine which pricing option suits my needs best?
The pricing options vary based on user requirements and access needs. Individual users may opt for single-user licenses, while businesses requiring broader access may choose multi-user or enterprise licenses for cost-effective access to the report.
13. Are there any additional resources or data provided in the Small Transparent Display Industry report?
While the report offers comprehensive insights, it's advisable to review the specific contents or supplementary materials provided to ascertain if additional resources or data are available.
14. How can I stay updated on further developments or reports in the Small Transparent Display Industry?
To stay informed about further developments, trends, and reports in the Small Transparent Display Industry, consider subscribing to industry newsletters, following relevant companies and organizations, or regularly checking reputable industry news sources and publications.
Methodology
Step 1 - Identification of Relevant Samples Size from Population Database


Step 2 - Approaches for Defining Global Market Size (Value, Volume* & Price*)

Note*: In applicable scenarios
Step 3 - Data Sources
Primary Research
- Web Analytics
- Survey Reports
- Research Institute
- Latest Research Reports
- Opinion Leaders
Secondary Research
- Annual Reports
- White Paper
- Latest Press Release
- Industry Association
- Paid Database
- Investor Presentations

Step 4 - Data Triangulation
Involves using different sources of information in order to increase the validity of a study
These sources are likely to be stakeholders in a program - participants, other researchers, program staff, other community members, and so on.
Then we put all data in single framework & apply various statistical tools to find out the dynamic on the market.
During the analysis stage, feedback from the stakeholder groups would be compared to determine areas of agreement as well as areas of divergence
