

Key Insights
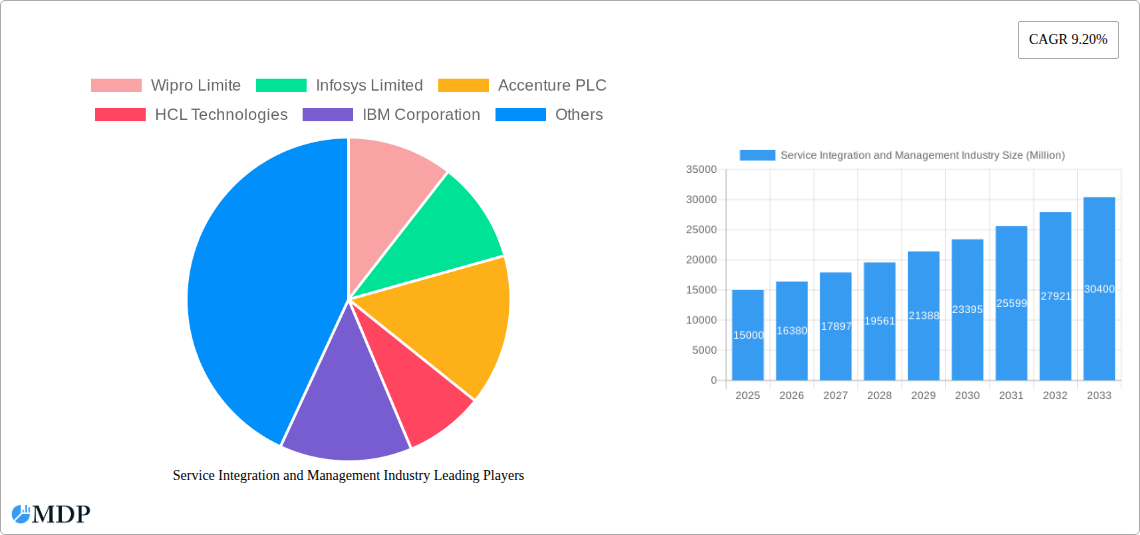
The Service Integration and Management (SIAM) market is experiencing robust growth, projected to reach a significant market size driven by the increasing complexity of IT landscapes and the rising demand for improved IT service delivery. The 9.20% CAGR indicates a substantial expansion over the forecast period (2025-2033), fueled primarily by the adoption of cloud-based solutions, the growing need for digital transformation initiatives across various industries, and a heightened focus on optimizing IT operational efficiency. Large enterprises are currently the leading adopters of SIAM solutions, due to their complex IT infrastructures and the need for centralized management, however, the small and medium-sized enterprises (SME) segment shows considerable growth potential as they increasingly recognize the benefits of streamlined IT operations and cost optimization. The BFSI and IT & Telecom sectors are currently the largest end-user industries, but the healthcare and retail sectors are anticipated to witness significant adoption in the coming years. Geographic expansion continues with North America maintaining a strong market share, while the Asia-Pacific region shows substantial promise due to rapid technological advancements and a growing digital economy. Competitive pressures remain high, with established players like Wipro, Infosys, Accenture, and IBM competing alongside emerging players, encouraging innovation and driving down costs for businesses.
The restraints on market growth primarily include the high initial investment costs associated with SIAM implementation, the complexity of integrating disparate IT systems, and the need for skilled professionals to manage and optimize these solutions. However, the long-term cost savings and improved operational efficiency realized through SIAM adoption are expected to offset these initial challenges. Furthermore, the evolving nature of technology requires continuous adaptation and investment in training and development to ensure effective SIAM implementation and management. The market is witnessing a shift towards outcome-based service models, focusing on business value rather than just technical capabilities. This trend is further accelerated by the increased adoption of automation and artificial intelligence (AI) to enhance service delivery efficiency and reduce manual intervention. The continued growth of the SIAM market is poised to reshape the IT service landscape, offering businesses greater agility, cost-effectiveness, and improved alignment with business objectives.
Service Integration and Management (SIAM) Industry Market Report: 2019-2033
This comprehensive report provides a detailed analysis of the Service Integration and Management (SIAM) industry, offering invaluable insights for stakeholders seeking to navigate this dynamic market. With a study period spanning 2019-2033, a base year of 2025, and a forecast period of 2025-2033, this report covers market size, growth drivers, challenges, leading players, and emerging opportunities, presenting a complete picture of the SIAM landscape. The report analyzes a market valued at over $XX Million in 2024, projected to reach $XX Million by 2033.
Service Integration and Management Industry Market Dynamics & Concentration
The Service Integration and Management (SIAM) market is characterized by moderate concentration, with several major players holding significant market share. The market share of the top five companies – Wipro Limited, Infosys Limited, Accenture PLC, HCL Technologies, and IBM Corporation – collectively accounts for approximately XX% of the global market in 2024. This concentration is driven by their established global presence, extensive service portfolios, and strong client relationships. However, the market also shows signs of increasing fragmentation, with smaller specialized firms entering the market and focusing on niche areas.
Several factors drive innovation within the SIAM industry. These include:
- Increased demand for cloud-based services: The migration to cloud platforms requires sophisticated integration and management capabilities, fueling the growth of SIAM providers.
- Growing adoption of automation: Automation tools are streamlining SIAM operations, enhancing efficiency and reducing costs.
- Stringent regulatory requirements: Compliance with industry-specific regulations drives demand for robust SIAM solutions.
Mergers and acquisitions (M&A) activity is also shaping the industry landscape. In recent years, there has been a notable increase in M&A activity, with an estimated XX number of deals in the last five years. These deals primarily aim to expand service offerings, enhance geographic reach, and consolidate market share. The average deal size is approximately $XX Million. Significant product substitution is not currently observed, but emerging technologies like AI and Machine Learning could potentially disrupt the market in the coming years. End-user trends indicate a strong preference for integrated solutions that offer comprehensive service management capabilities, cost optimization, and improved operational efficiency.
Service Integration and Management Industry Industry Trends & Analysis
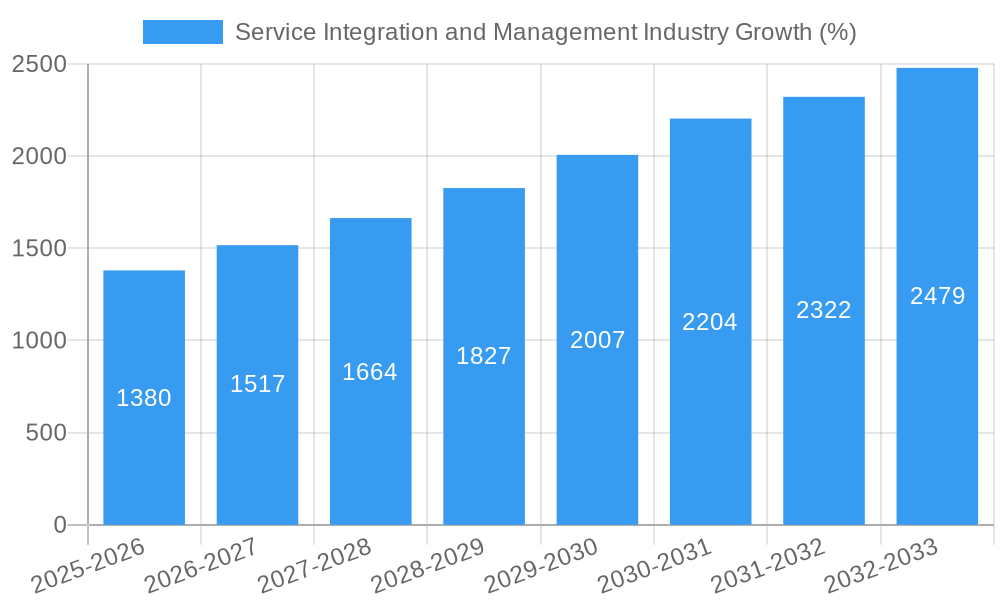
The SIAM market exhibits robust growth, driven by increasing demand for IT services, digital transformation initiatives, and the need for efficient service management across diverse organizations. The Compound Annual Growth Rate (CAGR) for the forecast period (2025-2033) is projected to be XX%. This growth is significantly influenced by the rising adoption of cloud computing and the need for integrated IT solutions. Market penetration is high among large enterprises, with smaller and medium enterprises (SMEs) showing a significant potential for future growth.
Technological disruptions, including advancements in artificial intelligence (AI), machine learning (ML), and automation, are revolutionizing SIAM. AI-powered tools enhance service monitoring, incident resolution, and predictive analytics. This leads to improved service quality, reduced operational costs, and enhanced customer satisfaction. Consumer preferences are shifting towards flexible, scalable, and cost-effective solutions delivered through various service models, such as cloud-based and on-premise options. Competitive dynamics are marked by intense competition among established players and the emergence of new entrants offering innovative solutions and services.
Leading Markets & Segments in Service Integration and Management Industry
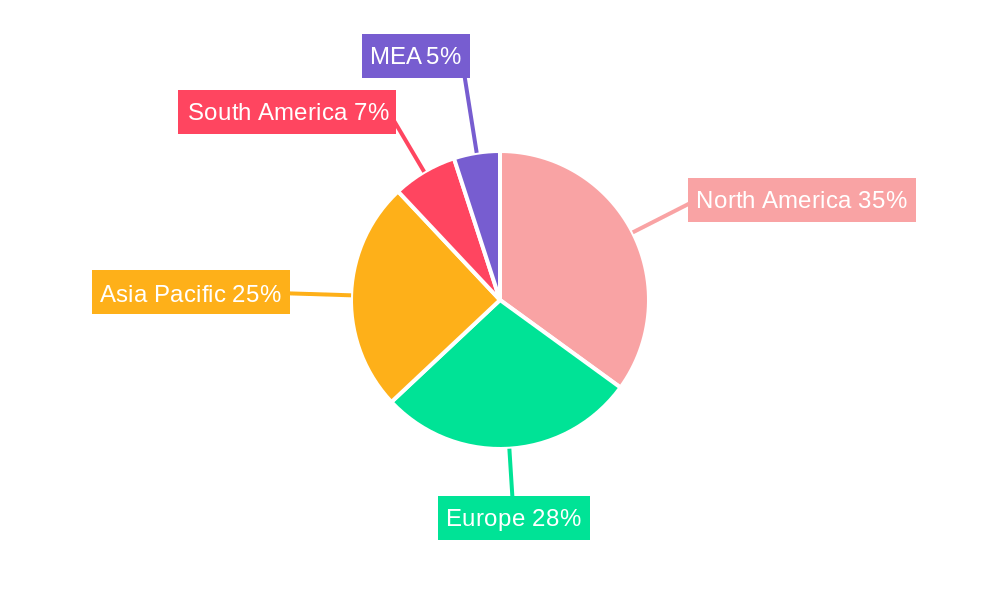
The North American region currently dominates the global SIAM market, accounting for approximately XX% of the total revenue in 2024. Key drivers include strong IT spending, advanced technological infrastructure, and a high adoption rate of cloud services. Within the segments, the Large Enterprises segment is the most dominant, contributing XX% to the total market revenue. This is largely due to their greater IT budgets and complex service management needs. In terms of end-user industries, the BFSI (Banking, Financial Services, and Insurance) sector is a major consumer of SIAM services due to its stringent regulatory requirements and the need for high levels of security and reliability.
- Key drivers for North American dominance: Strong IT spending, advanced technological infrastructure, high adoption of cloud services, robust regulatory framework.
- Key drivers for Large Enterprises segment dominance: Complex service management needs, higher IT budgets, strategic focus on operational efficiency.
- Key drivers for BFSI sector dominance: Stringent regulatory requirements, need for high levels of security and reliability, critical business operations dependence on IT.
Other significant regions include Europe and Asia-Pacific, exhibiting significant growth potential. The BFSI, IT and Telecom, and Healthcare sectors are showing significant growth across different regions.
Service Integration and Management Industry Product Developments
Recent product innovations focus on AI-powered automation, improved service orchestration capabilities, and enhanced self-service portals. These developments aim to improve service agility, reduce operational costs, and enhance the overall user experience. The competitive advantage lies in providing integrated solutions that cater to the specific needs of various industries, ensuring scalability, security, and compliance. The integration of AI and ML into SIAM platforms enables predictive analytics, automated incident resolution, and proactive service management, offering significant value to customers.
Key Drivers of Service Integration and Management Industry Growth
The SIAM market's growth is propelled by factors like the increasing adoption of cloud-based services, the growing demand for digital transformation solutions, and the need for optimized IT service management. Increased regulatory compliance requirements and the rising complexity of IT infrastructures are further driving market expansion. Cost optimization and improved operational efficiency are also significant drivers, as organizations seek to maximize the return on their IT investments.
Challenges in the Service Integration and Management Industry Market
The SIAM market faces challenges such as the complexity of integrating diverse IT systems, the need for skilled professionals, and the pressure to maintain high service levels while managing costs. Supply chain disruptions can impact the timely delivery of services, and competitive pressures from emerging vendors can put pressure on pricing and margins. These factors can collectively impact profitability and market penetration, although the exact quantifiable impact varies based on individual companies and market conditions.
Emerging Opportunities in Service Integration and Management Industry
The future of the SIAM market holds significant opportunities. The increasing adoption of AI and ML will enable more efficient and predictive service management. Strategic partnerships between SIAM providers and technology vendors can create innovative and integrated solutions. Expansion into emerging markets, particularly in Asia-Pacific and Latin America, represents significant growth potential. These trends will contribute to the continued growth and transformation of the SIAM market.
Leading Players in the Service Integration and Management Industry Sector
- Wipro Limited
- Infosys Limited
- Accenture PLC
- HCL Technologies
- IBM Corporation
- Capgemini SE
- Hewlett Packard Enterprise (HPE)
- Fujitsu Limited
- Mindtree Limited
- AtoS SE
Key Milestones in Service Integration and Management Industry Industry
- August 2021: Perspecta Enterprise Solutions LLC, as contractor team arrangement (CTA) lead, and Capgemini Government Solutions LLC, as a CTA member, were awarded a USD 2 Billion BPA (HT001521A0002) for the Military Health System Enterprise Information Technology Services Integrator (EITSI). This highlights the growing importance of SIAM in large-scale government IT projects.
- March 2020: Infosys and IBM partnered to accelerate digital transformation using IBM cloud services. This collaboration demonstrates the increasing importance of cloud-based SIAM solutions and strategic partnerships in the industry.
Strategic Outlook for Service Integration and Management Industry Market
The SIAM market is poised for continued growth, driven by technological advancements, increased demand for digital transformation, and the growing need for efficient service management. Opportunities exist in expanding AI and ML capabilities, building strong strategic partnerships, and exploring new market segments. The focus on creating flexible, scalable, and cost-effective solutions will be crucial for success in this competitive market. The market's future is bright, offering significant potential for players who can adapt to changing technologies and customer demands.
Service Integration and Management Industry Segmentation
-
1. Component
-
1.1. Solutions
- 1.1.1. Business Solutions
- 1.1.2. Technology Solutions
- 1.2. Services
-
1.1. Solutions
-
2. Organization Size
- 2.1. Small and Medium Enterprises
- 2.2. Large Enterprises
-
3. End user Industry
- 3.1. BFSI
- 3.2. IT and Telecom
- 3.3. Healthcare
- 3.4. Retail
- 3.5. Other End-user Industries
Service Integration and Management Industry Segmentation By Geography
- 1. North America
- 2. Europe
- 3. Asia Pacific
- 4. Rest of the World
Service Integration and Management Industry REPORT HIGHLIGHTS
| Aspects | Details |
|---|---|
| Study Period | 2019-2033 |
| Base Year | 2024 |
| Estimated Year | 2025 |
| Forecast Period | 2025-2033 |
| Historical Period | 2019-2024 |
| Growth Rate | CAGR of 9.20% from 2019-2033 |
| Segmentation |
|
Table of Contents
- 1. Introduction
- 1.1. Research Scope
- 1.2. Market Segmentation
- 1.3. Research Methodology
- 1.4. Definitions and Assumptions
- 2. Executive Summary
- 2.1. Introduction
- 3. Market Dynamics
- 3.1. Introduction
- 3.2. Market Drivers
- 3.2.1. Increasing Complexities of Service Management; Increasing Demand for Multi-Vendor Outsourcing
- 3.3. Market Restrains
- 3.3.1. Lack of Uniform SLAs and Regulatory Compliances
- 3.4. Market Trends
- 3.4.1. Cloud Technology to witness significant growth
- 4. Market Factor Analysis
- 4.1. Porters Five Forces
- 4.2. Supply/Value Chain
- 4.3. PESTEL analysis
- 4.4. Market Entropy
- 4.5. Patent/Trademark Analysis
- 5. Global Service Integration and Management Industry Analysis, Insights and Forecast, 2019-2031
- 5.1. Market Analysis, Insights and Forecast - by Component
- 5.1.1. Solutions
- 5.1.1.1. Business Solutions
- 5.1.1.2. Technology Solutions
- 5.1.2. Services
- 5.1.1. Solutions
- 5.2. Market Analysis, Insights and Forecast - by Organization Size
- 5.2.1. Small and Medium Enterprises
- 5.2.2. Large Enterprises
- 5.3. Market Analysis, Insights and Forecast - by End user Industry
- 5.3.1. BFSI
- 5.3.2. IT and Telecom
- 5.3.3. Healthcare
- 5.3.4. Retail
- 5.3.5. Other End-user Industries
- 5.4. Market Analysis, Insights and Forecast - by Region
- 5.4.1. North America
- 5.4.2. Europe
- 5.4.3. Asia Pacific
- 5.4.4. Rest of the World
- 5.1. Market Analysis, Insights and Forecast - by Component
- 6. North America Service Integration and Management Industry Analysis, Insights and Forecast, 2019-2031
- 6.1. Market Analysis, Insights and Forecast - by Component
- 6.1.1. Solutions
- 6.1.1.1. Business Solutions
- 6.1.1.2. Technology Solutions
- 6.1.2. Services
- 6.1.1. Solutions
- 6.2. Market Analysis, Insights and Forecast - by Organization Size
- 6.2.1. Small and Medium Enterprises
- 6.2.2. Large Enterprises
- 6.3. Market Analysis, Insights and Forecast - by End user Industry
- 6.3.1. BFSI
- 6.3.2. IT and Telecom
- 6.3.3. Healthcare
- 6.3.4. Retail
- 6.3.5. Other End-user Industries
- 6.1. Market Analysis, Insights and Forecast - by Component
- 7. Europe Service Integration and Management Industry Analysis, Insights and Forecast, 2019-2031
- 7.1. Market Analysis, Insights and Forecast - by Component
- 7.1.1. Solutions
- 7.1.1.1. Business Solutions
- 7.1.1.2. Technology Solutions
- 7.1.2. Services
- 7.1.1. Solutions
- 7.2. Market Analysis, Insights and Forecast - by Organization Size
- 7.2.1. Small and Medium Enterprises
- 7.2.2. Large Enterprises
- 7.3. Market Analysis, Insights and Forecast - by End user Industry
- 7.3.1. BFSI
- 7.3.2. IT and Telecom
- 7.3.3. Healthcare
- 7.3.4. Retail
- 7.3.5. Other End-user Industries
- 7.1. Market Analysis, Insights and Forecast - by Component
- 8. Asia Pacific Service Integration and Management Industry Analysis, Insights and Forecast, 2019-2031
- 8.1. Market Analysis, Insights and Forecast - by Component
- 8.1.1. Solutions
- 8.1.1.1. Business Solutions
- 8.1.1.2. Technology Solutions
- 8.1.2. Services
- 8.1.1. Solutions
- 8.2. Market Analysis, Insights and Forecast - by Organization Size
- 8.2.1. Small and Medium Enterprises
- 8.2.2. Large Enterprises
- 8.3. Market Analysis, Insights and Forecast - by End user Industry
- 8.3.1. BFSI
- 8.3.2. IT and Telecom
- 8.3.3. Healthcare
- 8.3.4. Retail
- 8.3.5. Other End-user Industries
- 8.1. Market Analysis, Insights and Forecast - by Component
- 9. Rest of the World Service Integration and Management Industry Analysis, Insights and Forecast, 2019-2031
- 9.1. Market Analysis, Insights and Forecast - by Component
- 9.1.1. Solutions
- 9.1.1.1. Business Solutions
- 9.1.1.2. Technology Solutions
- 9.1.2. Services
- 9.1.1. Solutions
- 9.2. Market Analysis, Insights and Forecast - by Organization Size
- 9.2.1. Small and Medium Enterprises
- 9.2.2. Large Enterprises
- 9.3. Market Analysis, Insights and Forecast - by End user Industry
- 9.3.1. BFSI
- 9.3.2. IT and Telecom
- 9.3.3. Healthcare
- 9.3.4. Retail
- 9.3.5. Other End-user Industries
- 9.1. Market Analysis, Insights and Forecast - by Component
- 10. North America Service Integration and Management Industry Analysis, Insights and Forecast, 2019-2031
- 10.1. Market Analysis, Insights and Forecast - By Country/Sub-region
- 10.1.1 United States
- 10.1.2 Canada
- 10.1.3 Mexico
- 11. Europe Service Integration and Management Industry Analysis, Insights and Forecast, 2019-2031
- 11.1. Market Analysis, Insights and Forecast - By Country/Sub-region
- 11.1.1 Germany
- 11.1.2 United Kingdom
- 11.1.3 France
- 11.1.4 Spain
- 11.1.5 Italy
- 11.1.6 Spain
- 11.1.7 Belgium
- 11.1.8 Netherland
- 11.1.9 Nordics
- 11.1.10 Rest of Europe
- 12. Asia Pacific Service Integration and Management Industry Analysis, Insights and Forecast, 2019-2031
- 12.1. Market Analysis, Insights and Forecast - By Country/Sub-region
- 12.1.1 China
- 12.1.2 Japan
- 12.1.3 India
- 12.1.4 South Korea
- 12.1.5 Southeast Asia
- 12.1.6 Australia
- 12.1.7 Indonesia
- 12.1.8 Phillipes
- 12.1.9 Singapore
- 12.1.10 Thailandc
- 12.1.11 Rest of Asia Pacific
- 13. South America Service Integration and Management Industry Analysis, Insights and Forecast, 2019-2031
- 13.1. Market Analysis, Insights and Forecast - By Country/Sub-region
- 13.1.1 Brazil
- 13.1.2 Argentina
- 13.1.3 Peru
- 13.1.4 Chile
- 13.1.5 Colombia
- 13.1.6 Ecuador
- 13.1.7 Venezuela
- 13.1.8 Rest of South America
- 14. North America Service Integration and Management Industry Analysis, Insights and Forecast, 2019-2031
- 14.1. Market Analysis, Insights and Forecast - By Country/Sub-region
- 14.1.1 United States
- 14.1.2 Canada
- 14.1.3 Mexico
- 15. MEA Service Integration and Management Industry Analysis, Insights and Forecast, 2019-2031
- 15.1. Market Analysis, Insights and Forecast - By Country/Sub-region
- 15.1.1 United Arab Emirates
- 15.1.2 Saudi Arabia
- 15.1.3 South Africa
- 15.1.4 Rest of Middle East and Africa
- 16. Competitive Analysis
- 16.1. Global Market Share Analysis 2024
- 16.2. Company Profiles
- 16.2.1 Wipro Limite
- 16.2.1.1. Overview
- 16.2.1.2. Products
- 16.2.1.3. SWOT Analysis
- 16.2.1.4. Recent Developments
- 16.2.1.5. Financials (Based on Availability)
- 16.2.2 Infosys Limited
- 16.2.2.1. Overview
- 16.2.2.2. Products
- 16.2.2.3. SWOT Analysis
- 16.2.2.4. Recent Developments
- 16.2.2.5. Financials (Based on Availability)
- 16.2.3 Accenture PLC
- 16.2.3.1. Overview
- 16.2.3.2. Products
- 16.2.3.3. SWOT Analysis
- 16.2.3.4. Recent Developments
- 16.2.3.5. Financials (Based on Availability)
- 16.2.4 HCL Technologies
- 16.2.4.1. Overview
- 16.2.4.2. Products
- 16.2.4.3. SWOT Analysis
- 16.2.4.4. Recent Developments
- 16.2.4.5. Financials (Based on Availability)
- 16.2.5 IBM Corporation
- 16.2.5.1. Overview
- 16.2.5.2. Products
- 16.2.5.3. SWOT Analysis
- 16.2.5.4. Recent Developments
- 16.2.5.5. Financials (Based on Availability)
- 16.2.6 Capgemini SE
- 16.2.6.1. Overview
- 16.2.6.2. Products
- 16.2.6.3. SWOT Analysis
- 16.2.6.4. Recent Developments
- 16.2.6.5. Financials (Based on Availability)
- 16.2.7 Hewlett Packard Enterprise (HPE)
- 16.2.7.1. Overview
- 16.2.7.2. Products
- 16.2.7.3. SWOT Analysis
- 16.2.7.4. Recent Developments
- 16.2.7.5. Financials (Based on Availability)
- 16.2.8 Fujitsu Limited
- 16.2.8.1. Overview
- 16.2.8.2. Products
- 16.2.8.3. SWOT Analysis
- 16.2.8.4. Recent Developments
- 16.2.8.5. Financials (Based on Availability)
- 16.2.9 Mindtree Limited
- 16.2.9.1. Overview
- 16.2.9.2. Products
- 16.2.9.3. SWOT Analysis
- 16.2.9.4. Recent Developments
- 16.2.9.5. Financials (Based on Availability)
- 16.2.10 AtoS SE
- 16.2.10.1. Overview
- 16.2.10.2. Products
- 16.2.10.3. SWOT Analysis
- 16.2.10.4. Recent Developments
- 16.2.10.5. Financials (Based on Availability)
- 16.2.1 Wipro Limite
List of Figures
- Figure 1: Global Service Integration and Management Industry Revenue Breakdown (Million, %) by Region 2024 & 2032
- Figure 2: North America Service Integration and Management Industry Revenue (Million), by Country 2024 & 2032
- Figure 3: North America Service Integration and Management Industry Revenue Share (%), by Country 2024 & 2032
- Figure 4: Europe Service Integration and Management Industry Revenue (Million), by Country 2024 & 2032
- Figure 5: Europe Service Integration and Management Industry Revenue Share (%), by Country 2024 & 2032
- Figure 6: Asia Pacific Service Integration and Management Industry Revenue (Million), by Country 2024 & 2032
- Figure 7: Asia Pacific Service Integration and Management Industry Revenue Share (%), by Country 2024 & 2032
- Figure 8: South America Service Integration and Management Industry Revenue (Million), by Country 2024 & 2032
- Figure 9: South America Service Integration and Management Industry Revenue Share (%), by Country 2024 & 2032
- Figure 10: North America Service Integration and Management Industry Revenue (Million), by Country 2024 & 2032
- Figure 11: North America Service Integration and Management Industry Revenue Share (%), by Country 2024 & 2032
- Figure 12: MEA Service Integration and Management Industry Revenue (Million), by Country 2024 & 2032
- Figure 13: MEA Service Integration and Management Industry Revenue Share (%), by Country 2024 & 2032
- Figure 14: North America Service Integration and Management Industry Revenue (Million), by Component 2024 & 2032
- Figure 15: North America Service Integration and Management Industry Revenue Share (%), by Component 2024 & 2032
- Figure 16: North America Service Integration and Management Industry Revenue (Million), by Organization Size 2024 & 2032
- Figure 17: North America Service Integration and Management Industry Revenue Share (%), by Organization Size 2024 & 2032
- Figure 18: North America Service Integration and Management Industry Revenue (Million), by End user Industry 2024 & 2032
- Figure 19: North America Service Integration and Management Industry Revenue Share (%), by End user Industry 2024 & 2032
- Figure 20: North America Service Integration and Management Industry Revenue (Million), by Country 2024 & 2032
- Figure 21: North America Service Integration and Management Industry Revenue Share (%), by Country 2024 & 2032
- Figure 22: Europe Service Integration and Management Industry Revenue (Million), by Component 2024 & 2032
- Figure 23: Europe Service Integration and Management Industry Revenue Share (%), by Component 2024 & 2032
- Figure 24: Europe Service Integration and Management Industry Revenue (Million), by Organization Size 2024 & 2032
- Figure 25: Europe Service Integration and Management Industry Revenue Share (%), by Organization Size 2024 & 2032
- Figure 26: Europe Service Integration and Management Industry Revenue (Million), by End user Industry 2024 & 2032
- Figure 27: Europe Service Integration and Management Industry Revenue Share (%), by End user Industry 2024 & 2032
- Figure 28: Europe Service Integration and Management Industry Revenue (Million), by Country 2024 & 2032
- Figure 29: Europe Service Integration and Management Industry Revenue Share (%), by Country 2024 & 2032
- Figure 30: Asia Pacific Service Integration and Management Industry Revenue (Million), by Component 2024 & 2032
- Figure 31: Asia Pacific Service Integration and Management Industry Revenue Share (%), by Component 2024 & 2032
- Figure 32: Asia Pacific Service Integration and Management Industry Revenue (Million), by Organization Size 2024 & 2032
- Figure 33: Asia Pacific Service Integration and Management Industry Revenue Share (%), by Organization Size 2024 & 2032
- Figure 34: Asia Pacific Service Integration and Management Industry Revenue (Million), by End user Industry 2024 & 2032
- Figure 35: Asia Pacific Service Integration and Management Industry Revenue Share (%), by End user Industry 2024 & 2032
- Figure 36: Asia Pacific Service Integration and Management Industry Revenue (Million), by Country 2024 & 2032
- Figure 37: Asia Pacific Service Integration and Management Industry Revenue Share (%), by Country 2024 & 2032
- Figure 38: Rest of the World Service Integration and Management Industry Revenue (Million), by Component 2024 & 2032
- Figure 39: Rest of the World Service Integration and Management Industry Revenue Share (%), by Component 2024 & 2032
- Figure 40: Rest of the World Service Integration and Management Industry Revenue (Million), by Organization Size 2024 & 2032
- Figure 41: Rest of the World Service Integration and Management Industry Revenue Share (%), by Organization Size 2024 & 2032
- Figure 42: Rest of the World Service Integration and Management Industry Revenue (Million), by End user Industry 2024 & 2032
- Figure 43: Rest of the World Service Integration and Management Industry Revenue Share (%), by End user Industry 2024 & 2032
- Figure 44: Rest of the World Service Integration and Management Industry Revenue (Million), by Country 2024 & 2032
- Figure 45: Rest of the World Service Integration and Management Industry Revenue Share (%), by Country 2024 & 2032
List of Tables
- Table 1: Global Service Integration and Management Industry Revenue Million Forecast, by Region 2019 & 2032
- Table 2: Global Service Integration and Management Industry Revenue Million Forecast, by Component 2019 & 2032
- Table 3: Global Service Integration and Management Industry Revenue Million Forecast, by Organization Size 2019 & 2032
- Table 4: Global Service Integration and Management Industry Revenue Million Forecast, by End user Industry 2019 & 2032
- Table 5: Global Service Integration and Management Industry Revenue Million Forecast, by Region 2019 & 2032
- Table 6: Global Service Integration and Management Industry Revenue Million Forecast, by Country 2019 & 2032
- Table 7: United States Service Integration and Management Industry Revenue (Million) Forecast, by Application 2019 & 2032
- Table 8: Canada Service Integration and Management Industry Revenue (Million) Forecast, by Application 2019 & 2032
- Table 9: Mexico Service Integration and Management Industry Revenue (Million) Forecast, by Application 2019 & 2032
- Table 10: Global Service Integration and Management Industry Revenue Million Forecast, by Country 2019 & 2032
- Table 11: Germany Service Integration and Management Industry Revenue (Million) Forecast, by Application 2019 & 2032
- Table 12: United Kingdom Service Integration and Management Industry Revenue (Million) Forecast, by Application 2019 & 2032
- Table 13: France Service Integration and Management Industry Revenue (Million) Forecast, by Application 2019 & 2032
- Table 14: Spain Service Integration and Management Industry Revenue (Million) Forecast, by Application 2019 & 2032
- Table 15: Italy Service Integration and Management Industry Revenue (Million) Forecast, by Application 2019 & 2032
- Table 16: Spain Service Integration and Management Industry Revenue (Million) Forecast, by Application 2019 & 2032
- Table 17: Belgium Service Integration and Management Industry Revenue (Million) Forecast, by Application 2019 & 2032
- Table 18: Netherland Service Integration and Management Industry Revenue (Million) Forecast, by Application 2019 & 2032
- Table 19: Nordics Service Integration and Management Industry Revenue (Million) Forecast, by Application 2019 & 2032
- Table 20: Rest of Europe Service Integration and Management Industry Revenue (Million) Forecast, by Application 2019 & 2032
- Table 21: Global Service Integration and Management Industry Revenue Million Forecast, by Country 2019 & 2032
- Table 22: China Service Integration and Management Industry Revenue (Million) Forecast, by Application 2019 & 2032
- Table 23: Japan Service Integration and Management Industry Revenue (Million) Forecast, by Application 2019 & 2032
- Table 24: India Service Integration and Management Industry Revenue (Million) Forecast, by Application 2019 & 2032
- Table 25: South Korea Service Integration and Management Industry Revenue (Million) Forecast, by Application 2019 & 2032
- Table 26: Southeast Asia Service Integration and Management Industry Revenue (Million) Forecast, by Application 2019 & 2032
- Table 27: Australia Service Integration and Management Industry Revenue (Million) Forecast, by Application 2019 & 2032
- Table 28: Indonesia Service Integration and Management Industry Revenue (Million) Forecast, by Application 2019 & 2032
- Table 29: Phillipes Service Integration and Management Industry Revenue (Million) Forecast, by Application 2019 & 2032
- Table 30: Singapore Service Integration and Management Industry Revenue (Million) Forecast, by Application 2019 & 2032
- Table 31: Thailandc Service Integration and Management Industry Revenue (Million) Forecast, by Application 2019 & 2032
- Table 32: Rest of Asia Pacific Service Integration and Management Industry Revenue (Million) Forecast, by Application 2019 & 2032
- Table 33: Global Service Integration and Management Industry Revenue Million Forecast, by Country 2019 & 2032
- Table 34: Brazil Service Integration and Management Industry Revenue (Million) Forecast, by Application 2019 & 2032
- Table 35: Argentina Service Integration and Management Industry Revenue (Million) Forecast, by Application 2019 & 2032
- Table 36: Peru Service Integration and Management Industry Revenue (Million) Forecast, by Application 2019 & 2032
- Table 37: Chile Service Integration and Management Industry Revenue (Million) Forecast, by Application 2019 & 2032
- Table 38: Colombia Service Integration and Management Industry Revenue (Million) Forecast, by Application 2019 & 2032
- Table 39: Ecuador Service Integration and Management Industry Revenue (Million) Forecast, by Application 2019 & 2032
- Table 40: Venezuela Service Integration and Management Industry Revenue (Million) Forecast, by Application 2019 & 2032
- Table 41: Rest of South America Service Integration and Management Industry Revenue (Million) Forecast, by Application 2019 & 2032
- Table 42: Global Service Integration and Management Industry Revenue Million Forecast, by Country 2019 & 2032
- Table 43: United States Service Integration and Management Industry Revenue (Million) Forecast, by Application 2019 & 2032
- Table 44: Canada Service Integration and Management Industry Revenue (Million) Forecast, by Application 2019 & 2032
- Table 45: Mexico Service Integration and Management Industry Revenue (Million) Forecast, by Application 2019 & 2032
- Table 46: Global Service Integration and Management Industry Revenue Million Forecast, by Country 2019 & 2032
- Table 47: United Arab Emirates Service Integration and Management Industry Revenue (Million) Forecast, by Application 2019 & 2032
- Table 48: Saudi Arabia Service Integration and Management Industry Revenue (Million) Forecast, by Application 2019 & 2032
- Table 49: South Africa Service Integration and Management Industry Revenue (Million) Forecast, by Application 2019 & 2032
- Table 50: Rest of Middle East and Africa Service Integration and Management Industry Revenue (Million) Forecast, by Application 2019 & 2032
- Table 51: Global Service Integration and Management Industry Revenue Million Forecast, by Component 2019 & 2032
- Table 52: Global Service Integration and Management Industry Revenue Million Forecast, by Organization Size 2019 & 2032
- Table 53: Global Service Integration and Management Industry Revenue Million Forecast, by End user Industry 2019 & 2032
- Table 54: Global Service Integration and Management Industry Revenue Million Forecast, by Country 2019 & 2032
- Table 55: Global Service Integration and Management Industry Revenue Million Forecast, by Component 2019 & 2032
- Table 56: Global Service Integration and Management Industry Revenue Million Forecast, by Organization Size 2019 & 2032
- Table 57: Global Service Integration and Management Industry Revenue Million Forecast, by End user Industry 2019 & 2032
- Table 58: Global Service Integration and Management Industry Revenue Million Forecast, by Country 2019 & 2032
- Table 59: Global Service Integration and Management Industry Revenue Million Forecast, by Component 2019 & 2032
- Table 60: Global Service Integration and Management Industry Revenue Million Forecast, by Organization Size 2019 & 2032
- Table 61: Global Service Integration and Management Industry Revenue Million Forecast, by End user Industry 2019 & 2032
- Table 62: Global Service Integration and Management Industry Revenue Million Forecast, by Country 2019 & 2032
- Table 63: Global Service Integration and Management Industry Revenue Million Forecast, by Component 2019 & 2032
- Table 64: Global Service Integration and Management Industry Revenue Million Forecast, by Organization Size 2019 & 2032
- Table 65: Global Service Integration and Management Industry Revenue Million Forecast, by End user Industry 2019 & 2032
- Table 66: Global Service Integration and Management Industry Revenue Million Forecast, by Country 2019 & 2032
Frequently Asked Questions
1. What is the projected Compound Annual Growth Rate (CAGR) of the Service Integration and Management Industry?
The projected CAGR is approximately 9.20%.
2. Which companies are prominent players in the Service Integration and Management Industry?
Key companies in the market include Wipro Limite, Infosys Limited, Accenture PLC, HCL Technologies, IBM Corporation, Capgemini SE, Hewlett Packard Enterprise (HPE), Fujitsu Limited, Mindtree Limited, AtoS SE.
3. What are the main segments of the Service Integration and Management Industry?
The market segments include Component, Organization Size, End user Industry.
4. Can you provide details about the market size?
The market size is estimated to be USD XX Million as of 2022.
5. What are some drivers contributing to market growth?
Increasing Complexities of Service Management; Increasing Demand for Multi-Vendor Outsourcing.
6. What are the notable trends driving market growth?
Cloud Technology to witness significant growth.
7. Are there any restraints impacting market growth?
Lack of Uniform SLAs and Regulatory Compliances.
8. Can you provide examples of recent developments in the market?
August 2021 - Perspecta Enterprise Solutions LLC, as contractor team arrangement (CTA) lead with Capgemini Government Solutions LLC, as a CTA member, was awarded a single award, firm-fixed-price, blanket purchase agreement (BPA) with an ordering ceiling of USD 2 billion. BPA HT001521A0002 represents the Military Health System Enterprise Information Technology Services Integrator (EITSI). The EITSI would use a multisourcing services integrator approach to coordinate, integrate, and manage the Defense Health Agency's (DHA) IT transformation to consolidate services and reduce costs.
9. What pricing options are available for accessing the report?
Pricing options include single-user, multi-user, and enterprise licenses priced at USD 4750, USD 5250, and USD 8750 respectively.
10. Is the market size provided in terms of value or volume?
The market size is provided in terms of value, measured in Million.
11. Are there any specific market keywords associated with the report?
Yes, the market keyword associated with the report is "Service Integration and Management Industry," which aids in identifying and referencing the specific market segment covered.
12. How do I determine which pricing option suits my needs best?
The pricing options vary based on user requirements and access needs. Individual users may opt for single-user licenses, while businesses requiring broader access may choose multi-user or enterprise licenses for cost-effective access to the report.
13. Are there any additional resources or data provided in the Service Integration and Management Industry report?
While the report offers comprehensive insights, it's advisable to review the specific contents or supplementary materials provided to ascertain if additional resources or data are available.
14. How can I stay updated on further developments or reports in the Service Integration and Management Industry?
To stay informed about further developments, trends, and reports in the Service Integration and Management Industry, consider subscribing to industry newsletters, following relevant companies and organizations, or regularly checking reputable industry news sources and publications.
Methodology
Step 1 - Identification of Relevant Samples Size from Population Database


Step 2 - Approaches for Defining Global Market Size (Value, Volume* & Price*)

Note*: In applicable scenarios
Step 3 - Data Sources
Primary Research
- Web Analytics
- Survey Reports
- Research Institute
- Latest Research Reports
- Opinion Leaders
Secondary Research
- Annual Reports
- White Paper
- Latest Press Release
- Industry Association
- Paid Database
- Investor Presentations

Step 4 - Data Triangulation
Involves using different sources of information in order to increase the validity of a study
These sources are likely to be stakeholders in a program - participants, other researchers, program staff, other community members, and so on.
Then we put all data in single framework & apply various statistical tools to find out the dynamic on the market.
During the analysis stage, feedback from the stakeholder groups would be compared to determine areas of agreement as well as areas of divergence
