

Key Insights
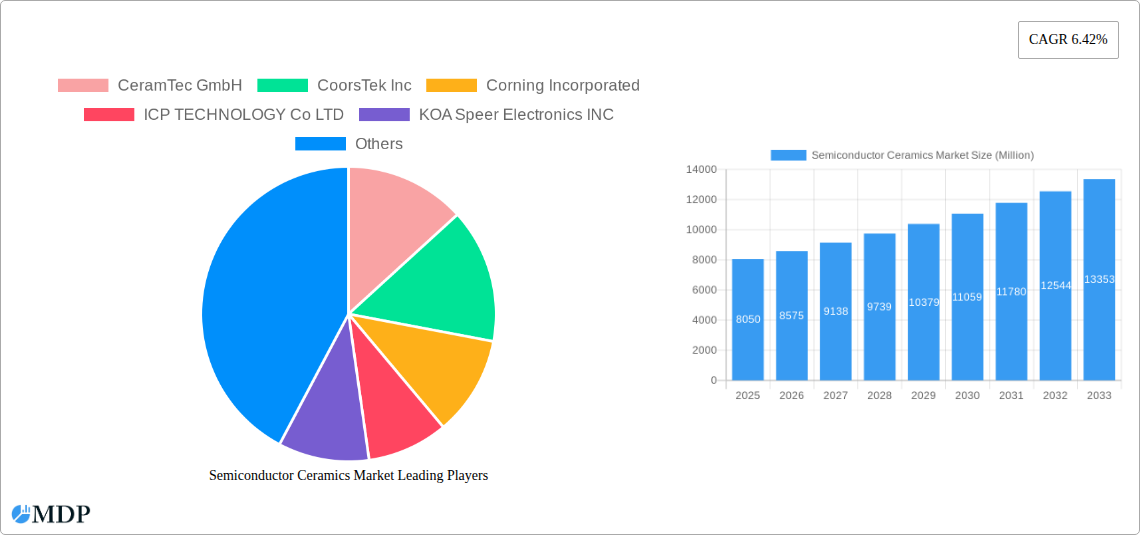
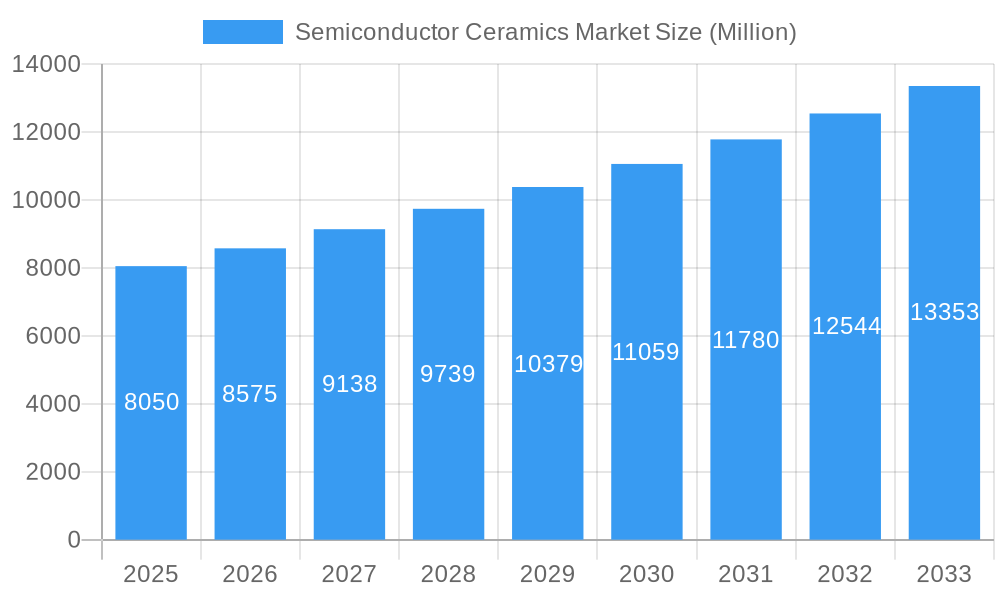
The semiconductor ceramics market, valued at $8.05 billion in 2025, is projected to experience robust growth, driven by the increasing demand for advanced semiconductor devices in diverse applications like 5G infrastructure, high-performance computing, and electric vehicles. The market's Compound Annual Growth Rate (CAGR) of 6.42% from 2025 to 2033 indicates a significant expansion, fueled by continuous technological advancements in miniaturization and improved thermal management capabilities of semiconductor packaging. Key drivers include the rising adoption of advanced packaging technologies like 3D integration and heterogeneous integration, which necessitate the use of high-performance ceramic substrates. Furthermore, the growing demand for high-frequency applications and the need for improved reliability and durability of semiconductor devices are contributing significantly to market growth. The industry's competitive landscape features several established players such as CeramTec GmbH, CoorsTek Inc., and Corning Incorporated, alongside several other significant players involved in manufacturing and supplying advanced ceramic materials and components. These companies are continuously investing in research and development to introduce innovative materials and processes capable of meeting the evolving demands of the semiconductor industry.
Semiconductor Ceramics Market Market Size (In Billion)
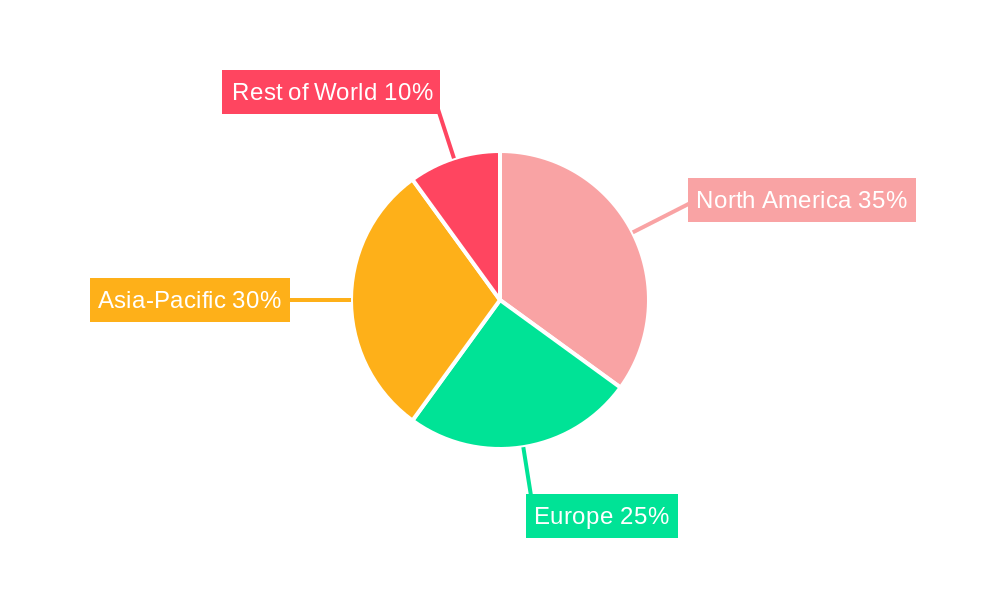
The market segmentation, although not explicitly detailed, is expected to encompass various types of ceramic materials (e.g., alumina, silicon carbide, and aluminum nitride), based on their distinct properties and applications within the semiconductor industry. Geographical segments will likely include North America, Europe, Asia-Pacific, and other regions, reflecting the varying levels of semiconductor manufacturing and consumption across these areas. Challenges for market growth may include potential supply chain disruptions, fluctuations in raw material prices, and the need for consistent quality control in the manufacturing process to ensure the reliability and performance of ceramic components. Despite these challenges, the ongoing demand for higher performance and efficiency in semiconductor technologies is anticipated to drive the continued growth of the semiconductor ceramics market throughout the forecast period.
Semiconductor Ceramics Market Company Market Share
Semiconductor Ceramics Market: A Comprehensive Report (2019-2033)
This in-depth report provides a comprehensive analysis of the Semiconductor Ceramics Market, offering invaluable insights for industry stakeholders, investors, and strategic decision-makers. With a detailed study period spanning 2019-2033 (Base Year: 2025, Forecast Period: 2025-2033), this report unveils the market's dynamics, growth drivers, challenges, and future opportunities. The report leverages extensive research and data analysis to provide a clear picture of the current market landscape and its trajectory. The market size is projected to reach xx Million by 2033, exhibiting a CAGR of xx% during the forecast period.
Semiconductor Ceramics Market Dynamics & Concentration
The Semiconductor Ceramics Market is characterized by a moderately concentrated landscape, with key players like CeramTec GmbH, CoorsTek Inc., and KYOCERA Corporation holding significant market share. The market's concentration is influenced by factors such as high entry barriers (substantial R&D investment, specialized manufacturing processes), economies of scale, and strong brand recognition. Innovation is a pivotal driver, with continuous advancements in material science and manufacturing techniques leading to the development of high-performance ceramic substrates with enhanced thermal conductivity, flexural strength, and electrical insulation properties. Regulatory frameworks concerning material safety and environmental impact play a crucial role in shaping market dynamics. While direct substitutes are limited, alternative materials like certain polymers are finding niche applications. End-user trends, particularly in the electronics and automotive sectors, significantly influence market demand. M&A activities have been relatively moderate, with xx deals recorded between 2019 and 2024. Major players are strategically focusing on organic growth through product innovation and expansion into high-growth segments.
- Market Share: Top 5 players hold approximately xx% of the market share.
- M&A Deal Count (2019-2024): xx
- Key Innovation Drivers: Advanced material science, improved manufacturing processes, miniaturization demands.
- Regulatory Landscape: Compliance with environmental and safety standards.
Semiconductor Ceramics Market Industry Trends & Analysis
The Semiconductor Ceramics Market is witnessing robust growth, driven by the increasing demand for high-performance electronic components across diverse industries. The automotive sector, particularly electric vehicles (EVs), is a major growth catalyst, requiring advanced ceramic substrates for power electronics and sensors. The renewable energy sector, with its focus on energy efficiency and grid stability, further fuels market expansion. Technological disruptions, such as the development of 5G technology and the Internet of Things (IoT), are contributing to rising demand for miniaturized and highly efficient electronic devices. Consumer preferences for smaller, faster, and more energy-efficient devices are also driving market growth. The competitive landscape is characterized by intense rivalry among established players and emerging entrants, focusing on product differentiation, technological innovation, and strategic partnerships. The market displays a significant penetration in established electronics markets, with continued growth predicted in developing economies.
- CAGR (2025-2033): xx%
- Market Penetration (2025): xx% in key regions.
Leading Markets & Segments in Semiconductor Ceramics Market
The Asia-Pacific region dominates the Semiconductor Ceramics Market, driven by robust growth in the electronics manufacturing industry, particularly in countries like China, Japan, South Korea, and Taiwan. This dominance is attributed to factors such as a large manufacturing base, substantial government investment in technology, and strong demand from the consumer electronics and automotive industries.
- Key Drivers in Asia-Pacific:
- Strong electronics manufacturing base.
- High consumer electronics demand.
- Government support for technological advancements.
- Rapid growth in the automotive industry.
- Dominance Analysis: The concentration of major semiconductor manufacturers in the region directly correlates with the high demand for high-performance ceramic substrates.
Semiconductor Ceramics Market Product Developments
Recent product developments highlight advancements in material composition and manufacturing processes, resulting in ceramic substrates with superior thermal conductivity, flexural strength, and electrical insulation. These innovations cater to the increasing demand for miniaturization and higher power density in electronic devices. The focus is on developing materials that can withstand extreme temperatures and harsh operating conditions. CeramTec's recent launch of Sinalit (Si3N4) and Rubalit ZTA demonstrates this trend.
Key Drivers of Semiconductor Ceramics Market Growth
The Semiconductor Ceramics Market's growth is propelled by several key factors:
- Technological advancements: Miniaturization in electronics, 5G deployment, and the rise of IoT are boosting demand.
- Economic growth: Increased disposable incomes and rising demand for electronic devices in developing economies.
- Government initiatives: Policies promoting renewable energy and electric vehicle adoption are fueling demand.
Challenges in the Semiconductor Ceramics Market
The market faces several challenges:
- Supply chain disruptions: Geopolitical factors and raw material price volatility impact production and costs.
- Intense competition: Established players and new entrants compete fiercely, leading to price pressures.
- Regulatory compliance: Meeting stringent environmental and safety standards adds to production costs.
Emerging Opportunities in Semiconductor Ceramics Market
Long-term growth potential stems from:
- Technological breakthroughs: Development of new materials with enhanced properties.
- Strategic partnerships: Collaboration among manufacturers, research institutions, and end-users.
- Market expansion: Penetration into emerging markets and new applications.
Leading Players in the Semiconductor Ceramics Market Sector
- CeramTec GmbH
- CoorsTek Inc.
- Corning Incorporated
- ICP TECHNOLOGY Co LTD
- KOA Speer Electronics INC
- KYOCERA Corporation
- LEATEC Fine Ceramics Co Ltd
- MARUWA Co Ltd
- NEOTech
- NIPPON CARBIDE INDUSTRIES CO INC
- Niterra Co Ltd
- Ortech Advanced Ceramics
- Toshiba Materials Co Ltd
- TTM Technologies Inc
- Yokowo co ltd
Key Milestones in Semiconductor Ceramics Market Industry
- June 2024: CeramTec launches Sinalit (Si3N4) ceramic substrate for power electronic modules, targeting e-mobility and renewable energy.
- May 2023: CeramTec unveils Rubalit ZTA ceramic substrate for power generation and electromobility applications.
Strategic Outlook for Semiconductor Ceramics Market
The Semiconductor Ceramics Market presents substantial growth opportunities driven by ongoing technological advancements, expanding applications in high-growth sectors, and strategic collaborations. Companies focused on innovation and efficient supply chain management are well-positioned to capitalize on the market's potential. The focus should be on developing sustainable and cost-effective solutions to meet the increasing demands of a rapidly evolving technological landscape.
Semiconductor Ceramics Market Segmentation
-
1. Type
- 1.1. Alumina
- 1.2. Aluminum Nitride
- 1.3. Silicon Nitride
- 1.4. Beryllium Oxide
- 1.5. Others
-
2. End-user Industry
- 2.1. Consumer Electronics
- 2.2. Aerospace & Defense
- 2.3. Automotive
- 2.4. Semiconductor
- 2.5. Telecommunication
- 2.6. Others
Semiconductor Ceramics Market Segmentation By Geography
-
1. Asia Pacific
- 1.1. China
- 1.2. India
- 1.3. Japan
- 1.4. South Korea
- 1.5. Malaysia
- 1.6. Thailand
- 1.7. Indonesia
- 1.8. Vietnam
- 1.9. Rest of Asia Pacific
-
2. North America
- 2.1. United States
- 2.2. Canada
- 2.3. Mexico
-
3. Europe
- 3.1. Germany
- 3.2. United Kingdom
- 3.3. France
- 3.4. Italy
- 3.5. Spain
- 3.6. Nordic Countries
- 3.7. Turkey
- 3.8. Russia
- 3.9. Rest of Europe
-
4. South America
- 4.1. Brazil
- 4.2. Argentina
- 4.3. Colombia
- 4.4. Rest of South America
-
5. Middle East and Africa
- 5.1. Saudi Arabia
- 5.2. Qatar
- 5.3. United Arab Emirates
- 5.4. Nigeria
- 5.5. Egypt
- 5.6. South Africa
- 5.7. Rest of Middle East and Africa
Semiconductor Ceramics Market Regional Market Share
Geographic Coverage of Semiconductor Ceramics Market
Semiconductor Ceramics Market REPORT HIGHLIGHTS
| Aspects | Details |
|---|---|
| Study Period | 2020-2034 |
| Base Year | 2025 |
| Estimated Year | 2026 |
| Forecast Period | 2026-2034 |
| Historical Period | 2020-2025 |
| Growth Rate | CAGR of 6.42% from 2020-2034 |
| Segmentation |
|
Table of Contents
- 1. Introduction
- 1.1. Research Scope
- 1.2. Market Segmentation
- 1.3. Research Objective
- 1.4. Definitions and Assumptions
- 2. Executive Summary
- 2.1. Market Snapshot
- 3. Market Dynamics
- 3.1. Market Drivers
- 3.2. Market Restrains
- 3.3. Market Trends
- 3.4. Market Opportunities
- 4. Market Factor Analysis
- 4.1. Porters Five Forces
- 4.1.1. Bargaining Power of Suppliers
- 4.1.2. Bargaining Power of Buyers
- 4.1.3. Threat of New Entrants
- 4.1.4. Threat of Substitutes
- 4.1.5. Competitive Rivalry
- 4.2. PESTEL analysis
- 4.3. BCG Analysis
- 4.3.1. Stars (High Growth, High Market Share)
- 4.3.2. Cash Cows (Low Growth, High Market Share)
- 4.3.3. Question Mark (High Growth, Low Market Share)
- 4.3.4. Dogs (Low Growth, Low Market Share)
- 4.4. Ansoff Matrix Analysis
- 4.5. Supply Chain Analysis
- 4.6. Regulatory Landscape
- 4.7. Current Market Potential and Opportunity Assessment (TAM–SAM–SOM Framework)
- 4.8. MDP Analyst Note
- 4.1. Porters Five Forces
- 5. Market Analysis, Insights and Forecast 2021-2033
- 5.1. Market Analysis, Insights and Forecast - by Type
- 5.1.1. Alumina
- 5.1.2. Aluminum Nitride
- 5.1.3. Silicon Nitride
- 5.1.4. Beryllium Oxide
- 5.1.5. Others
- 5.2. Market Analysis, Insights and Forecast - by End-user Industry
- 5.2.1. Consumer Electronics
- 5.2.2. Aerospace & Defense
- 5.2.3. Automotive
- 5.2.4. Semiconductor
- 5.2.5. Telecommunication
- 5.2.6. Others
- 5.3. Market Analysis, Insights and Forecast - by Region
- 5.3.1. Asia Pacific
- 5.3.2. North America
- 5.3.3. Europe
- 5.3.4. South America
- 5.3.5. Middle East and Africa
- 5.1. Market Analysis, Insights and Forecast - by Type
- 6. Global Semiconductor Ceramics Market Analysis, Insights and Forecast, 2021-2033
- 6.1. Market Analysis, Insights and Forecast - by Type
- 6.1.1. Alumina
- 6.1.2. Aluminum Nitride
- 6.1.3. Silicon Nitride
- 6.1.4. Beryllium Oxide
- 6.1.5. Others
- 6.2. Market Analysis, Insights and Forecast - by End-user Industry
- 6.2.1. Consumer Electronics
- 6.2.2. Aerospace & Defense
- 6.2.3. Automotive
- 6.2.4. Semiconductor
- 6.2.5. Telecommunication
- 6.2.6. Others
- 6.1. Market Analysis, Insights and Forecast - by Type
- 7. Asia Pacific Semiconductor Ceramics Market Analysis, Insights and Forecast, 2020-2032
- 7.1. Market Analysis, Insights and Forecast - by Type
- 7.1.1. Alumina
- 7.1.2. Aluminum Nitride
- 7.1.3. Silicon Nitride
- 7.1.4. Beryllium Oxide
- 7.1.5. Others
- 7.2. Market Analysis, Insights and Forecast - by End-user Industry
- 7.2.1. Consumer Electronics
- 7.2.2. Aerospace & Defense
- 7.2.3. Automotive
- 7.2.4. Semiconductor
- 7.2.5. Telecommunication
- 7.2.6. Others
- 7.1. Market Analysis, Insights and Forecast - by Type
- 8. North America Semiconductor Ceramics Market Analysis, Insights and Forecast, 2020-2032
- 8.1. Market Analysis, Insights and Forecast - by Type
- 8.1.1. Alumina
- 8.1.2. Aluminum Nitride
- 8.1.3. Silicon Nitride
- 8.1.4. Beryllium Oxide
- 8.1.5. Others
- 8.2. Market Analysis, Insights and Forecast - by End-user Industry
- 8.2.1. Consumer Electronics
- 8.2.2. Aerospace & Defense
- 8.2.3. Automotive
- 8.2.4. Semiconductor
- 8.2.5. Telecommunication
- 8.2.6. Others
- 8.1. Market Analysis, Insights and Forecast - by Type
- 9. Europe Semiconductor Ceramics Market Analysis, Insights and Forecast, 2020-2032
- 9.1. Market Analysis, Insights and Forecast - by Type
- 9.1.1. Alumina
- 9.1.2. Aluminum Nitride
- 9.1.3. Silicon Nitride
- 9.1.4. Beryllium Oxide
- 9.1.5. Others
- 9.2. Market Analysis, Insights and Forecast - by End-user Industry
- 9.2.1. Consumer Electronics
- 9.2.2. Aerospace & Defense
- 9.2.3. Automotive
- 9.2.4. Semiconductor
- 9.2.5. Telecommunication
- 9.2.6. Others
- 9.1. Market Analysis, Insights and Forecast - by Type
- 10. South America Semiconductor Ceramics Market Analysis, Insights and Forecast, 2020-2032
- 10.1. Market Analysis, Insights and Forecast - by Type
- 10.1.1. Alumina
- 10.1.2. Aluminum Nitride
- 10.1.3. Silicon Nitride
- 10.1.4. Beryllium Oxide
- 10.1.5. Others
- 10.2. Market Analysis, Insights and Forecast - by End-user Industry
- 10.2.1. Consumer Electronics
- 10.2.2. Aerospace & Defense
- 10.2.3. Automotive
- 10.2.4. Semiconductor
- 10.2.5. Telecommunication
- 10.2.6. Others
- 10.1. Market Analysis, Insights and Forecast - by Type
- 11. Middle East and Africa Semiconductor Ceramics Market Analysis, Insights and Forecast, 2020-2032
- 11.1. Market Analysis, Insights and Forecast - by Type
- 11.1.1. Alumina
- 11.1.2. Aluminum Nitride
- 11.1.3. Silicon Nitride
- 11.1.4. Beryllium Oxide
- 11.1.5. Others
- 11.2. Market Analysis, Insights and Forecast - by End-user Industry
- 11.2.1. Consumer Electronics
- 11.2.2. Aerospace & Defense
- 11.2.3. Automotive
- 11.2.4. Semiconductor
- 11.2.5. Telecommunication
- 11.2.6. Others
- 11.1. Market Analysis, Insights and Forecast - by Type
- 12. Competitive Analysis
- 12.1. Company Profiles
- 12.1.1 CeramTec GmbH
- 12.1.1.1. Company Overview
- 12.1.1.2. Products
- 12.1.1.3. Company Financials
- 12.1.1.4. SWOT Analysis
- 12.1.2 CoorsTek Inc
- 12.1.2.1. Company Overview
- 12.1.2.2. Products
- 12.1.2.3. Company Financials
- 12.1.2.4. SWOT Analysis
- 12.1.3 Corning Incorporated
- 12.1.3.1. Company Overview
- 12.1.3.2. Products
- 12.1.3.3. Company Financials
- 12.1.3.4. SWOT Analysis
- 12.1.4 ICP TECHNOLOGY Co LTD
- 12.1.4.1. Company Overview
- 12.1.4.2. Products
- 12.1.4.3. Company Financials
- 12.1.4.4. SWOT Analysis
- 12.1.5 KOA Speer Electronics INC
- 12.1.5.1. Company Overview
- 12.1.5.2. Products
- 12.1.5.3. Company Financials
- 12.1.5.4. SWOT Analysis
- 12.1.6 KYOCERA Corporation
- 12.1.6.1. Company Overview
- 12.1.6.2. Products
- 12.1.6.3. Company Financials
- 12.1.6.4. SWOT Analysis
- 12.1.7 LEATEC Fine Ceramics Co Ltd
- 12.1.7.1. Company Overview
- 12.1.7.2. Products
- 12.1.7.3. Company Financials
- 12.1.7.4. SWOT Analysis
- 12.1.8 MARUWA Co Ltd
- 12.1.8.1. Company Overview
- 12.1.8.2. Products
- 12.1.8.3. Company Financials
- 12.1.8.4. SWOT Analysis
- 12.1.9 NEOTech
- 12.1.9.1. Company Overview
- 12.1.9.2. Products
- 12.1.9.3. Company Financials
- 12.1.9.4. SWOT Analysis
- 12.1.10 NIPPON CARBIDE INDUSTRIES CO INC
- 12.1.10.1. Company Overview
- 12.1.10.2. Products
- 12.1.10.3. Company Financials
- 12.1.10.4. SWOT Analysis
- 12.1.11 Niterra Co Ltd
- 12.1.11.1. Company Overview
- 12.1.11.2. Products
- 12.1.11.3. Company Financials
- 12.1.11.4. SWOT Analysis
- 12.1.12 Ortech Advanced Ceramics
- 12.1.12.1. Company Overview
- 12.1.12.2. Products
- 12.1.12.3. Company Financials
- 12.1.12.4. SWOT Analysis
- 12.1.13 Toshiba Materials Co Ltd
- 12.1.13.1. Company Overview
- 12.1.13.2. Products
- 12.1.13.3. Company Financials
- 12.1.13.4. SWOT Analysis
- 12.1.14 TTM Technologies Inc
- 12.1.14.1. Company Overview
- 12.1.14.2. Products
- 12.1.14.3. Company Financials
- 12.1.14.4. SWOT Analysis
- 12.1.15 Yokowo co ltd *List Not Exhaustive
- 12.1.15.1. Company Overview
- 12.1.15.2. Products
- 12.1.15.3. Company Financials
- 12.1.15.4. SWOT Analysis
- 12.1.1 CeramTec GmbH
- 12.2. Market Entropy
- 12.2.1 Company's Key Areas Served
- 12.2.2 Recent Developments
- 12.3. Company Market Share Analysis 2025
- 12.3.1 Top 5 Companies Market Share Analysis
- 12.3.2 Top 3 Companies Market Share Analysis
- 12.4. List of Potential Customers
- 13. Research Methodology
List of Figures
- Figure 1: Global Semiconductor Ceramics Market Revenue Breakdown (Million, %) by Region 2025 & 2033
- Figure 2: Global Semiconductor Ceramics Market Volume Breakdown (Billion, %) by Region 2025 & 2033
- Figure 3: Asia Pacific Semiconductor Ceramics Market Revenue (Million), by Type 2025 & 2033
- Figure 4: Asia Pacific Semiconductor Ceramics Market Volume (Billion), by Type 2025 & 2033
- Figure 5: Asia Pacific Semiconductor Ceramics Market Revenue Share (%), by Type 2025 & 2033
- Figure 6: Asia Pacific Semiconductor Ceramics Market Volume Share (%), by Type 2025 & 2033
- Figure 7: Asia Pacific Semiconductor Ceramics Market Revenue (Million), by End-user Industry 2025 & 2033
- Figure 8: Asia Pacific Semiconductor Ceramics Market Volume (Billion), by End-user Industry 2025 & 2033
- Figure 9: Asia Pacific Semiconductor Ceramics Market Revenue Share (%), by End-user Industry 2025 & 2033
- Figure 10: Asia Pacific Semiconductor Ceramics Market Volume Share (%), by End-user Industry 2025 & 2033
- Figure 11: Asia Pacific Semiconductor Ceramics Market Revenue (Million), by Country 2025 & 2033
- Figure 12: Asia Pacific Semiconductor Ceramics Market Volume (Billion), by Country 2025 & 2033
- Figure 13: Asia Pacific Semiconductor Ceramics Market Revenue Share (%), by Country 2025 & 2033
- Figure 14: Asia Pacific Semiconductor Ceramics Market Volume Share (%), by Country 2025 & 2033
- Figure 15: North America Semiconductor Ceramics Market Revenue (Million), by Type 2025 & 2033
- Figure 16: North America Semiconductor Ceramics Market Volume (Billion), by Type 2025 & 2033
- Figure 17: North America Semiconductor Ceramics Market Revenue Share (%), by Type 2025 & 2033
- Figure 18: North America Semiconductor Ceramics Market Volume Share (%), by Type 2025 & 2033
- Figure 19: North America Semiconductor Ceramics Market Revenue (Million), by End-user Industry 2025 & 2033
- Figure 20: North America Semiconductor Ceramics Market Volume (Billion), by End-user Industry 2025 & 2033
- Figure 21: North America Semiconductor Ceramics Market Revenue Share (%), by End-user Industry 2025 & 2033
- Figure 22: North America Semiconductor Ceramics Market Volume Share (%), by End-user Industry 2025 & 2033
- Figure 23: North America Semiconductor Ceramics Market Revenue (Million), by Country 2025 & 2033
- Figure 24: North America Semiconductor Ceramics Market Volume (Billion), by Country 2025 & 2033
- Figure 25: North America Semiconductor Ceramics Market Revenue Share (%), by Country 2025 & 2033
- Figure 26: North America Semiconductor Ceramics Market Volume Share (%), by Country 2025 & 2033
- Figure 27: Europe Semiconductor Ceramics Market Revenue (Million), by Type 2025 & 2033
- Figure 28: Europe Semiconductor Ceramics Market Volume (Billion), by Type 2025 & 2033
- Figure 29: Europe Semiconductor Ceramics Market Revenue Share (%), by Type 2025 & 2033
- Figure 30: Europe Semiconductor Ceramics Market Volume Share (%), by Type 2025 & 2033
- Figure 31: Europe Semiconductor Ceramics Market Revenue (Million), by End-user Industry 2025 & 2033
- Figure 32: Europe Semiconductor Ceramics Market Volume (Billion), by End-user Industry 2025 & 2033
- Figure 33: Europe Semiconductor Ceramics Market Revenue Share (%), by End-user Industry 2025 & 2033
- Figure 34: Europe Semiconductor Ceramics Market Volume Share (%), by End-user Industry 2025 & 2033
- Figure 35: Europe Semiconductor Ceramics Market Revenue (Million), by Country 2025 & 2033
- Figure 36: Europe Semiconductor Ceramics Market Volume (Billion), by Country 2025 & 2033
- Figure 37: Europe Semiconductor Ceramics Market Revenue Share (%), by Country 2025 & 2033
- Figure 38: Europe Semiconductor Ceramics Market Volume Share (%), by Country 2025 & 2033
- Figure 39: South America Semiconductor Ceramics Market Revenue (Million), by Type 2025 & 2033
- Figure 40: South America Semiconductor Ceramics Market Volume (Billion), by Type 2025 & 2033
- Figure 41: South America Semiconductor Ceramics Market Revenue Share (%), by Type 2025 & 2033
- Figure 42: South America Semiconductor Ceramics Market Volume Share (%), by Type 2025 & 2033
- Figure 43: South America Semiconductor Ceramics Market Revenue (Million), by End-user Industry 2025 & 2033
- Figure 44: South America Semiconductor Ceramics Market Volume (Billion), by End-user Industry 2025 & 2033
- Figure 45: South America Semiconductor Ceramics Market Revenue Share (%), by End-user Industry 2025 & 2033
- Figure 46: South America Semiconductor Ceramics Market Volume Share (%), by End-user Industry 2025 & 2033
- Figure 47: South America Semiconductor Ceramics Market Revenue (Million), by Country 2025 & 2033
- Figure 48: South America Semiconductor Ceramics Market Volume (Billion), by Country 2025 & 2033
- Figure 49: South America Semiconductor Ceramics Market Revenue Share (%), by Country 2025 & 2033
- Figure 50: South America Semiconductor Ceramics Market Volume Share (%), by Country 2025 & 2033
- Figure 51: Middle East and Africa Semiconductor Ceramics Market Revenue (Million), by Type 2025 & 2033
- Figure 52: Middle East and Africa Semiconductor Ceramics Market Volume (Billion), by Type 2025 & 2033
- Figure 53: Middle East and Africa Semiconductor Ceramics Market Revenue Share (%), by Type 2025 & 2033
- Figure 54: Middle East and Africa Semiconductor Ceramics Market Volume Share (%), by Type 2025 & 2033
- Figure 55: Middle East and Africa Semiconductor Ceramics Market Revenue (Million), by End-user Industry 2025 & 2033
- Figure 56: Middle East and Africa Semiconductor Ceramics Market Volume (Billion), by End-user Industry 2025 & 2033
- Figure 57: Middle East and Africa Semiconductor Ceramics Market Revenue Share (%), by End-user Industry 2025 & 2033
- Figure 58: Middle East and Africa Semiconductor Ceramics Market Volume Share (%), by End-user Industry 2025 & 2033
- Figure 59: Middle East and Africa Semiconductor Ceramics Market Revenue (Million), by Country 2025 & 2033
- Figure 60: Middle East and Africa Semiconductor Ceramics Market Volume (Billion), by Country 2025 & 2033
- Figure 61: Middle East and Africa Semiconductor Ceramics Market Revenue Share (%), by Country 2025 & 2033
- Figure 62: Middle East and Africa Semiconductor Ceramics Market Volume Share (%), by Country 2025 & 2033
List of Tables
- Table 1: Global Semiconductor Ceramics Market Revenue Million Forecast, by Type 2020 & 2033
- Table 2: Global Semiconductor Ceramics Market Volume Billion Forecast, by Type 2020 & 2033
- Table 3: Global Semiconductor Ceramics Market Revenue Million Forecast, by End-user Industry 2020 & 2033
- Table 4: Global Semiconductor Ceramics Market Volume Billion Forecast, by End-user Industry 2020 & 2033
- Table 5: Global Semiconductor Ceramics Market Revenue Million Forecast, by Region 2020 & 2033
- Table 6: Global Semiconductor Ceramics Market Volume Billion Forecast, by Region 2020 & 2033
- Table 7: Global Semiconductor Ceramics Market Revenue Million Forecast, by Type 2020 & 2033
- Table 8: Global Semiconductor Ceramics Market Volume Billion Forecast, by Type 2020 & 2033
- Table 9: Global Semiconductor Ceramics Market Revenue Million Forecast, by End-user Industry 2020 & 2033
- Table 10: Global Semiconductor Ceramics Market Volume Billion Forecast, by End-user Industry 2020 & 2033
- Table 11: Global Semiconductor Ceramics Market Revenue Million Forecast, by Country 2020 & 2033
- Table 12: Global Semiconductor Ceramics Market Volume Billion Forecast, by Country 2020 & 2033
- Table 13: China Semiconductor Ceramics Market Revenue (Million) Forecast, by Application 2020 & 2033
- Table 14: China Semiconductor Ceramics Market Volume (Billion) Forecast, by Application 2020 & 2033
- Table 15: India Semiconductor Ceramics Market Revenue (Million) Forecast, by Application 2020 & 2033
- Table 16: India Semiconductor Ceramics Market Volume (Billion) Forecast, by Application 2020 & 2033
- Table 17: Japan Semiconductor Ceramics Market Revenue (Million) Forecast, by Application 2020 & 2033
- Table 18: Japan Semiconductor Ceramics Market Volume (Billion) Forecast, by Application 2020 & 2033
- Table 19: South Korea Semiconductor Ceramics Market Revenue (Million) Forecast, by Application 2020 & 2033
- Table 20: South Korea Semiconductor Ceramics Market Volume (Billion) Forecast, by Application 2020 & 2033
- Table 21: Malaysia Semiconductor Ceramics Market Revenue (Million) Forecast, by Application 2020 & 2033
- Table 22: Malaysia Semiconductor Ceramics Market Volume (Billion) Forecast, by Application 2020 & 2033
- Table 23: Thailand Semiconductor Ceramics Market Revenue (Million) Forecast, by Application 2020 & 2033
- Table 24: Thailand Semiconductor Ceramics Market Volume (Billion) Forecast, by Application 2020 & 2033
- Table 25: Indonesia Semiconductor Ceramics Market Revenue (Million) Forecast, by Application 2020 & 2033
- Table 26: Indonesia Semiconductor Ceramics Market Volume (Billion) Forecast, by Application 2020 & 2033
- Table 27: Vietnam Semiconductor Ceramics Market Revenue (Million) Forecast, by Application 2020 & 2033
- Table 28: Vietnam Semiconductor Ceramics Market Volume (Billion) Forecast, by Application 2020 & 2033
- Table 29: Rest of Asia Pacific Semiconductor Ceramics Market Revenue (Million) Forecast, by Application 2020 & 2033
- Table 30: Rest of Asia Pacific Semiconductor Ceramics Market Volume (Billion) Forecast, by Application 2020 & 2033
- Table 31: Global Semiconductor Ceramics Market Revenue Million Forecast, by Type 2020 & 2033
- Table 32: Global Semiconductor Ceramics Market Volume Billion Forecast, by Type 2020 & 2033
- Table 33: Global Semiconductor Ceramics Market Revenue Million Forecast, by End-user Industry 2020 & 2033
- Table 34: Global Semiconductor Ceramics Market Volume Billion Forecast, by End-user Industry 2020 & 2033
- Table 35: Global Semiconductor Ceramics Market Revenue Million Forecast, by Country 2020 & 2033
- Table 36: Global Semiconductor Ceramics Market Volume Billion Forecast, by Country 2020 & 2033
- Table 37: United States Semiconductor Ceramics Market Revenue (Million) Forecast, by Application 2020 & 2033
- Table 38: United States Semiconductor Ceramics Market Volume (Billion) Forecast, by Application 2020 & 2033
- Table 39: Canada Semiconductor Ceramics Market Revenue (Million) Forecast, by Application 2020 & 2033
- Table 40: Canada Semiconductor Ceramics Market Volume (Billion) Forecast, by Application 2020 & 2033
- Table 41: Mexico Semiconductor Ceramics Market Revenue (Million) Forecast, by Application 2020 & 2033
- Table 42: Mexico Semiconductor Ceramics Market Volume (Billion) Forecast, by Application 2020 & 2033
- Table 43: Global Semiconductor Ceramics Market Revenue Million Forecast, by Type 2020 & 2033
- Table 44: Global Semiconductor Ceramics Market Volume Billion Forecast, by Type 2020 & 2033
- Table 45: Global Semiconductor Ceramics Market Revenue Million Forecast, by End-user Industry 2020 & 2033
- Table 46: Global Semiconductor Ceramics Market Volume Billion Forecast, by End-user Industry 2020 & 2033
- Table 47: Global Semiconductor Ceramics Market Revenue Million Forecast, by Country 2020 & 2033
- Table 48: Global Semiconductor Ceramics Market Volume Billion Forecast, by Country 2020 & 2033
- Table 49: Germany Semiconductor Ceramics Market Revenue (Million) Forecast, by Application 2020 & 2033
- Table 50: Germany Semiconductor Ceramics Market Volume (Billion) Forecast, by Application 2020 & 2033
- Table 51: United Kingdom Semiconductor Ceramics Market Revenue (Million) Forecast, by Application 2020 & 2033
- Table 52: United Kingdom Semiconductor Ceramics Market Volume (Billion) Forecast, by Application 2020 & 2033
- Table 53: France Semiconductor Ceramics Market Revenue (Million) Forecast, by Application 2020 & 2033
- Table 54: France Semiconductor Ceramics Market Volume (Billion) Forecast, by Application 2020 & 2033
- Table 55: Italy Semiconductor Ceramics Market Revenue (Million) Forecast, by Application 2020 & 2033
- Table 56: Italy Semiconductor Ceramics Market Volume (Billion) Forecast, by Application 2020 & 2033
- Table 57: Spain Semiconductor Ceramics Market Revenue (Million) Forecast, by Application 2020 & 2033
- Table 58: Spain Semiconductor Ceramics Market Volume (Billion) Forecast, by Application 2020 & 2033
- Table 59: Nordic Countries Semiconductor Ceramics Market Revenue (Million) Forecast, by Application 2020 & 2033
- Table 60: Nordic Countries Semiconductor Ceramics Market Volume (Billion) Forecast, by Application 2020 & 2033
- Table 61: Turkey Semiconductor Ceramics Market Revenue (Million) Forecast, by Application 2020 & 2033
- Table 62: Turkey Semiconductor Ceramics Market Volume (Billion) Forecast, by Application 2020 & 2033
- Table 63: Russia Semiconductor Ceramics Market Revenue (Million) Forecast, by Application 2020 & 2033
- Table 64: Russia Semiconductor Ceramics Market Volume (Billion) Forecast, by Application 2020 & 2033
- Table 65: Rest of Europe Semiconductor Ceramics Market Revenue (Million) Forecast, by Application 2020 & 2033
- Table 66: Rest of Europe Semiconductor Ceramics Market Volume (Billion) Forecast, by Application 2020 & 2033
- Table 67: Global Semiconductor Ceramics Market Revenue Million Forecast, by Type 2020 & 2033
- Table 68: Global Semiconductor Ceramics Market Volume Billion Forecast, by Type 2020 & 2033
- Table 69: Global Semiconductor Ceramics Market Revenue Million Forecast, by End-user Industry 2020 & 2033
- Table 70: Global Semiconductor Ceramics Market Volume Billion Forecast, by End-user Industry 2020 & 2033
- Table 71: Global Semiconductor Ceramics Market Revenue Million Forecast, by Country 2020 & 2033
- Table 72: Global Semiconductor Ceramics Market Volume Billion Forecast, by Country 2020 & 2033
- Table 73: Brazil Semiconductor Ceramics Market Revenue (Million) Forecast, by Application 2020 & 2033
- Table 74: Brazil Semiconductor Ceramics Market Volume (Billion) Forecast, by Application 2020 & 2033
- Table 75: Argentina Semiconductor Ceramics Market Revenue (Million) Forecast, by Application 2020 & 2033
- Table 76: Argentina Semiconductor Ceramics Market Volume (Billion) Forecast, by Application 2020 & 2033
- Table 77: Colombia Semiconductor Ceramics Market Revenue (Million) Forecast, by Application 2020 & 2033
- Table 78: Colombia Semiconductor Ceramics Market Volume (Billion) Forecast, by Application 2020 & 2033
- Table 79: Rest of South America Semiconductor Ceramics Market Revenue (Million) Forecast, by Application 2020 & 2033
- Table 80: Rest of South America Semiconductor Ceramics Market Volume (Billion) Forecast, by Application 2020 & 2033
- Table 81: Global Semiconductor Ceramics Market Revenue Million Forecast, by Type 2020 & 2033
- Table 82: Global Semiconductor Ceramics Market Volume Billion Forecast, by Type 2020 & 2033
- Table 83: Global Semiconductor Ceramics Market Revenue Million Forecast, by End-user Industry 2020 & 2033
- Table 84: Global Semiconductor Ceramics Market Volume Billion Forecast, by End-user Industry 2020 & 2033
- Table 85: Global Semiconductor Ceramics Market Revenue Million Forecast, by Country 2020 & 2033
- Table 86: Global Semiconductor Ceramics Market Volume Billion Forecast, by Country 2020 & 2033
- Table 87: Saudi Arabia Semiconductor Ceramics Market Revenue (Million) Forecast, by Application 2020 & 2033
- Table 88: Saudi Arabia Semiconductor Ceramics Market Volume (Billion) Forecast, by Application 2020 & 2033
- Table 89: Qatar Semiconductor Ceramics Market Revenue (Million) Forecast, by Application 2020 & 2033
- Table 90: Qatar Semiconductor Ceramics Market Volume (Billion) Forecast, by Application 2020 & 2033
- Table 91: United Arab Emirates Semiconductor Ceramics Market Revenue (Million) Forecast, by Application 2020 & 2033
- Table 92: United Arab Emirates Semiconductor Ceramics Market Volume (Billion) Forecast, by Application 2020 & 2033
- Table 93: Nigeria Semiconductor Ceramics Market Revenue (Million) Forecast, by Application 2020 & 2033
- Table 94: Nigeria Semiconductor Ceramics Market Volume (Billion) Forecast, by Application 2020 & 2033
- Table 95: Egypt Semiconductor Ceramics Market Revenue (Million) Forecast, by Application 2020 & 2033
- Table 96: Egypt Semiconductor Ceramics Market Volume (Billion) Forecast, by Application 2020 & 2033
- Table 97: South Africa Semiconductor Ceramics Market Revenue (Million) Forecast, by Application 2020 & 2033
- Table 98: South Africa Semiconductor Ceramics Market Volume (Billion) Forecast, by Application 2020 & 2033
- Table 99: Rest of Middle East and Africa Semiconductor Ceramics Market Revenue (Million) Forecast, by Application 2020 & 2033
- Table 100: Rest of Middle East and Africa Semiconductor Ceramics Market Volume (Billion) Forecast, by Application 2020 & 2033
Frequently Asked Questions
1. What is the projected Compound Annual Growth Rate (CAGR) of the Semiconductor Ceramics Market?
The projected CAGR is approximately 6.42%.
2. Which companies are prominent players in the Semiconductor Ceramics Market?
Key companies in the market include CeramTec GmbH, CoorsTek Inc, Corning Incorporated, ICP TECHNOLOGY Co LTD, KOA Speer Electronics INC, KYOCERA Corporation, LEATEC Fine Ceramics Co Ltd, MARUWA Co Ltd, NEOTech, NIPPON CARBIDE INDUSTRIES CO INC, Niterra Co Ltd, Ortech Advanced Ceramics, Toshiba Materials Co Ltd, TTM Technologies Inc, Yokowo co ltd *List Not Exhaustive.
3. What are the main segments of the Semiconductor Ceramics Market?
The market segments include Type, End-user Industry.
4. Can you provide details about the market size?
The market size is estimated to be USD 8.05 Million as of 2022.
5. What are some drivers contributing to market growth?
Increasing Demand for Ceramic Substrates Over Metal; Rise in the Adoption of Ceramic Substrates in Electronics Application; Other Drivers.
6. What are the notable trends driving market growth?
Rise in the Adoption of Ceramic Substrates in Electronics Application.
7. Are there any restraints impacting market growth?
Increasing Demand for Ceramic Substrates Over Metal; Rise in the Adoption of Ceramic Substrates in Electronics Application; Other Drivers.
8. Can you provide examples of recent developments in the market?
June 2024: CeramTec has unveiled Sinalit, a new ceramic substrate crafted from silicon nitride (Si3N4). Designed to bolster power electronic modules, Sinalit boasts impressive flexural strength, commendable thermal conductivity, and top-notch electrical insulation. These attributes position it perfectly for high-demand sectors like e-mobility and renewable energy. With the launch of Sinalit Si3N4, CeramTec is strategically responding to the surging demand for efficient and dependable power electronic modules across diverse industries.May 2023: CeramTec has unveiled Rubalit ZTA, a high-performance ceramic substrate boasting exceptional thermal conductivity, impressive flexural strength, and excellent electrical insulation properties. Zirconia Toughened Alumina (ZTA) finds applications in power generation and electromobility. With the launch of Rubalit ZTA, CeramTec seeks to meet these market demands and offer a competitive edge to its clientele.
9. What pricing options are available for accessing the report?
Pricing options include single-user, multi-user, and enterprise licenses priced at USD 4750, USD 5250, and USD 8750 respectively.
10. Is the market size provided in terms of value or volume?
The market size is provided in terms of value, measured in Million and volume, measured in Billion.
11. Are there any specific market keywords associated with the report?
Yes, the market keyword associated with the report is "Semiconductor Ceramics Market," which aids in identifying and referencing the specific market segment covered.
12. How do I determine which pricing option suits my needs best?
The pricing options vary based on user requirements and access needs. Individual users may opt for single-user licenses, while businesses requiring broader access may choose multi-user or enterprise licenses for cost-effective access to the report.
13. Are there any additional resources or data provided in the Semiconductor Ceramics Market report?
While the report offers comprehensive insights, it's advisable to review the specific contents or supplementary materials provided to ascertain if additional resources or data are available.
14. How can I stay updated on further developments or reports in the Semiconductor Ceramics Market?
To stay informed about further developments, trends, and reports in the Semiconductor Ceramics Market, consider subscribing to industry newsletters, following relevant companies and organizations, or regularly checking reputable industry news sources and publications.
Methodology
Step 1 - Identification of Relevant Samples Size from Population Database


Step 2 - Approaches for Defining Global Market Size (Value, Volume* & Price*)

Note*: In applicable scenarios
Step 3 - Data Sources
Primary Research
- Web Analytics
- Survey Reports
- Research Institute
- Latest Research Reports
- Opinion Leaders
Secondary Research
- Annual Reports
- White Paper
- Latest Press Release
- Industry Association
- Paid Database
- Investor Presentations

Step 4 - Data Triangulation
Involves using different sources of information in order to increase the validity of a study
These sources are likely to be stakeholders in a program - participants, other researchers, program staff, other community members, and so on.
Then we put all data in single framework & apply various statistical tools to find out the dynamic on the market.
During the analysis stage, feedback from the stakeholder groups would be compared to determine areas of agreement as well as areas of divergence