

Key Insights
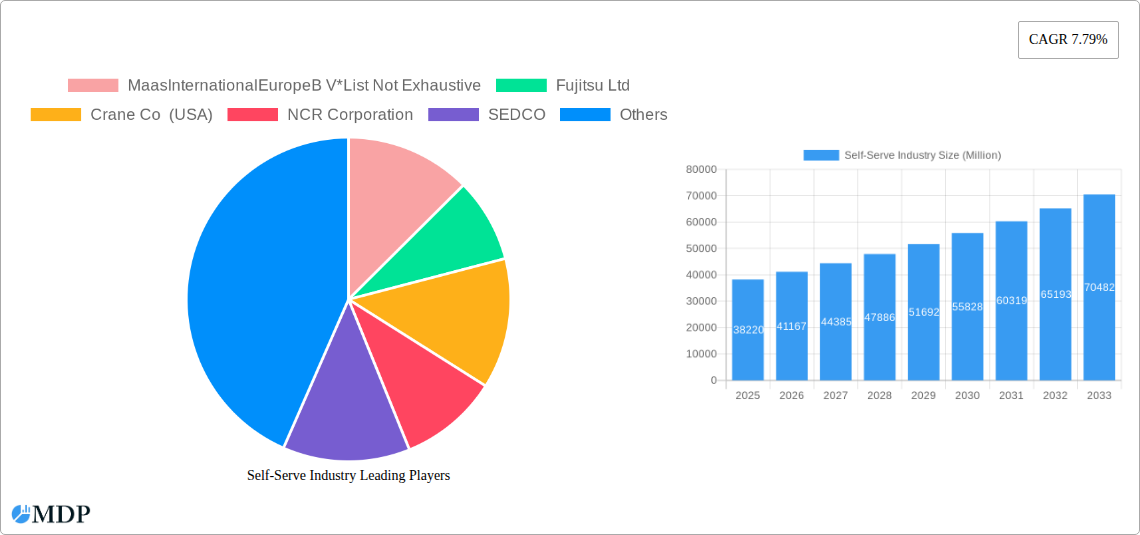
The self-service industry, encompassing kiosks, ATMs, vending machines, and other automated solutions, is experiencing robust growth, projected to reach a market size of $38.22 billion in 2025 and maintain a Compound Annual Growth Rate (CAGR) of 7.79% from 2025 to 2033. This expansion is driven by several key factors. Firstly, the increasing adoption of digital technologies and the rising demand for convenience and speed are fueling the widespread deployment of self-service solutions across various sectors. Consumers increasingly prefer the efficiency and 24/7 availability offered by self-service options, especially in retail, banking, and hospitality. Secondly, the ongoing labor shortages across numerous industries are pushing businesses to automate tasks, increasing reliance on self-service technologies to reduce operational costs and improve overall efficiency. Finally, technological advancements leading to more sophisticated and user-friendly interfaces contribute significantly to the market's expansion. The BFSI (Banking, Financial Services, and Insurance) sector is a major driver, with ATMs and banking kiosks remaining central to service delivery, while the retail and fast-food sectors are rapidly adopting self-checkout kiosks and automated ordering systems.
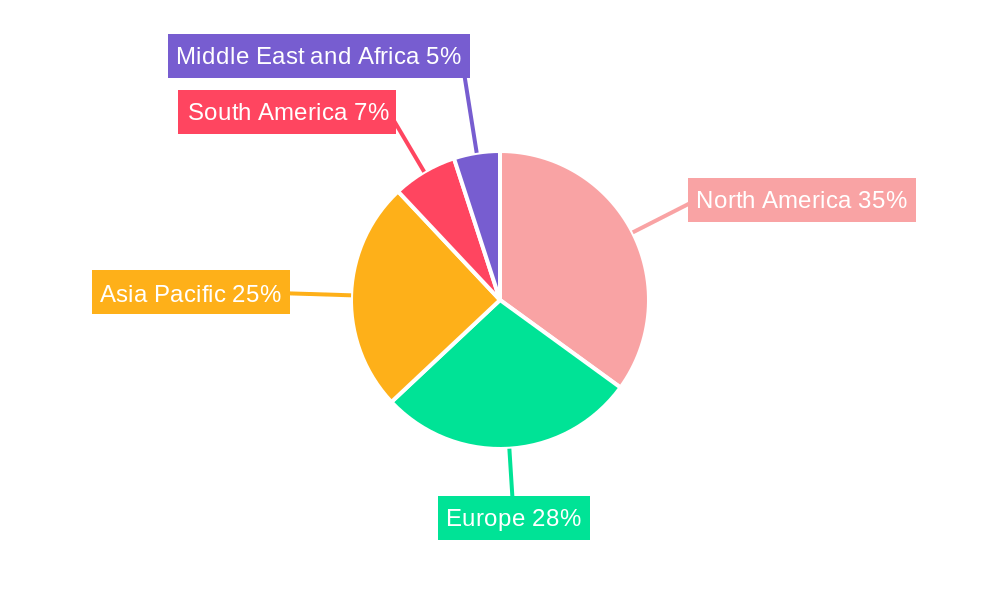
Further segment analysis reveals strong growth potential within specific end-user verticals. The retail and fast-food segment is expected to witness particularly high growth due to the increasing adoption of self-checkout kiosks and automated ordering systems. The healthcare sector is also showing promise, with self-service kiosks used for check-in, appointment scheduling, and dispensing medication. Similarly, the travel and transportation sector benefits from self-service check-in kiosks and ticketing machines at airports and transportation hubs. While North America and Europe currently hold significant market shares, the Asia-Pacific region is projected to experience the fastest growth, driven by rapid urbanization and increasing disposable incomes. Competition within the industry is fierce, with established players like NCR Corporation, Diebold Nixdorf, and Fujitsu Ltd. facing challenges from emerging technology providers focused on innovative solutions and improved user experience. The continuous innovation in areas such as artificial intelligence (AI) and improved user interfaces is expected to further fuel market expansion in the coming years.
This comprehensive report provides an in-depth analysis of the self-serve industry, encompassing market dynamics, leading players, technological advancements, and future growth prospects. Valued at $XX Million in 2025, this rapidly evolving sector presents significant opportunities for stakeholders across various segments. The report covers the period 2019-2033, with a focus on the forecast period 2025-2033 and a detailed examination of 2025. This report is essential for investors, industry professionals, and businesses looking to understand and capitalize on the potential of the self-serve market.
Self-Serve Industry Market Dynamics & Concentration
The self-serve industry, encompassing kiosks, ATMs, and vending machines, exhibits a dynamic landscape shaped by several key factors. Market concentration is moderate, with several major players holding significant shares, but a considerable number of smaller, specialized companies also contributing significantly. The global market size in 2025 is estimated at $XX Million.
- Market Share: While precise market share data for individual companies is proprietary, companies like NCR Corporation, Diebold Nixdorf, and Fujitsu Ltd hold substantial market shares. Smaller niche players like Advanced Kiosks and Frank Mayer & Associates Inc focus on specific segments.
- Innovation Drivers: Technological advancements, particularly in software, AI, and mobile integration, are crucial drivers. The increasing demand for contactless and personalized experiences fuels innovation in user interfaces and payment systems.
- Regulatory Frameworks: Varying regulatory environments across regions influence the adoption and deployment of self-serve solutions. Compliance with data privacy regulations and security standards significantly impact market dynamics.
- Product Substitutes: The emergence of alternative solutions, such as online ordering and delivery services, presents competitive pressures. However, the convenience and accessibility of self-serve solutions continue to drive demand in many sectors.
- End-User Trends: The growing preference for convenience and 24/7 accessibility significantly boosts self-serve technology adoption across BFSI, retail, hospitality, and healthcare.
- M&A Activities: The industry has witnessed several mergers and acquisitions in recent years. The exact number for the study period (2019-2024) is xx, reflecting strategic moves by companies to expand their market reach and product portfolios.
Self-Serve Industry Industry Trends & Analysis
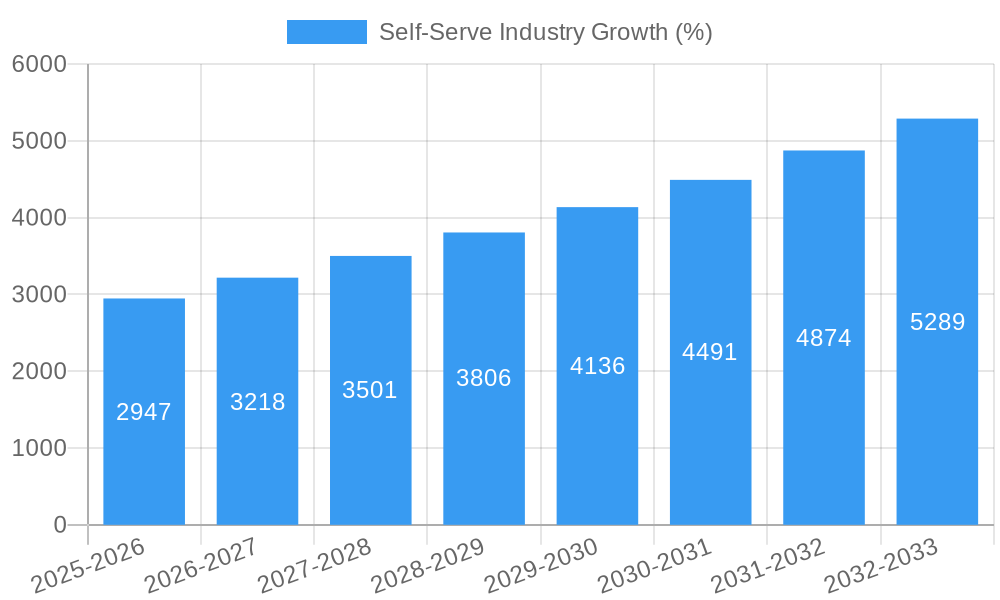
The self-serve industry is experiencing significant growth, driven by several converging trends. The Compound Annual Growth Rate (CAGR) for the forecast period (2025-2033) is projected to be xx%. This robust growth is fueled by various factors.
Technological disruptions, such as the integration of AI, IoT, and advanced payment systems, are transforming user experiences and expanding the capabilities of self-serve solutions. Consumer preferences are shifting toward contactless interactions and personalized services, aligning perfectly with the capabilities of modern self-serve technologies. Furthermore, increasing labor costs and the need for operational efficiency drive widespread adoption in diverse industries. Market penetration is currently at xx% and is expected to reach xx% by 2033. Competitive dynamics are marked by both intense competition among established players and the emergence of innovative startups.
Leading Markets & Segments in Self-Serve Industry
The North American market currently dominates the global self-serve industry, followed by Europe and Asia-Pacific. The BFSI (Banking, Financial Services, and Insurance) segment holds the largest market share among end-users.
Key Drivers for North American Dominance:
- Strong technological infrastructure
- High consumer adoption of self-serve technologies
- Favorable regulatory environment
- Significant investments in technology and innovation.
Key Drivers for BFSI Segment Dominance:
- Automation of banking operations
- Need for cost reduction
- 24/7 service availability.
The retail and fast-food chain segments are also experiencing substantial growth, driven by the demand for efficient checkout processes and enhanced customer experiences. Growth in the healthcare and hospitality segments is also notable, as self-service solutions streamline processes and improve operational efficiency.
Self-Serve Industry Product Developments
Recent product innovations include the integration of advanced payment technologies, such as mobile wallets and biometric authentication. Self-service kiosks are increasingly incorporating touchscreens, intuitive interfaces, and personalized recommendations. The market is witnessing a move towards modular and customizable solutions, enabling businesses to tailor self-service systems to their specific needs. The adoption of cloud-based platforms is enabling remote management and data analytics, which further enhance operational efficiency.
Key Drivers of Self-Serve Industry Growth
Several factors contribute to the sustained growth of the self-serve industry.
- Technological Advancements: The integration of AI, IoT, and advanced payment systems enhances user experience and expands application possibilities. NCR Corporation's launch of the NCR Voyix platform is a prime example.
- Economic Factors: Increasing labor costs and the need for operational efficiency drive businesses toward self-serve solutions to reduce costs and improve productivity.
- Regulatory Factors: Governments worldwide are promoting the adoption of digital technologies, further accelerating the growth of the self-serve industry.
Challenges in the Self-Serve Industry Market
The self-serve industry faces several challenges.
- Regulatory Hurdles: Compliance with data privacy regulations and security standards adds complexity and cost to implementation.
- Supply Chain Issues: Global supply chain disruptions can impact the availability of components, leading to delays and increased costs.
- Competitive Pressures: Intense competition among established players and emerging startups necessitates continuous innovation and differentiation. This competition impacts profit margins.
Emerging Opportunities in Self-Serve Industry
The self-serve industry is poised for significant growth.
Technological breakthroughs, such as advancements in AI and machine learning, will enhance the capabilities and functionalities of self-serve systems. Strategic partnerships between technology providers and end-users will further drive market expansion. Expansion into new markets and emerging economies presents significant growth potential.
Leading Players in the Self-Serve Industry Sector
- MaasInternationalEurope BV List Not Exhaustive
- Fujitsu Ltd
- Crane Co (USA)
- NCR Corporation
- SEDCO
- Frank Mayer & Associates Inc
- Advanced Kiosks
- Azkoyen Group
- Advantech Co Limited
- ProtouchUK
- Zebra Technologies
- HESS Cash systems GmbH & Co
- Diebold Nixdorf
- Embross
- IER Group
Key Milestones in Self-Serve Industry Industry
- January 2024: NCR Corporation launched its Next Generation Self-Checkout Solution, NCR Voyix, enhancing the retail checkout experience.
- June 2023: Gem OpenCube Technologies Pvt Ltd designed the world's first automated Water, Tea, and Coffee vending machine, revolutionizing the beverage vending sector.
Strategic Outlook for Self-Serve Industry Market
The self-serve industry is poised for continued expansion, driven by technological innovation, increasing demand for convenience, and the need for operational efficiency across various sectors. Strategic investments in R&D, strategic partnerships, and expansion into new markets will be crucial for capturing the significant growth opportunities that lie ahead. The global market is expected to reach $XX Million by 2033, representing substantial growth potential for both established players and emerging businesses.
Self-Serve Industry Segmentation
-
1. Type
- 1.1. Kiosk
- 1.2. ATM
- 1.3. Vending Machine
-
2. End-user
- 2.1. BFSI
- 2.2. Retail & Fast Food Chain
- 2.3. Hospitality
- 2.4. Healthcare
- 2.5. Travel & Transportation
- 2.6. Other End-users
Self-Serve Industry Segmentation By Geography
- 1. North America
- 2. Europe
- 3. Asia Pacific
- 4. South America
- 5. Middle East and Africa
Self-Serve Industry REPORT HIGHLIGHTS
| Aspects | Details |
|---|---|
| Study Period | 2019-2033 |
| Base Year | 2024 |
| Estimated Year | 2025 |
| Forecast Period | 2025-2033 |
| Historical Period | 2019-2024 |
| Growth Rate | CAGR of 7.79% from 2019-2033 |
| Segmentation |
|
Table of Contents
- 1. Introduction
- 1.1. Research Scope
- 1.2. Market Segmentation
- 1.3. Research Methodology
- 1.4. Definitions and Assumptions
- 2. Executive Summary
- 2.1. Introduction
- 3. Market Dynamics
- 3.1. Introduction
- 3.2. Market Drivers
- 3.2.1. Growing emphasis on ensuring customer satisfaction to drive demand in the Retail & Food sector; High investments in the infrastructure developments (new & refurbishments) and smart city initiatives; Technological investments to enable greater support for the differently abled populace & new users
- 3.3. Market Restrains
- 3.3.1. Cost and maintenance remains a key consideration
- 3.4. Market Trends
- 3.4.1. Automated Teller Machine (ATM) to Witness the Growth
- 4. Market Factor Analysis
- 4.1. Porters Five Forces
- 4.2. Supply/Value Chain
- 4.3. PESTEL analysis
- 4.4. Market Entropy
- 4.5. Patent/Trademark Analysis
- 5. Global Self-Serve Industry Analysis, Insights and Forecast, 2019-2031
- 5.1. Market Analysis, Insights and Forecast - by Type
- 5.1.1. Kiosk
- 5.1.2. ATM
- 5.1.3. Vending Machine
- 5.2. Market Analysis, Insights and Forecast - by End-user
- 5.2.1. BFSI
- 5.2.2. Retail & Fast Food Chain
- 5.2.3. Hospitality
- 5.2.4. Healthcare
- 5.2.5. Travel & Transportation
- 5.2.6. Other End-users
- 5.3. Market Analysis, Insights and Forecast - by Region
- 5.3.1. North America
- 5.3.2. Europe
- 5.3.3. Asia Pacific
- 5.3.4. South America
- 5.3.5. Middle East and Africa
- 5.1. Market Analysis, Insights and Forecast - by Type
- 6. North America Self-Serve Industry Analysis, Insights and Forecast, 2019-2031
- 6.1. Market Analysis, Insights and Forecast - by Type
- 6.1.1. Kiosk
- 6.1.2. ATM
- 6.1.3. Vending Machine
- 6.2. Market Analysis, Insights and Forecast - by End-user
- 6.2.1. BFSI
- 6.2.2. Retail & Fast Food Chain
- 6.2.3. Hospitality
- 6.2.4. Healthcare
- 6.2.5. Travel & Transportation
- 6.2.6. Other End-users
- 6.1. Market Analysis, Insights and Forecast - by Type
- 7. Europe Self-Serve Industry Analysis, Insights and Forecast, 2019-2031
- 7.1. Market Analysis, Insights and Forecast - by Type
- 7.1.1. Kiosk
- 7.1.2. ATM
- 7.1.3. Vending Machine
- 7.2. Market Analysis, Insights and Forecast - by End-user
- 7.2.1. BFSI
- 7.2.2. Retail & Fast Food Chain
- 7.2.3. Hospitality
- 7.2.4. Healthcare
- 7.2.5. Travel & Transportation
- 7.2.6. Other End-users
- 7.1. Market Analysis, Insights and Forecast - by Type
- 8. Asia Pacific Self-Serve Industry Analysis, Insights and Forecast, 2019-2031
- 8.1. Market Analysis, Insights and Forecast - by Type
- 8.1.1. Kiosk
- 8.1.2. ATM
- 8.1.3. Vending Machine
- 8.2. Market Analysis, Insights and Forecast - by End-user
- 8.2.1. BFSI
- 8.2.2. Retail & Fast Food Chain
- 8.2.3. Hospitality
- 8.2.4. Healthcare
- 8.2.5. Travel & Transportation
- 8.2.6. Other End-users
- 8.1. Market Analysis, Insights and Forecast - by Type
- 9. South America Self-Serve Industry Analysis, Insights and Forecast, 2019-2031
- 9.1. Market Analysis, Insights and Forecast - by Type
- 9.1.1. Kiosk
- 9.1.2. ATM
- 9.1.3. Vending Machine
- 9.2. Market Analysis, Insights and Forecast - by End-user
- 9.2.1. BFSI
- 9.2.2. Retail & Fast Food Chain
- 9.2.3. Hospitality
- 9.2.4. Healthcare
- 9.2.5. Travel & Transportation
- 9.2.6. Other End-users
- 9.1. Market Analysis, Insights and Forecast - by Type
- 10. Middle East and Africa Self-Serve Industry Analysis, Insights and Forecast, 2019-2031
- 10.1. Market Analysis, Insights and Forecast - by Type
- 10.1.1. Kiosk
- 10.1.2. ATM
- 10.1.3. Vending Machine
- 10.2. Market Analysis, Insights and Forecast - by End-user
- 10.2.1. BFSI
- 10.2.2. Retail & Fast Food Chain
- 10.2.3. Hospitality
- 10.2.4. Healthcare
- 10.2.5. Travel & Transportation
- 10.2.6. Other End-users
- 10.1. Market Analysis, Insights and Forecast - by Type
- 11. North America Self-Serve Industry Analysis, Insights and Forecast, 2019-2031
- 11.1. Market Analysis, Insights and Forecast - By Country/Sub-region
- 11.1.1.
- 12. Europe Self-Serve Industry Analysis, Insights and Forecast, 2019-2031
- 12.1. Market Analysis, Insights and Forecast - By Country/Sub-region
- 12.1.1.
- 13. Asia Pacific Self-Serve Industry Analysis, Insights and Forecast, 2019-2031
- 13.1. Market Analysis, Insights and Forecast - By Country/Sub-region
- 13.1.1.
- 14. South America Self-Serve Industry Analysis, Insights and Forecast, 2019-2031
- 14.1. Market Analysis, Insights and Forecast - By Country/Sub-region
- 14.1.1.
- 15. Middle East and Africa Self-Serve Industry Analysis, Insights and Forecast, 2019-2031
- 15.1. Market Analysis, Insights and Forecast - By Country/Sub-region
- 15.1.1.
- 16. Competitive Analysis
- 16.1. Global Market Share Analysis 2024
- 16.2. Company Profiles
- 16.2.1 MaasInternationalEuropeB V*List Not Exhaustive
- 16.2.1.1. Overview
- 16.2.1.2. Products
- 16.2.1.3. SWOT Analysis
- 16.2.1.4. Recent Developments
- 16.2.1.5. Financials (Based on Availability)
- 16.2.2 Fujitsu Ltd
- 16.2.2.1. Overview
- 16.2.2.2. Products
- 16.2.2.3. SWOT Analysis
- 16.2.2.4. Recent Developments
- 16.2.2.5. Financials (Based on Availability)
- 16.2.3 Crane Co (USA)
- 16.2.3.1. Overview
- 16.2.3.2. Products
- 16.2.3.3. SWOT Analysis
- 16.2.3.4. Recent Developments
- 16.2.3.5. Financials (Based on Availability)
- 16.2.4 NCR Corporation
- 16.2.4.1. Overview
- 16.2.4.2. Products
- 16.2.4.3. SWOT Analysis
- 16.2.4.4. Recent Developments
- 16.2.4.5. Financials (Based on Availability)
- 16.2.5 SEDCO
- 16.2.5.1. Overview
- 16.2.5.2. Products
- 16.2.5.3. SWOT Analysis
- 16.2.5.4. Recent Developments
- 16.2.5.5. Financials (Based on Availability)
- 16.2.6 Frank Mayer & Associates Inc
- 16.2.6.1. Overview
- 16.2.6.2. Products
- 16.2.6.3. SWOT Analysis
- 16.2.6.4. Recent Developments
- 16.2.6.5. Financials (Based on Availability)
- 16.2.7 Advanced Kiosks
- 16.2.7.1. Overview
- 16.2.7.2. Products
- 16.2.7.3. SWOT Analysis
- 16.2.7.4. Recent Developments
- 16.2.7.5. Financials (Based on Availability)
- 16.2.8 Azkoyen Group
- 16.2.8.1. Overview
- 16.2.8.2. Products
- 16.2.8.3. SWOT Analysis
- 16.2.8.4. Recent Developments
- 16.2.8.5. Financials (Based on Availability)
- 16.2.9 Advantech Co Limited
- 16.2.9.1. Overview
- 16.2.9.2. Products
- 16.2.9.3. SWOT Analysis
- 16.2.9.4. Recent Developments
- 16.2.9.5. Financials (Based on Availability)
- 16.2.10 ProtouchUK
- 16.2.10.1. Overview
- 16.2.10.2. Products
- 16.2.10.3. SWOT Analysis
- 16.2.10.4. Recent Developments
- 16.2.10.5. Financials (Based on Availability)
- 16.2.11 Zebra Technologies
- 16.2.11.1. Overview
- 16.2.11.2. Products
- 16.2.11.3. SWOT Analysis
- 16.2.11.4. Recent Developments
- 16.2.11.5. Financials (Based on Availability)
- 16.2.12 HESS Cash systems GmbH & Co
- 16.2.12.1. Overview
- 16.2.12.2. Products
- 16.2.12.3. SWOT Analysis
- 16.2.12.4. Recent Developments
- 16.2.12.5. Financials (Based on Availability)
- 16.2.13 Diebold Nixdorf
- 16.2.13.1. Overview
- 16.2.13.2. Products
- 16.2.13.3. SWOT Analysis
- 16.2.13.4. Recent Developments
- 16.2.13.5. Financials (Based on Availability)
- 16.2.14 Embross
- 16.2.14.1. Overview
- 16.2.14.2. Products
- 16.2.14.3. SWOT Analysis
- 16.2.14.4. Recent Developments
- 16.2.14.5. Financials (Based on Availability)
- 16.2.15 IER Group
- 16.2.15.1. Overview
- 16.2.15.2. Products
- 16.2.15.3. SWOT Analysis
- 16.2.15.4. Recent Developments
- 16.2.15.5. Financials (Based on Availability)
- 16.2.1 MaasInternationalEuropeB V*List Not Exhaustive
List of Figures
- Figure 1: Global Self-Serve Industry Revenue Breakdown (Million, %) by Region 2024 & 2032
- Figure 2: North America Self-Serve Industry Revenue (Million), by Country 2024 & 2032
- Figure 3: North America Self-Serve Industry Revenue Share (%), by Country 2024 & 2032
- Figure 4: Europe Self-Serve Industry Revenue (Million), by Country 2024 & 2032
- Figure 5: Europe Self-Serve Industry Revenue Share (%), by Country 2024 & 2032
- Figure 6: Asia Pacific Self-Serve Industry Revenue (Million), by Country 2024 & 2032
- Figure 7: Asia Pacific Self-Serve Industry Revenue Share (%), by Country 2024 & 2032
- Figure 8: South America Self-Serve Industry Revenue (Million), by Country 2024 & 2032
- Figure 9: South America Self-Serve Industry Revenue Share (%), by Country 2024 & 2032
- Figure 10: Middle East and Africa Self-Serve Industry Revenue (Million), by Country 2024 & 2032
- Figure 11: Middle East and Africa Self-Serve Industry Revenue Share (%), by Country 2024 & 2032
- Figure 12: North America Self-Serve Industry Revenue (Million), by Type 2024 & 2032
- Figure 13: North America Self-Serve Industry Revenue Share (%), by Type 2024 & 2032
- Figure 14: North America Self-Serve Industry Revenue (Million), by End-user 2024 & 2032
- Figure 15: North America Self-Serve Industry Revenue Share (%), by End-user 2024 & 2032
- Figure 16: North America Self-Serve Industry Revenue (Million), by Country 2024 & 2032
- Figure 17: North America Self-Serve Industry Revenue Share (%), by Country 2024 & 2032
- Figure 18: Europe Self-Serve Industry Revenue (Million), by Type 2024 & 2032
- Figure 19: Europe Self-Serve Industry Revenue Share (%), by Type 2024 & 2032
- Figure 20: Europe Self-Serve Industry Revenue (Million), by End-user 2024 & 2032
- Figure 21: Europe Self-Serve Industry Revenue Share (%), by End-user 2024 & 2032
- Figure 22: Europe Self-Serve Industry Revenue (Million), by Country 2024 & 2032
- Figure 23: Europe Self-Serve Industry Revenue Share (%), by Country 2024 & 2032
- Figure 24: Asia Pacific Self-Serve Industry Revenue (Million), by Type 2024 & 2032
- Figure 25: Asia Pacific Self-Serve Industry Revenue Share (%), by Type 2024 & 2032
- Figure 26: Asia Pacific Self-Serve Industry Revenue (Million), by End-user 2024 & 2032
- Figure 27: Asia Pacific Self-Serve Industry Revenue Share (%), by End-user 2024 & 2032
- Figure 28: Asia Pacific Self-Serve Industry Revenue (Million), by Country 2024 & 2032
- Figure 29: Asia Pacific Self-Serve Industry Revenue Share (%), by Country 2024 & 2032
- Figure 30: South America Self-Serve Industry Revenue (Million), by Type 2024 & 2032
- Figure 31: South America Self-Serve Industry Revenue Share (%), by Type 2024 & 2032
- Figure 32: South America Self-Serve Industry Revenue (Million), by End-user 2024 & 2032
- Figure 33: South America Self-Serve Industry Revenue Share (%), by End-user 2024 & 2032
- Figure 34: South America Self-Serve Industry Revenue (Million), by Country 2024 & 2032
- Figure 35: South America Self-Serve Industry Revenue Share (%), by Country 2024 & 2032
- Figure 36: Middle East and Africa Self-Serve Industry Revenue (Million), by Type 2024 & 2032
- Figure 37: Middle East and Africa Self-Serve Industry Revenue Share (%), by Type 2024 & 2032
- Figure 38: Middle East and Africa Self-Serve Industry Revenue (Million), by End-user 2024 & 2032
- Figure 39: Middle East and Africa Self-Serve Industry Revenue Share (%), by End-user 2024 & 2032
- Figure 40: Middle East and Africa Self-Serve Industry Revenue (Million), by Country 2024 & 2032
- Figure 41: Middle East and Africa Self-Serve Industry Revenue Share (%), by Country 2024 & 2032
List of Tables
- Table 1: Global Self-Serve Industry Revenue Million Forecast, by Region 2019 & 2032
- Table 2: Global Self-Serve Industry Revenue Million Forecast, by Type 2019 & 2032
- Table 3: Global Self-Serve Industry Revenue Million Forecast, by End-user 2019 & 2032
- Table 4: Global Self-Serve Industry Revenue Million Forecast, by Region 2019 & 2032
- Table 5: Global Self-Serve Industry Revenue Million Forecast, by Country 2019 & 2032
- Table 6: Self-Serve Industry Revenue (Million) Forecast, by Application 2019 & 2032
- Table 7: Global Self-Serve Industry Revenue Million Forecast, by Country 2019 & 2032
- Table 8: Self-Serve Industry Revenue (Million) Forecast, by Application 2019 & 2032
- Table 9: Global Self-Serve Industry Revenue Million Forecast, by Country 2019 & 2032
- Table 10: Self-Serve Industry Revenue (Million) Forecast, by Application 2019 & 2032
- Table 11: Global Self-Serve Industry Revenue Million Forecast, by Country 2019 & 2032
- Table 12: Self-Serve Industry Revenue (Million) Forecast, by Application 2019 & 2032
- Table 13: Global Self-Serve Industry Revenue Million Forecast, by Country 2019 & 2032
- Table 14: Self-Serve Industry Revenue (Million) Forecast, by Application 2019 & 2032
- Table 15: Global Self-Serve Industry Revenue Million Forecast, by Type 2019 & 2032
- Table 16: Global Self-Serve Industry Revenue Million Forecast, by End-user 2019 & 2032
- Table 17: Global Self-Serve Industry Revenue Million Forecast, by Country 2019 & 2032
- Table 18: Global Self-Serve Industry Revenue Million Forecast, by Type 2019 & 2032
- Table 19: Global Self-Serve Industry Revenue Million Forecast, by End-user 2019 & 2032
- Table 20: Global Self-Serve Industry Revenue Million Forecast, by Country 2019 & 2032
- Table 21: Global Self-Serve Industry Revenue Million Forecast, by Type 2019 & 2032
- Table 22: Global Self-Serve Industry Revenue Million Forecast, by End-user 2019 & 2032
- Table 23: Global Self-Serve Industry Revenue Million Forecast, by Country 2019 & 2032
- Table 24: Global Self-Serve Industry Revenue Million Forecast, by Type 2019 & 2032
- Table 25: Global Self-Serve Industry Revenue Million Forecast, by End-user 2019 & 2032
- Table 26: Global Self-Serve Industry Revenue Million Forecast, by Country 2019 & 2032
- Table 27: Global Self-Serve Industry Revenue Million Forecast, by Type 2019 & 2032
- Table 28: Global Self-Serve Industry Revenue Million Forecast, by End-user 2019 & 2032
- Table 29: Global Self-Serve Industry Revenue Million Forecast, by Country 2019 & 2032
Frequently Asked Questions
1. What is the projected Compound Annual Growth Rate (CAGR) of the Self-Serve Industry?
The projected CAGR is approximately 7.79%.
2. Which companies are prominent players in the Self-Serve Industry?
Key companies in the market include MaasInternationalEuropeB V*List Not Exhaustive, Fujitsu Ltd, Crane Co (USA), NCR Corporation, SEDCO, Frank Mayer & Associates Inc, Advanced Kiosks, Azkoyen Group, Advantech Co Limited, ProtouchUK, Zebra Technologies, HESS Cash systems GmbH & Co, Diebold Nixdorf, Embross, IER Group.
3. What are the main segments of the Self-Serve Industry?
The market segments include Type, End-user.
4. Can you provide details about the market size?
The market size is estimated to be USD 38.22 Million as of 2022.
5. What are some drivers contributing to market growth?
Growing emphasis on ensuring customer satisfaction to drive demand in the Retail & Food sector; High investments in the infrastructure developments (new & refurbishments) and smart city initiatives; Technological investments to enable greater support for the differently abled populace & new users.
6. What are the notable trends driving market growth?
Automated Teller Machine (ATM) to Witness the Growth.
7. Are there any restraints impacting market growth?
Cost and maintenance remains a key consideration.
8. Can you provide examples of recent developments in the market?
In Januray 2024 - NCR Corporation announced the launch of its Next Generation Self-Checkout Solution NCR Voyix commerce platform, WHere the NCR Voyix Next Generation Self-Checkout Solution is a significant evolution in the checkout experience for retailers and shoppers alike. It caters to changing shopper journeys, drives inclusion of demographics and payments, and provides an agile, modern software-as-a-service (SaaS) technology stack with a flexible, fabric-like hardware approach.
9. What pricing options are available for accessing the report?
Pricing options include single-user, multi-user, and enterprise licenses priced at USD 4750, USD 5250, and USD 8750 respectively.
10. Is the market size provided in terms of value or volume?
The market size is provided in terms of value, measured in Million.
11. Are there any specific market keywords associated with the report?
Yes, the market keyword associated with the report is "Self-Serve Industry," which aids in identifying and referencing the specific market segment covered.
12. How do I determine which pricing option suits my needs best?
The pricing options vary based on user requirements and access needs. Individual users may opt for single-user licenses, while businesses requiring broader access may choose multi-user or enterprise licenses for cost-effective access to the report.
13. Are there any additional resources or data provided in the Self-Serve Industry report?
While the report offers comprehensive insights, it's advisable to review the specific contents or supplementary materials provided to ascertain if additional resources or data are available.
14. How can I stay updated on further developments or reports in the Self-Serve Industry?
To stay informed about further developments, trends, and reports in the Self-Serve Industry, consider subscribing to industry newsletters, following relevant companies and organizations, or regularly checking reputable industry news sources and publications.
Methodology
Step 1 - Identification of Relevant Samples Size from Population Database


Step 2 - Approaches for Defining Global Market Size (Value, Volume* & Price*)

Note*: In applicable scenarios
Step 3 - Data Sources
Primary Research
- Web Analytics
- Survey Reports
- Research Institute
- Latest Research Reports
- Opinion Leaders
Secondary Research
- Annual Reports
- White Paper
- Latest Press Release
- Industry Association
- Paid Database
- Investor Presentations

Step 4 - Data Triangulation
Involves using different sources of information in order to increase the validity of a study
These sources are likely to be stakeholders in a program - participants, other researchers, program staff, other community members, and so on.
Then we put all data in single framework & apply various statistical tools to find out the dynamic on the market.
During the analysis stage, feedback from the stakeholder groups would be compared to determine areas of agreement as well as areas of divergence
