

Key Insights
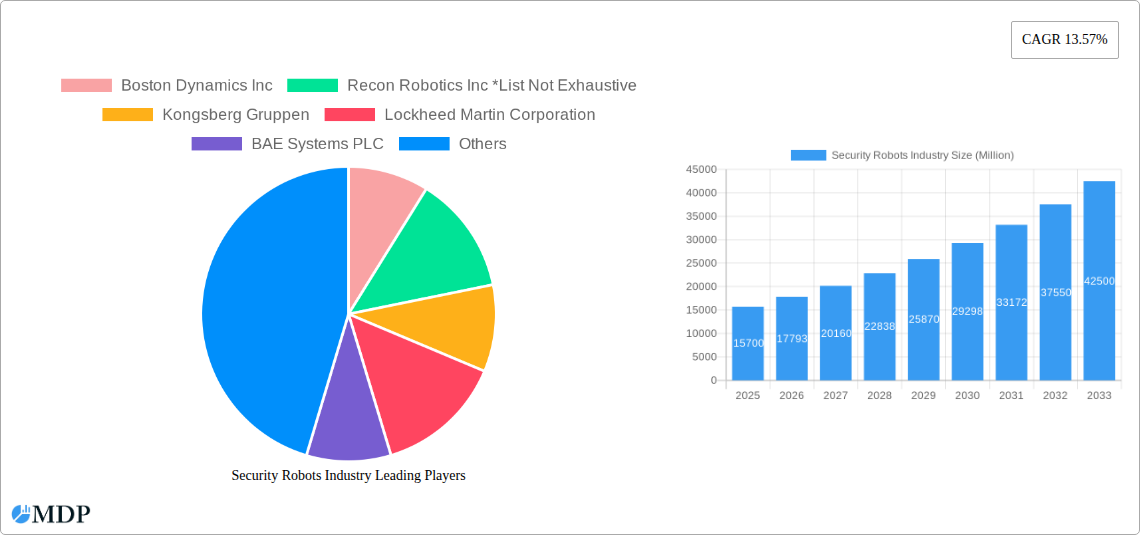
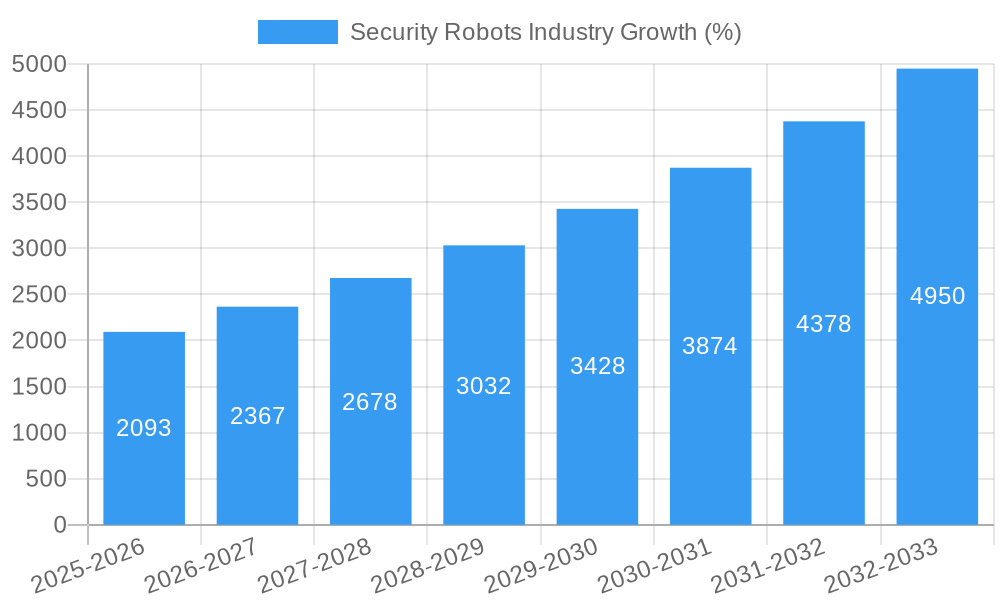
The global security robots market, valued at $15.70 billion in 2025, is projected to experience robust growth, exhibiting a Compound Annual Growth Rate (CAGR) of 13.57% from 2025 to 2033. This expansion is driven by escalating demand for enhanced security measures across diverse sectors, including defense, residential, and commercial applications. The increasing adoption of unmanned aerial vehicles (UAVs), unmanned ground vehicles (UGVs), and autonomous underwater vehicles (AUVs) for surveillance, explosive detection, and patrolling significantly contributes to market growth. Furthermore, advancements in artificial intelligence (AI), sensor technology, and robotics are enabling the development of more sophisticated and effective security robots, capable of performing complex tasks autonomously. Government initiatives promoting the use of robotics in security and defense, coupled with rising concerns regarding terrorism and crime, further fuel market expansion. However, high initial investment costs associated with robot procurement and maintenance, as well as concerns surrounding data privacy and ethical implications, could potentially restrain market growth to some extent.
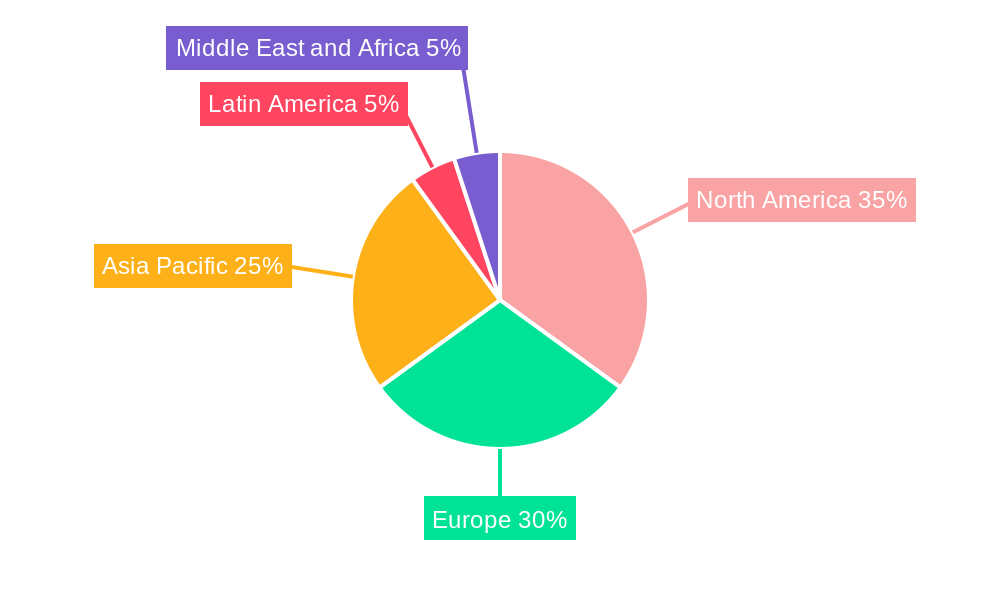
Segmentation analysis reveals that the defense and military end-user segment currently dominates the market, owing to substantial investments in advanced security systems. However, the residential and commercial segments are expected to witness significant growth in the coming years, driven by increasing demand for automated security solutions in both private residences and commercial establishments. Among robot types, UAVs are anticipated to hold the largest market share due to their versatility and cost-effectiveness. Geographically, North America and Europe are currently the leading markets for security robots, benefitting from established technological infrastructure and high levels of defense spending. However, the Asia-Pacific region is poised for rapid growth, fueled by increasing urbanization and industrialization, leading to heightened security concerns. Key players like Boston Dynamics, Recon Robotics, and others are driving innovation and competition, further shaping the trajectory of this dynamic market.
Security Robots Industry Market Report: 2019-2033
This comprehensive report provides an in-depth analysis of the Security Robots industry, offering valuable insights for stakeholders, investors, and industry professionals. Covering the period from 2019 to 2033, with a focus on 2025, this report projects a robust market expansion driven by technological advancements and increasing demand across diverse sectors. The global market is expected to reach xx Million by 2033, exhibiting a CAGR of xx% during the forecast period (2025-2033). This report analyzes key market trends, leading players (including Boston Dynamics Inc, Recon Robotics Inc, Kongsberg Gruppen, and more), and emerging opportunities, providing a crucial roadmap for navigating this rapidly evolving landscape.
Security Robots Industry Market Dynamics & Concentration
The security robots market is characterized by moderate concentration, with several key players vying for market share. Market dynamics are shaped by rapid technological innovation, evolving regulatory frameworks, and the increasing adoption of robots across various end-user sectors. Innovation is primarily driven by advancements in AI, machine learning, and sensor technologies, leading to more sophisticated and autonomous robots. Regulatory frameworks concerning data privacy, ethical considerations, and weaponization are becoming increasingly important. Product substitutes include traditional security systems, but the increasing advantages of robotics in terms of cost-effectiveness and enhanced capabilities are driving market penetration. Mergers and acquisitions (M&A) activity is anticipated to increase, consolidating market share and accelerating innovation.
- Market Share: The top 5 players hold an estimated xx% of the market share in 2025. This is projected to slightly decrease to xx% by 2033 as smaller players gain traction.
- M&A Activity: An average of xx M&A deals are projected to occur annually during the forecast period (2025-2033).
- End-User Trends: The defense and military sector currently accounts for the largest share of market demand. This dominance will shift slightly towards the commercial sector due to the increasing adoption of security robots in various commercial sectors.
Security Robots Industry Industry Trends & Analysis
The security robots market is experiencing robust growth, driven by several factors. The increasing demand for enhanced security solutions across various sectors, including defense, residential, and commercial applications, significantly boosts market growth. Technological advancements, particularly in AI and autonomous navigation, are enabling the development of more sophisticated and efficient security robots. Consumer preferences are shifting towards automated and intelligent security systems, leading to higher adoption rates. However, competitive dynamics are intense, with established players and emerging startups constantly innovating to gain a competitive edge. This competitive landscape fosters innovation and drives down costs, benefiting end-users.
- CAGR (2025-2033): xx%
- Market Penetration: Projected to reach xx% in 2033 from xx% in 2025.
Leading Markets & Segments in Security Robots Industry
The North American market currently holds the largest share of the security robots market, driven by robust demand from the defense and commercial sectors. The Asia-Pacific region is expected to witness significant growth in the coming years, driven by economic growth and infrastructure development.
By Type of Robot:
- Unmanned Aerial Vehicles (UAVs): Dominate the market due to their versatility and cost-effectiveness.
- Unmanned Ground Vehicles (UGVs): Show strong growth potential, particularly in patrolling and explosive detection applications.
- Autonomous Underwater Vehicles (AUVs): Show slower growth compared to UAVs and UGVs, but are expected to increase in usage for securing water-bound infrastructure and underwater patrols.
By End-user:
- Defense and Military: Remains the largest segment, driven by high defense budgets and the need for advanced security solutions.
- Commercial: Exhibits significant growth potential, driven by the rising adoption of security robots in various commercial settings like warehouses, shopping malls, and businesses.
- Residential: Adoption remains relatively low, but is expected to see a rise in consumer interest and affordability.
By Application:
- Patrolling: The most widely adopted application due to its ease of implementation and effectiveness.
- Explosive Detection: A critical application, driving demand for specialized robots with advanced sensors.
- Spying: A more niche application, subject to regulatory scrutiny and ethical considerations.
- Rescue Operations: Emerging as a significant application, with high potential for growth in emergency response situations.
Security Robots Industry Product Developments
Recent product developments focus on enhancing robot autonomy, intelligence, and adaptability. Integration of advanced sensors, AI algorithms, and cloud-based data analytics is improving robot capabilities for tasks such as real-time threat assessment, improved object recognition, and optimized navigation in complex environments. This enhances both performance and market fit, providing more efficient and effective security solutions across diverse applications.
Key Drivers of Security Robots Industry Growth
Technological advancements, including AI, machine learning, and improved sensor technology, are key drivers. The rising need for enhanced security across various sectors, including defense, commercial, and residential, fuel demand. Furthermore, government initiatives and supportive regulatory frameworks are encouraging adoption and fostering technological advancements.
Challenges in the Security Robots Industry Market
High initial investment costs, limited battery life for some robots, and concerns regarding data privacy and cybersecurity are major challenges. Supply chain disruptions and the complex regulatory landscape in different regions also present significant hurdles to market penetration. Finally, intense competition and the need for continuous innovation add complexity to market entry and market share acquisition.
Emerging Opportunities in Security Robots Industry
The integration of advanced AI and machine learning capabilities promises to significantly enhance the capabilities of security robots. Strategic partnerships between robotics companies and security solution providers are emerging, creating new market opportunities. Expansion into new markets, particularly in developing economies with growing security needs, holds immense potential.
Leading Players in the Security Robots Industry Sector
- Boston Dynamics Inc
- Recon Robotics Inc
- Kongsberg Gruppen
- Lockheed Martin Corporation
- BAE Systems PLC
- Knight Scope Inc
- Aerovironment Inc
- Elbit Systems Limited
- Qinetiq Group PLC
- SMP Robotics
- Thales SA
- SZ DJI Technology Co Ltd
- RoboTex Inc
- Northrop Grumman Corporation
- Leonardo SPA
- FLIR Systems Inc
Key Milestones in Security Robots Industry Industry
- August 2022: Hyundai Motor Group launches Boston Dynamics AI Institute with a USD 400 Million investment, focusing on advancements in AI and robotics for enhanced robot capabilities. This signifies a major commitment to technological advancement in the sector.
- March 2022: Halodi Robotics signs an agreement to provide 140 humanoid robots to ADT Commercial, showcasing growing commercial adoption of security robots and validating market demand.
Strategic Outlook for Security Robots Industry Market
The security robots market is poised for substantial growth, driven by continuous technological innovation, increasing demand across diverse sectors, and supportive regulatory frameworks. Strategic partnerships and market expansion initiatives will play a key role in shaping the industry landscape. The focus on enhancing AI and machine learning capabilities will create new opportunities, leading to more sophisticated and versatile security solutions.
Security Robots Industry Segmentation
-
1. Type of Robot
- 1.1. Unmanned Aerial Vehicles
- 1.2. Unmanned Ground Vehicles
- 1.3. Autonomous Underwater Vehicles
-
2. End User
- 2.1. Defense and Military
- 2.2. Residential
- 2.3. Commercial
-
3. Application
- 3.1. Spying
- 3.2. Explosive Detection
- 3.3. Patrolling
- 3.4. Rescue Operations
- 3.5. Other Applications
Security Robots Industry Segmentation By Geography
- 1. North America
- 2. Europe
- 3. Asia
- 4. Australia and New Zealand
- 5. Latin America
- 6. Middle East and Africa
Security Robots Industry REPORT HIGHLIGHTS
| Aspects | Details |
|---|---|
| Study Period | 2019-2033 |
| Base Year | 2024 |
| Estimated Year | 2025 |
| Forecast Period | 2025-2033 |
| Historical Period | 2019-2024 |
| Growth Rate | CAGR of 13.57% from 2019-2033 |
| Segmentation |
|
Table of Contents
- 1. Introduction
- 1.1. Research Scope
- 1.2. Market Segmentation
- 1.3. Research Methodology
- 1.4. Definitions and Assumptions
- 2. Executive Summary
- 2.1. Introduction
- 3. Market Dynamics
- 3.1. Introduction
- 3.2. Market Drivers
- 3.2.1. Increasing Usage of Robots in Security and Surveillance Applications; Rising Safety Concerns
- 3.3. Market Restrains
- 3.3.1. Rising Concerns About Privacy and Intrusion
- 3.4. Market Trends
- 3.4.1. Commercial End-user Industry is Expected to Hold a Significant Share
- 4. Market Factor Analysis
- 4.1. Porters Five Forces
- 4.2. Supply/Value Chain
- 4.3. PESTEL analysis
- 4.4. Market Entropy
- 4.5. Patent/Trademark Analysis
- 5. Global Security Robots Industry Analysis, Insights and Forecast, 2019-2031
- 5.1. Market Analysis, Insights and Forecast - by Type of Robot
- 5.1.1. Unmanned Aerial Vehicles
- 5.1.2. Unmanned Ground Vehicles
- 5.1.3. Autonomous Underwater Vehicles
- 5.2. Market Analysis, Insights and Forecast - by End User
- 5.2.1. Defense and Military
- 5.2.2. Residential
- 5.2.3. Commercial
- 5.3. Market Analysis, Insights and Forecast - by Application
- 5.3.1. Spying
- 5.3.2. Explosive Detection
- 5.3.3. Patrolling
- 5.3.4. Rescue Operations
- 5.3.5. Other Applications
- 5.4. Market Analysis, Insights and Forecast - by Region
- 5.4.1. North America
- 5.4.2. Europe
- 5.4.3. Asia
- 5.4.4. Australia and New Zealand
- 5.4.5. Latin America
- 5.4.6. Middle East and Africa
- 5.1. Market Analysis, Insights and Forecast - by Type of Robot
- 6. North America Security Robots Industry Analysis, Insights and Forecast, 2019-2031
- 6.1. Market Analysis, Insights and Forecast - by Type of Robot
- 6.1.1. Unmanned Aerial Vehicles
- 6.1.2. Unmanned Ground Vehicles
- 6.1.3. Autonomous Underwater Vehicles
- 6.2. Market Analysis, Insights and Forecast - by End User
- 6.2.1. Defense and Military
- 6.2.2. Residential
- 6.2.3. Commercial
- 6.3. Market Analysis, Insights and Forecast - by Application
- 6.3.1. Spying
- 6.3.2. Explosive Detection
- 6.3.3. Patrolling
- 6.3.4. Rescue Operations
- 6.3.5. Other Applications
- 6.1. Market Analysis, Insights and Forecast - by Type of Robot
- 7. Europe Security Robots Industry Analysis, Insights and Forecast, 2019-2031
- 7.1. Market Analysis, Insights and Forecast - by Type of Robot
- 7.1.1. Unmanned Aerial Vehicles
- 7.1.2. Unmanned Ground Vehicles
- 7.1.3. Autonomous Underwater Vehicles
- 7.2. Market Analysis, Insights and Forecast - by End User
- 7.2.1. Defense and Military
- 7.2.2. Residential
- 7.2.3. Commercial
- 7.3. Market Analysis, Insights and Forecast - by Application
- 7.3.1. Spying
- 7.3.2. Explosive Detection
- 7.3.3. Patrolling
- 7.3.4. Rescue Operations
- 7.3.5. Other Applications
- 7.1. Market Analysis, Insights and Forecast - by Type of Robot
- 8. Asia Security Robots Industry Analysis, Insights and Forecast, 2019-2031
- 8.1. Market Analysis, Insights and Forecast - by Type of Robot
- 8.1.1. Unmanned Aerial Vehicles
- 8.1.2. Unmanned Ground Vehicles
- 8.1.3. Autonomous Underwater Vehicles
- 8.2. Market Analysis, Insights and Forecast - by End User
- 8.2.1. Defense and Military
- 8.2.2. Residential
- 8.2.3. Commercial
- 8.3. Market Analysis, Insights and Forecast - by Application
- 8.3.1. Spying
- 8.3.2. Explosive Detection
- 8.3.3. Patrolling
- 8.3.4. Rescue Operations
- 8.3.5. Other Applications
- 8.1. Market Analysis, Insights and Forecast - by Type of Robot
- 9. Australia and New Zealand Security Robots Industry Analysis, Insights and Forecast, 2019-2031
- 9.1. Market Analysis, Insights and Forecast - by Type of Robot
- 9.1.1. Unmanned Aerial Vehicles
- 9.1.2. Unmanned Ground Vehicles
- 9.1.3. Autonomous Underwater Vehicles
- 9.2. Market Analysis, Insights and Forecast - by End User
- 9.2.1. Defense and Military
- 9.2.2. Residential
- 9.2.3. Commercial
- 9.3. Market Analysis, Insights and Forecast - by Application
- 9.3.1. Spying
- 9.3.2. Explosive Detection
- 9.3.3. Patrolling
- 9.3.4. Rescue Operations
- 9.3.5. Other Applications
- 9.1. Market Analysis, Insights and Forecast - by Type of Robot
- 10. Latin America Security Robots Industry Analysis, Insights and Forecast, 2019-2031
- 10.1. Market Analysis, Insights and Forecast - by Type of Robot
- 10.1.1. Unmanned Aerial Vehicles
- 10.1.2. Unmanned Ground Vehicles
- 10.1.3. Autonomous Underwater Vehicles
- 10.2. Market Analysis, Insights and Forecast - by End User
- 10.2.1. Defense and Military
- 10.2.2. Residential
- 10.2.3. Commercial
- 10.3. Market Analysis, Insights and Forecast - by Application
- 10.3.1. Spying
- 10.3.2. Explosive Detection
- 10.3.3. Patrolling
- 10.3.4. Rescue Operations
- 10.3.5. Other Applications
- 10.1. Market Analysis, Insights and Forecast - by Type of Robot
- 11. Middle East and Africa Security Robots Industry Analysis, Insights and Forecast, 2019-2031
- 11.1. Market Analysis, Insights and Forecast - by Type of Robot
- 11.1.1. Unmanned Aerial Vehicles
- 11.1.2. Unmanned Ground Vehicles
- 11.1.3. Autonomous Underwater Vehicles
- 11.2. Market Analysis, Insights and Forecast - by End User
- 11.2.1. Defense and Military
- 11.2.2. Residential
- 11.2.3. Commercial
- 11.3. Market Analysis, Insights and Forecast - by Application
- 11.3.1. Spying
- 11.3.2. Explosive Detection
- 11.3.3. Patrolling
- 11.3.4. Rescue Operations
- 11.3.5. Other Applications
- 11.1. Market Analysis, Insights and Forecast - by Type of Robot
- 12. North America Security Robots Industry Analysis, Insights and Forecast, 2019-2031
- 12.1. Market Analysis, Insights and Forecast - By Country/Sub-region
- 12.1.1 United States
- 12.1.2 Canada
- 13. Europe Security Robots Industry Analysis, Insights and Forecast, 2019-2031
- 13.1. Market Analysis, Insights and Forecast - By Country/Sub-region
- 13.1.1 Germany
- 13.1.2 United Kingdom
- 13.1.3 France
- 13.1.4 Rest of Europe
- 14. Asia Pacific Security Robots Industry Analysis, Insights and Forecast, 2019-2031
- 14.1. Market Analysis, Insights and Forecast - By Country/Sub-region
- 14.1.1 China
- 14.1.2 Japan
- 14.1.3 India
- 14.1.4 South Korea
- 14.1.5 Rest of Asia Pacific
- 15. Latin America Security Robots Industry Analysis, Insights and Forecast, 2019-2031
- 15.1. Market Analysis, Insights and Forecast - By Country/Sub-region
- 15.1.1 Brazil
- 15.1.2 Mexico
- 15.1.3 Rest of Latin America
- 16. Middle East and Africa Security Robots Industry Analysis, Insights and Forecast, 2019-2031
- 16.1. Market Analysis, Insights and Forecast - By Country/Sub-region
- 16.1.1 United Arab Emirates
- 16.1.2 Saudi Arabia
- 16.1.3 South Africa
- 16.1.4 Rest of Middle East and Africa
- 17. Competitive Analysis
- 17.1. Global Market Share Analysis 2024
- 17.2. Company Profiles
- 17.2.1 Boston Dynamics Inc
- 17.2.1.1. Overview
- 17.2.1.2. Products
- 17.2.1.3. SWOT Analysis
- 17.2.1.4. Recent Developments
- 17.2.1.5. Financials (Based on Availability)
- 17.2.2 Recon Robotics Inc *List Not Exhaustive
- 17.2.2.1. Overview
- 17.2.2.2. Products
- 17.2.2.3. SWOT Analysis
- 17.2.2.4. Recent Developments
- 17.2.2.5. Financials (Based on Availability)
- 17.2.3 Kongsberg Gruppen
- 17.2.3.1. Overview
- 17.2.3.2. Products
- 17.2.3.3. SWOT Analysis
- 17.2.3.4. Recent Developments
- 17.2.3.5. Financials (Based on Availability)
- 17.2.4 Lockheed Martin Corporation
- 17.2.4.1. Overview
- 17.2.4.2. Products
- 17.2.4.3. SWOT Analysis
- 17.2.4.4. Recent Developments
- 17.2.4.5. Financials (Based on Availability)
- 17.2.5 BAE Systems PLC
- 17.2.5.1. Overview
- 17.2.5.2. Products
- 17.2.5.3. SWOT Analysis
- 17.2.5.4. Recent Developments
- 17.2.5.5. Financials (Based on Availability)
- 17.2.6 Knight Scope Inc
- 17.2.6.1. Overview
- 17.2.6.2. Products
- 17.2.6.3. SWOT Analysis
- 17.2.6.4. Recent Developments
- 17.2.6.5. Financials (Based on Availability)
- 17.2.7 Aerovironment Inc
- 17.2.7.1. Overview
- 17.2.7.2. Products
- 17.2.7.3. SWOT Analysis
- 17.2.7.4. Recent Developments
- 17.2.7.5. Financials (Based on Availability)
- 17.2.8 Elbit Systems Limited
- 17.2.8.1. Overview
- 17.2.8.2. Products
- 17.2.8.3. SWOT Analysis
- 17.2.8.4. Recent Developments
- 17.2.8.5. Financials (Based on Availability)
- 17.2.9 Qinetiq Group PLC
- 17.2.9.1. Overview
- 17.2.9.2. Products
- 17.2.9.3. SWOT Analysis
- 17.2.9.4. Recent Developments
- 17.2.9.5. Financials (Based on Availability)
- 17.2.10 SMP Robotics
- 17.2.10.1. Overview
- 17.2.10.2. Products
- 17.2.10.3. SWOT Analysis
- 17.2.10.4. Recent Developments
- 17.2.10.5. Financials (Based on Availability)
- 17.2.11 Thales SA
- 17.2.11.1. Overview
- 17.2.11.2. Products
- 17.2.11.3. SWOT Analysis
- 17.2.11.4. Recent Developments
- 17.2.11.5. Financials (Based on Availability)
- 17.2.12 SZ DJI Technology Co Ltd
- 17.2.12.1. Overview
- 17.2.12.2. Products
- 17.2.12.3. SWOT Analysis
- 17.2.12.4. Recent Developments
- 17.2.12.5. Financials (Based on Availability)
- 17.2.13 RoboTex Inc
- 17.2.13.1. Overview
- 17.2.13.2. Products
- 17.2.13.3. SWOT Analysis
- 17.2.13.4. Recent Developments
- 17.2.13.5. Financials (Based on Availability)
- 17.2.14 Northrop Grumman Corporation
- 17.2.14.1. Overview
- 17.2.14.2. Products
- 17.2.14.3. SWOT Analysis
- 17.2.14.4. Recent Developments
- 17.2.14.5. Financials (Based on Availability)
- 17.2.15 Leonardo SPA
- 17.2.15.1. Overview
- 17.2.15.2. Products
- 17.2.15.3. SWOT Analysis
- 17.2.15.4. Recent Developments
- 17.2.15.5. Financials (Based on Availability)
- 17.2.16 FLIR Systems Inc
- 17.2.16.1. Overview
- 17.2.16.2. Products
- 17.2.16.3. SWOT Analysis
- 17.2.16.4. Recent Developments
- 17.2.16.5. Financials (Based on Availability)
- 17.2.1 Boston Dynamics Inc
List of Figures
- Figure 1: Global Security Robots Industry Revenue Breakdown (Million, %) by Region 2024 & 2032
- Figure 2: North America Security Robots Industry Revenue (Million), by Country 2024 & 2032
- Figure 3: North America Security Robots Industry Revenue Share (%), by Country 2024 & 2032
- Figure 4: Europe Security Robots Industry Revenue (Million), by Country 2024 & 2032
- Figure 5: Europe Security Robots Industry Revenue Share (%), by Country 2024 & 2032
- Figure 6: Asia Pacific Security Robots Industry Revenue (Million), by Country 2024 & 2032
- Figure 7: Asia Pacific Security Robots Industry Revenue Share (%), by Country 2024 & 2032
- Figure 8: Latin America Security Robots Industry Revenue (Million), by Country 2024 & 2032
- Figure 9: Latin America Security Robots Industry Revenue Share (%), by Country 2024 & 2032
- Figure 10: Middle East and Africa Security Robots Industry Revenue (Million), by Country 2024 & 2032
- Figure 11: Middle East and Africa Security Robots Industry Revenue Share (%), by Country 2024 & 2032
- Figure 12: North America Security Robots Industry Revenue (Million), by Type of Robot 2024 & 2032
- Figure 13: North America Security Robots Industry Revenue Share (%), by Type of Robot 2024 & 2032
- Figure 14: North America Security Robots Industry Revenue (Million), by End User 2024 & 2032
- Figure 15: North America Security Robots Industry Revenue Share (%), by End User 2024 & 2032
- Figure 16: North America Security Robots Industry Revenue (Million), by Application 2024 & 2032
- Figure 17: North America Security Robots Industry Revenue Share (%), by Application 2024 & 2032
- Figure 18: North America Security Robots Industry Revenue (Million), by Country 2024 & 2032
- Figure 19: North America Security Robots Industry Revenue Share (%), by Country 2024 & 2032
- Figure 20: Europe Security Robots Industry Revenue (Million), by Type of Robot 2024 & 2032
- Figure 21: Europe Security Robots Industry Revenue Share (%), by Type of Robot 2024 & 2032
- Figure 22: Europe Security Robots Industry Revenue (Million), by End User 2024 & 2032
- Figure 23: Europe Security Robots Industry Revenue Share (%), by End User 2024 & 2032
- Figure 24: Europe Security Robots Industry Revenue (Million), by Application 2024 & 2032
- Figure 25: Europe Security Robots Industry Revenue Share (%), by Application 2024 & 2032
- Figure 26: Europe Security Robots Industry Revenue (Million), by Country 2024 & 2032
- Figure 27: Europe Security Robots Industry Revenue Share (%), by Country 2024 & 2032
- Figure 28: Asia Security Robots Industry Revenue (Million), by Type of Robot 2024 & 2032
- Figure 29: Asia Security Robots Industry Revenue Share (%), by Type of Robot 2024 & 2032
- Figure 30: Asia Security Robots Industry Revenue (Million), by End User 2024 & 2032
- Figure 31: Asia Security Robots Industry Revenue Share (%), by End User 2024 & 2032
- Figure 32: Asia Security Robots Industry Revenue (Million), by Application 2024 & 2032
- Figure 33: Asia Security Robots Industry Revenue Share (%), by Application 2024 & 2032
- Figure 34: Asia Security Robots Industry Revenue (Million), by Country 2024 & 2032
- Figure 35: Asia Security Robots Industry Revenue Share (%), by Country 2024 & 2032
- Figure 36: Australia and New Zealand Security Robots Industry Revenue (Million), by Type of Robot 2024 & 2032
- Figure 37: Australia and New Zealand Security Robots Industry Revenue Share (%), by Type of Robot 2024 & 2032
- Figure 38: Australia and New Zealand Security Robots Industry Revenue (Million), by End User 2024 & 2032
- Figure 39: Australia and New Zealand Security Robots Industry Revenue Share (%), by End User 2024 & 2032
- Figure 40: Australia and New Zealand Security Robots Industry Revenue (Million), by Application 2024 & 2032
- Figure 41: Australia and New Zealand Security Robots Industry Revenue Share (%), by Application 2024 & 2032
- Figure 42: Australia and New Zealand Security Robots Industry Revenue (Million), by Country 2024 & 2032
- Figure 43: Australia and New Zealand Security Robots Industry Revenue Share (%), by Country 2024 & 2032
- Figure 44: Latin America Security Robots Industry Revenue (Million), by Type of Robot 2024 & 2032
- Figure 45: Latin America Security Robots Industry Revenue Share (%), by Type of Robot 2024 & 2032
- Figure 46: Latin America Security Robots Industry Revenue (Million), by End User 2024 & 2032
- Figure 47: Latin America Security Robots Industry Revenue Share (%), by End User 2024 & 2032
- Figure 48: Latin America Security Robots Industry Revenue (Million), by Application 2024 & 2032
- Figure 49: Latin America Security Robots Industry Revenue Share (%), by Application 2024 & 2032
- Figure 50: Latin America Security Robots Industry Revenue (Million), by Country 2024 & 2032
- Figure 51: Latin America Security Robots Industry Revenue Share (%), by Country 2024 & 2032
- Figure 52: Middle East and Africa Security Robots Industry Revenue (Million), by Type of Robot 2024 & 2032
- Figure 53: Middle East and Africa Security Robots Industry Revenue Share (%), by Type of Robot 2024 & 2032
- Figure 54: Middle East and Africa Security Robots Industry Revenue (Million), by End User 2024 & 2032
- Figure 55: Middle East and Africa Security Robots Industry Revenue Share (%), by End User 2024 & 2032
- Figure 56: Middle East and Africa Security Robots Industry Revenue (Million), by Application 2024 & 2032
- Figure 57: Middle East and Africa Security Robots Industry Revenue Share (%), by Application 2024 & 2032
- Figure 58: Middle East and Africa Security Robots Industry Revenue (Million), by Country 2024 & 2032
- Figure 59: Middle East and Africa Security Robots Industry Revenue Share (%), by Country 2024 & 2032
List of Tables
- Table 1: Global Security Robots Industry Revenue Million Forecast, by Region 2019 & 2032
- Table 2: Global Security Robots Industry Revenue Million Forecast, by Type of Robot 2019 & 2032
- Table 3: Global Security Robots Industry Revenue Million Forecast, by End User 2019 & 2032
- Table 4: Global Security Robots Industry Revenue Million Forecast, by Application 2019 & 2032
- Table 5: Global Security Robots Industry Revenue Million Forecast, by Region 2019 & 2032
- Table 6: Global Security Robots Industry Revenue Million Forecast, by Country 2019 & 2032
- Table 7: United States Security Robots Industry Revenue (Million) Forecast, by Application 2019 & 2032
- Table 8: Canada Security Robots Industry Revenue (Million) Forecast, by Application 2019 & 2032
- Table 9: Global Security Robots Industry Revenue Million Forecast, by Country 2019 & 2032
- Table 10: Germany Security Robots Industry Revenue (Million) Forecast, by Application 2019 & 2032
- Table 11: United Kingdom Security Robots Industry Revenue (Million) Forecast, by Application 2019 & 2032
- Table 12: France Security Robots Industry Revenue (Million) Forecast, by Application 2019 & 2032
- Table 13: Rest of Europe Security Robots Industry Revenue (Million) Forecast, by Application 2019 & 2032
- Table 14: Global Security Robots Industry Revenue Million Forecast, by Country 2019 & 2032
- Table 15: China Security Robots Industry Revenue (Million) Forecast, by Application 2019 & 2032
- Table 16: Japan Security Robots Industry Revenue (Million) Forecast, by Application 2019 & 2032
- Table 17: India Security Robots Industry Revenue (Million) Forecast, by Application 2019 & 2032
- Table 18: South Korea Security Robots Industry Revenue (Million) Forecast, by Application 2019 & 2032
- Table 19: Rest of Asia Pacific Security Robots Industry Revenue (Million) Forecast, by Application 2019 & 2032
- Table 20: Global Security Robots Industry Revenue Million Forecast, by Country 2019 & 2032
- Table 21: Brazil Security Robots Industry Revenue (Million) Forecast, by Application 2019 & 2032
- Table 22: Mexico Security Robots Industry Revenue (Million) Forecast, by Application 2019 & 2032
- Table 23: Rest of Latin America Security Robots Industry Revenue (Million) Forecast, by Application 2019 & 2032
- Table 24: Global Security Robots Industry Revenue Million Forecast, by Country 2019 & 2032
- Table 25: United Arab Emirates Security Robots Industry Revenue (Million) Forecast, by Application 2019 & 2032
- Table 26: Saudi Arabia Security Robots Industry Revenue (Million) Forecast, by Application 2019 & 2032
- Table 27: South Africa Security Robots Industry Revenue (Million) Forecast, by Application 2019 & 2032
- Table 28: Rest of Middle East and Africa Security Robots Industry Revenue (Million) Forecast, by Application 2019 & 2032
- Table 29: Global Security Robots Industry Revenue Million Forecast, by Type of Robot 2019 & 2032
- Table 30: Global Security Robots Industry Revenue Million Forecast, by End User 2019 & 2032
- Table 31: Global Security Robots Industry Revenue Million Forecast, by Application 2019 & 2032
- Table 32: Global Security Robots Industry Revenue Million Forecast, by Country 2019 & 2032
- Table 33: Global Security Robots Industry Revenue Million Forecast, by Type of Robot 2019 & 2032
- Table 34: Global Security Robots Industry Revenue Million Forecast, by End User 2019 & 2032
- Table 35: Global Security Robots Industry Revenue Million Forecast, by Application 2019 & 2032
- Table 36: Global Security Robots Industry Revenue Million Forecast, by Country 2019 & 2032
- Table 37: Global Security Robots Industry Revenue Million Forecast, by Type of Robot 2019 & 2032
- Table 38: Global Security Robots Industry Revenue Million Forecast, by End User 2019 & 2032
- Table 39: Global Security Robots Industry Revenue Million Forecast, by Application 2019 & 2032
- Table 40: Global Security Robots Industry Revenue Million Forecast, by Country 2019 & 2032
- Table 41: Global Security Robots Industry Revenue Million Forecast, by Type of Robot 2019 & 2032
- Table 42: Global Security Robots Industry Revenue Million Forecast, by End User 2019 & 2032
- Table 43: Global Security Robots Industry Revenue Million Forecast, by Application 2019 & 2032
- Table 44: Global Security Robots Industry Revenue Million Forecast, by Country 2019 & 2032
- Table 45: Global Security Robots Industry Revenue Million Forecast, by Type of Robot 2019 & 2032
- Table 46: Global Security Robots Industry Revenue Million Forecast, by End User 2019 & 2032
- Table 47: Global Security Robots Industry Revenue Million Forecast, by Application 2019 & 2032
- Table 48: Global Security Robots Industry Revenue Million Forecast, by Country 2019 & 2032
- Table 49: Global Security Robots Industry Revenue Million Forecast, by Type of Robot 2019 & 2032
- Table 50: Global Security Robots Industry Revenue Million Forecast, by End User 2019 & 2032
- Table 51: Global Security Robots Industry Revenue Million Forecast, by Application 2019 & 2032
- Table 52: Global Security Robots Industry Revenue Million Forecast, by Country 2019 & 2032
Frequently Asked Questions
1. What is the projected Compound Annual Growth Rate (CAGR) of the Security Robots Industry?
The projected CAGR is approximately 13.57%.
2. Which companies are prominent players in the Security Robots Industry?
Key companies in the market include Boston Dynamics Inc, Recon Robotics Inc *List Not Exhaustive, Kongsberg Gruppen, Lockheed Martin Corporation, BAE Systems PLC, Knight Scope Inc, Aerovironment Inc, Elbit Systems Limited, Qinetiq Group PLC, SMP Robotics, Thales SA, SZ DJI Technology Co Ltd, RoboTex Inc, Northrop Grumman Corporation, Leonardo SPA, FLIR Systems Inc.
3. What are the main segments of the Security Robots Industry?
The market segments include Type of Robot, End User, Application.
4. Can you provide details about the market size?
The market size is estimated to be USD 15.70 Million as of 2022.
5. What are some drivers contributing to market growth?
Increasing Usage of Robots in Security and Surveillance Applications; Rising Safety Concerns.
6. What are the notable trends driving market growth?
Commercial End-user Industry is Expected to Hold a Significant Share.
7. Are there any restraints impacting market growth?
Rising Concerns About Privacy and Intrusion.
8. Can you provide examples of recent developments in the market?
August 2022: Hyundai Motor Group announced the launch of Boston Dynamics AI Institute. The launch aimed to make fundamental advances in AI, robotics, and intelligent machines with a USD 400 million investment. As a research-first organization, the institute will work on solving the most critical challenges facing the creation of advanced robots. Elite talent across AI, ML, robotics, computing, and engineering will develop technology for robots and use it to grow their usefulness and capabilities.
9. What pricing options are available for accessing the report?
Pricing options include single-user, multi-user, and enterprise licenses priced at USD 4750, USD 5250, and USD 8750 respectively.
10. Is the market size provided in terms of value or volume?
The market size is provided in terms of value, measured in Million.
11. Are there any specific market keywords associated with the report?
Yes, the market keyword associated with the report is "Security Robots Industry," which aids in identifying and referencing the specific market segment covered.
12. How do I determine which pricing option suits my needs best?
The pricing options vary based on user requirements and access needs. Individual users may opt for single-user licenses, while businesses requiring broader access may choose multi-user or enterprise licenses for cost-effective access to the report.
13. Are there any additional resources or data provided in the Security Robots Industry report?
While the report offers comprehensive insights, it's advisable to review the specific contents or supplementary materials provided to ascertain if additional resources or data are available.
14. How can I stay updated on further developments or reports in the Security Robots Industry?
To stay informed about further developments, trends, and reports in the Security Robots Industry, consider subscribing to industry newsletters, following relevant companies and organizations, or regularly checking reputable industry news sources and publications.
Methodology
Step 1 - Identification of Relevant Samples Size from Population Database


Step 2 - Approaches for Defining Global Market Size (Value, Volume* & Price*)

Note*: In applicable scenarios
Step 3 - Data Sources
Primary Research
- Web Analytics
- Survey Reports
- Research Institute
- Latest Research Reports
- Opinion Leaders
Secondary Research
- Annual Reports
- White Paper
- Latest Press Release
- Industry Association
- Paid Database
- Investor Presentations

Step 4 - Data Triangulation
Involves using different sources of information in order to increase the validity of a study
These sources are likely to be stakeholders in a program - participants, other researchers, program staff, other community members, and so on.
Then we put all data in single framework & apply various statistical tools to find out the dynamic on the market.
During the analysis stage, feedback from the stakeholder groups would be compared to determine areas of agreement as well as areas of divergence
