

Key Insights
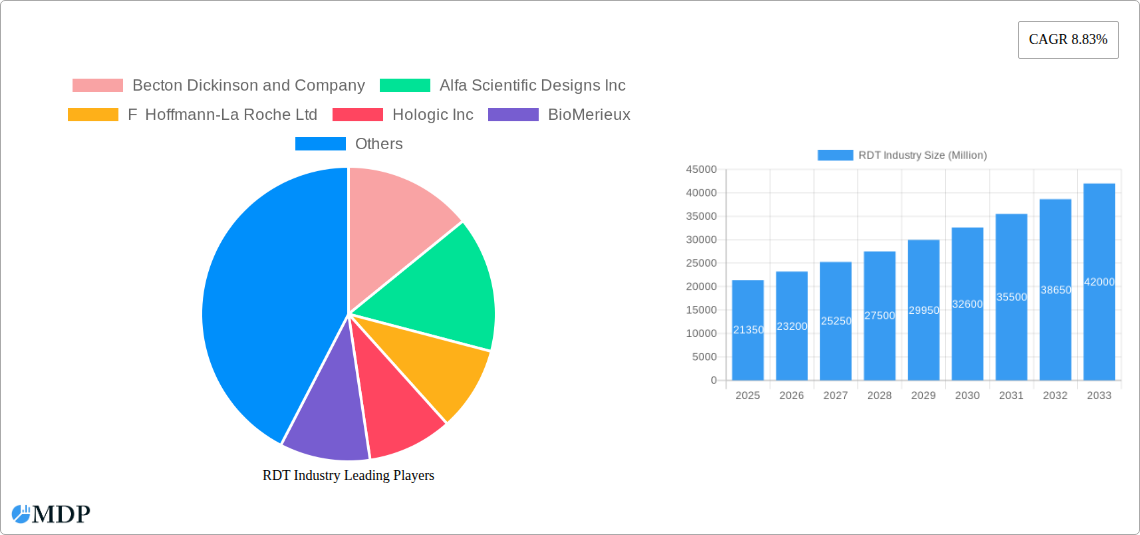
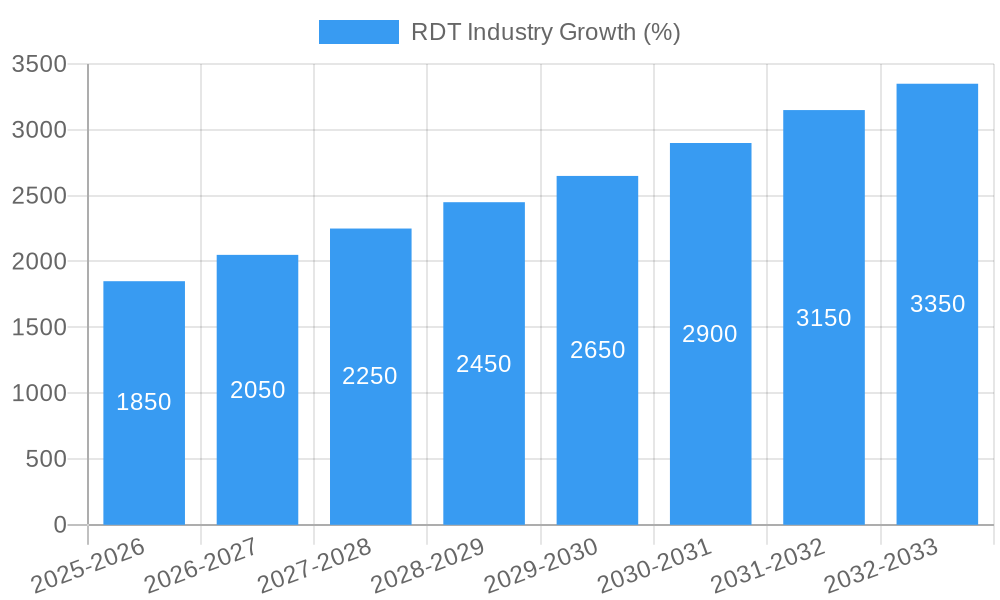
The rapid diagnostic test (RDT) market, valued at $21.35 billion in 2025, is projected to experience robust growth, driven by increasing prevalence of infectious diseases, rising demand for point-of-care diagnostics, and technological advancements in assay formats. The market's compound annual growth rate (CAGR) of 8.83% from 2025 to 2033 indicates significant expansion opportunities. Key drivers include the growing need for rapid and accurate disease detection in resource-limited settings, the increasing adoption of RDTs in home healthcare, and the ongoing development of advanced technologies like multiplex assays enabling simultaneous detection of multiple pathogens. Solid phase and lateral flow assays currently dominate the technology segment, while hospitals and clinics constitute the largest end-user segment. However, growth in homecare settings is anticipated to fuel substantial expansion in the coming years. Continued technological innovation, including the development of more sensitive and user-friendly RDTs, alongside increasing investment in research and development, will further propel market growth. Challenges such as the need for improved accuracy and sensitivity in certain assays, coupled with regulatory hurdles in some regions, pose potential restraints to market growth. However, the overall market outlook remains strongly positive, particularly considering the rising global health concerns and the crucial role of RDTs in effective disease management and control.
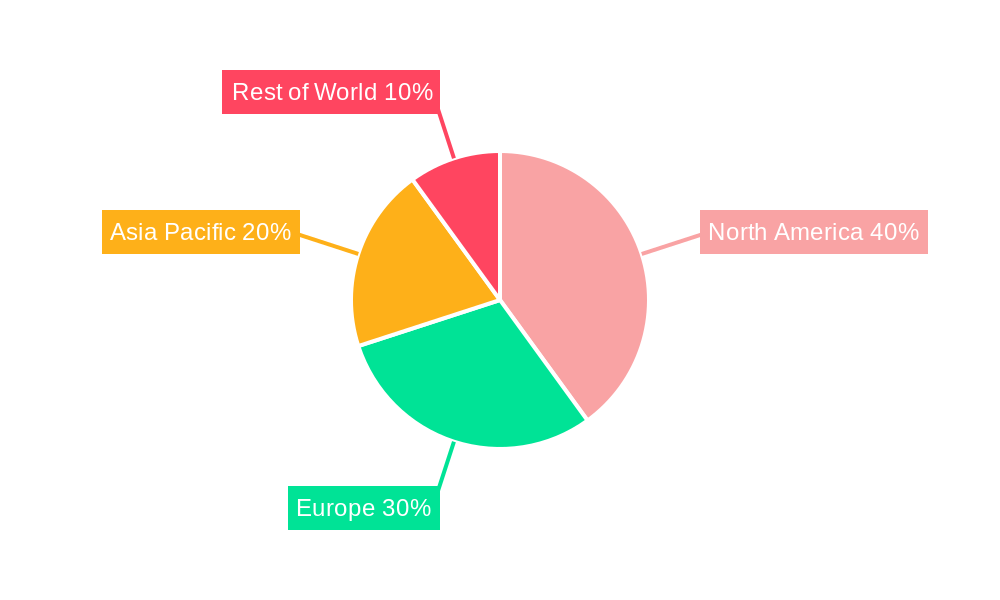
The geographical distribution of the RDT market mirrors global healthcare infrastructure and disease prevalence. North America and Europe currently hold a significant market share, driven by advanced healthcare systems and high adoption rates. However, the Asia-Pacific region, particularly countries like China and India, is poised for significant growth due to its large population, increasing healthcare expenditure, and rising incidence of infectious diseases. Latin America and the Middle East and Africa also present significant, albeit currently smaller, market opportunities. This regional disparity highlights the need for targeted strategies to enhance RDT accessibility and affordability in emerging markets. Companies like Becton Dickinson, Roche, Abbott, and Danaher are major players, constantly investing in RDT innovation and expansion across various global markets. Strategic partnerships and mergers & acquisitions are also expected to shape the market landscape in the coming years. The ongoing focus on improving the sensitivity and specificity of these tests, alongside the integration of digital technologies for enhanced data management and tracking, will drive further market evolution and growth.
Comprehensive RDT Industry Report: 2019-2033 Forecast
This in-depth report provides a comprehensive analysis of the Rapid Diagnostic Test (RDT) industry, projecting market trends and growth from 2019 to 2033. It covers market dynamics, leading players, technological advancements, and future opportunities, offering invaluable insights for stakeholders across the RDT value chain. With a base year of 2025 and a forecast period spanning 2025-2033, this report is an essential resource for informed decision-making. The market is estimated to be worth xx Million in 2025.
RDT Industry Market Dynamics & Concentration
The RDT market, valued at xx Million in 2025, exhibits a moderately concentrated landscape. Key drivers of innovation include advancements in lateral flow technology, improved point-of-care diagnostics, and growing demand for rapid infectious disease testing. Stringent regulatory frameworks, particularly concerning FDA approvals in key markets, significantly influence market access. Product substitutes, such as advanced laboratory tests, pose a competitive threat, particularly in settings with advanced healthcare infrastructure. End-user trends favor increased adoption of homecare testing and decentralized diagnostics, driving demand for user-friendly, accurate RDTs. M&A activity in the sector remains steady, with an estimated xx deals in the past five years, primarily focusing on expanding product portfolios and geographical reach. Market share is highly fragmented among key players, but major companies hold a significant portion.
- Market Concentration: Moderately concentrated, with several large players holding substantial market share.
- Innovation Drivers: Lateral flow technology advancements, point-of-care diagnostics, infectious disease testing needs.
- Regulatory Landscape: Stringent approvals (e.g., FDA) significantly impact market access.
- Product Substitutes: Advanced lab tests pose competitive pressure.
- End-User Trends: Growing homecare testing and decentralized diagnostics adoption.
- M&A Activity: xx deals in the past 5 years, focusing on portfolio expansion and geographic reach.
RDT Industry Industry Trends & Analysis
The RDT industry demonstrates robust growth, driven by the increasing prevalence of infectious diseases, rising demand for rapid diagnostics in point-of-care settings, and technological advancements enhancing test accuracy and ease of use. The global RDT market is expected to exhibit a Compound Annual Growth Rate (CAGR) of xx% during the forecast period (2025-2033). This growth is fueled by several factors: increased awareness of infectious diseases, escalating healthcare expenditure, and the growing adoption of RDTs in resource-limited settings. Technological disruptions, such as the development of multiplex assays and digital diagnostic platforms, are reshaping the competitive landscape, favoring companies with strong R&D capabilities. Consumer preferences increasingly favor convenient, at-home testing options, which is driving innovation in this space. Competitive dynamics are characterized by ongoing product launches, strategic alliances, and a push towards personalized diagnostics. Market penetration in developing economies remains relatively low, representing a significant future opportunity for market expansion.
Leading Markets & Segments in RDT Industry
The North American market holds a dominant position in the global RDT market, driven by robust healthcare infrastructure, high healthcare expenditure, and strong regulatory support. Within the technology segments, lateral flow assays maintain market leadership due to their cost-effectiveness and ease of use. Hospitals and clinics remain the largest end-user segment, although homecare testing is experiencing rapid growth.
Key Drivers:
- North America: Strong healthcare infrastructure, high expenditure, regulatory support.
- Lateral Flow Assays: Cost-effectiveness, ease of use, established market presence.
- Hospitals & Clinics: Established testing infrastructure, high patient volume.
- Homecare: Growing preference for convenient, at-home testing.
Dominance Analysis:
The dominance of North America stems from a confluence of factors, including high per capita healthcare spending, a well-established healthcare infrastructure, and stringent regulatory frameworks that encourage innovation and adoption of advanced diagnostic tools. The strong presence of major RDT players within the region further bolsters its market leadership. The dominance of lateral flow assays is attributable to their simplicity, cost-effectiveness, and widespread acceptance among healthcare providers. While hospitals and clinics remain the largest users of RDTs, the significant rise in at-home testing suggests a shift in consumer preferences and a potential expansion of the homecare segment's market share in the years to come.
RDT Industry Product Developments
Recent innovations include multiplex assays capable of detecting multiple pathogens simultaneously and improved lateral flow technology offering higher sensitivity and specificity. These advancements cater to the growing demand for rapid, accurate, and convenient diagnostics. The integration of digital technologies, such as smartphone connectivity, enhances data management and remote patient monitoring. These developments address market needs for efficient testing solutions, improved patient outcomes, and streamlined healthcare workflows.
Key Drivers of RDT Industry Growth
The RDT industry's growth is propelled by several factors: rising prevalence of infectious diseases globally, increasing demand for rapid diagnostics in point-of-care settings, advancements in lateral flow and other technologies, and expansion of healthcare infrastructure, particularly in developing nations. Favorable regulatory policies and increased investment in R&D further stimulate market expansion. For instance, the FDA's authorization of at-home COVID-19 tests greatly influenced market growth in 2023.
Challenges in the RDT Industry Market
Challenges include stringent regulatory approvals which can delay product launches, supply chain disruptions impacting raw material availability and manufacturing, and intense competition among established and emerging players resulting in price pressure. These factors can negatively influence profitability and market growth. For example, supply chain issues during the COVID-19 pandemic demonstrated the vulnerability of the industry to global events. Regulatory hurdles can significantly increase the time and cost associated with product launch.
Emerging Opportunities in RDT Industry
Long-term growth is driven by the potential of point-of-care diagnostics, development of multiplex assays, and integration of artificial intelligence in diagnostics. Strategic partnerships and market expansion into emerging economies will further accelerate RDT adoption. Breakthroughs in molecular diagnostics and nanotechnology offer opportunities for improved sensitivity and accuracy.
Leading Players in the RDT Industry Sector
- Becton Dickinson and Company
- Alfa Scientific Designs Inc
- F Hoffmann-La Roche Ltd
- Hologic Inc
- BioMerieux
- Abbott Laboratories
- Danaher Corporation
- Siemens Healthcare GmbH
- Creative Diagnostics
- ACON Laboratories Inc
- Artron Laboratories Inc
- BTNX Inc
Key Milestones in RDT Industry Industry
- February 2023: Mylab launched rapid tests for STIs (Syphilis, HCV, HIV), significantly expanding testing capabilities for these prevalent diseases.
- February 2023: Lucira Health received FDA EUA for its at-home COVID-19 & Flu test, highlighting the growing importance of convenient, at-home diagnostics.
Strategic Outlook for RDT Industry Market
The RDT market holds significant future potential, driven by technological advancements, increasing healthcare spending, and a growing global demand for rapid and accurate diagnostic solutions. Strategic partnerships, expansion into underserved markets, and a focus on innovation will be key to securing a strong market position in the years to come. The ongoing development of more sensitive and specific assays, coupled with the integration of digital technologies, promises to enhance the speed, accuracy, and accessibility of diagnostics globally.
RDT Industry Segmentation
-
1. Technology
- 1.1. Solid Phase
- 1.2. Lateral Flow
- 1.3. Agglutination Assays
- 1.4. Other Technologies
-
2. End User
- 2.1. Hospitals and Clinics
- 2.2. Homecare
- 2.3. Other End-Users
RDT Industry Segmentation By Geography
-
1. North America
- 1.1. United States
- 1.2. Canada
- 1.3. Mexico
-
2. Europe
- 2.1. Germany
- 2.2. United Kingdom
- 2.3. France
- 2.4. Italy
- 2.5. Spain
- 2.6. Rest of Europe
-
3. Asia Pacific
- 3.1. China
- 3.2. Japan
- 3.3. India
- 3.4. Australia
- 3.5. South korea
- 3.6. Rest of Asia Pacific
-
4. Middle East and Africa
- 4.1. GCC
- 4.2. South Africa
- 4.3. Rest of Middle East and Africa
-
5. South America
- 5.1. Brazil
- 5.2. Argentina
- 5.3. Rest of South America
RDT Industry REPORT HIGHLIGHTS
| Aspects | Details |
|---|---|
| Study Period | 2019-2033 |
| Base Year | 2024 |
| Estimated Year | 2025 |
| Forecast Period | 2025-2033 |
| Historical Period | 2019-2024 |
| Growth Rate | CAGR of 8.83% from 2019-2033 |
| Segmentation |
|
Table of Contents
- 1. Introduction
- 1.1. Research Scope
- 1.2. Market Segmentation
- 1.3. Research Methodology
- 1.4. Definitions and Assumptions
- 2. Executive Summary
- 2.1. Introduction
- 3. Market Dynamics
- 3.1. Introduction
- 3.2. Market Drivers
- 3.2.1 The healthcare industry is increasingly shifting towards point-of-care testing to facilitate immediate clinical decision-making
- 3.2.2 especially in emergency and outpatient settings.
- 3.3. Market Restrains
- 3.3.1 The approval process for diagnostic tests can be lengthy and complex
- 3.3.2 with stringent regulations that can hinder the rapid development and deployment of new RDTs.
- 3.4. Market Trends
- 3.4.1 The incorporation of mobile health applications and telemedicine with RDTs is growing
- 3.4.2 allowing for remote monitoring
- 3.4.3 result sharing
- 3.4.4 and improved patient management.
- 4. Market Factor Analysis
- 4.1. Porters Five Forces
- 4.2. Supply/Value Chain
- 4.3. PESTEL analysis
- 4.4. Market Entropy
- 4.5. Patent/Trademark Analysis
- 5. Global RDT Industry Analysis, Insights and Forecast, 2019-2031
- 5.1. Market Analysis, Insights and Forecast - by Technology
- 5.1.1. Solid Phase
- 5.1.2. Lateral Flow
- 5.1.3. Agglutination Assays
- 5.1.4. Other Technologies
- 5.2. Market Analysis, Insights and Forecast - by End User
- 5.2.1. Hospitals and Clinics
- 5.2.2. Homecare
- 5.2.3. Other End-Users
- 5.3. Market Analysis, Insights and Forecast - by Region
- 5.3.1. North America
- 5.3.2. Europe
- 5.3.3. Asia Pacific
- 5.3.4. Middle East and Africa
- 5.3.5. South America
- 5.1. Market Analysis, Insights and Forecast - by Technology
- 6. North America RDT Industry Analysis, Insights and Forecast, 2019-2031
- 6.1. Market Analysis, Insights and Forecast - by Technology
- 6.1.1. Solid Phase
- 6.1.2. Lateral Flow
- 6.1.3. Agglutination Assays
- 6.1.4. Other Technologies
- 6.2. Market Analysis, Insights and Forecast - by End User
- 6.2.1. Hospitals and Clinics
- 6.2.2. Homecare
- 6.2.3. Other End-Users
- 6.1. Market Analysis, Insights and Forecast - by Technology
- 7. Europe RDT Industry Analysis, Insights and Forecast, 2019-2031
- 7.1. Market Analysis, Insights and Forecast - by Technology
- 7.1.1. Solid Phase
- 7.1.2. Lateral Flow
- 7.1.3. Agglutination Assays
- 7.1.4. Other Technologies
- 7.2. Market Analysis, Insights and Forecast - by End User
- 7.2.1. Hospitals and Clinics
- 7.2.2. Homecare
- 7.2.3. Other End-Users
- 7.1. Market Analysis, Insights and Forecast - by Technology
- 8. Asia Pacific RDT Industry Analysis, Insights and Forecast, 2019-2031
- 8.1. Market Analysis, Insights and Forecast - by Technology
- 8.1.1. Solid Phase
- 8.1.2. Lateral Flow
- 8.1.3. Agglutination Assays
- 8.1.4. Other Technologies
- 8.2. Market Analysis, Insights and Forecast - by End User
- 8.2.1. Hospitals and Clinics
- 8.2.2. Homecare
- 8.2.3. Other End-Users
- 8.1. Market Analysis, Insights and Forecast - by Technology
- 9. Middle East and Africa RDT Industry Analysis, Insights and Forecast, 2019-2031
- 9.1. Market Analysis, Insights and Forecast - by Technology
- 9.1.1. Solid Phase
- 9.1.2. Lateral Flow
- 9.1.3. Agglutination Assays
- 9.1.4. Other Technologies
- 9.2. Market Analysis, Insights and Forecast - by End User
- 9.2.1. Hospitals and Clinics
- 9.2.2. Homecare
- 9.2.3. Other End-Users
- 9.1. Market Analysis, Insights and Forecast - by Technology
- 10. South America RDT Industry Analysis, Insights and Forecast, 2019-2031
- 10.1. Market Analysis, Insights and Forecast - by Technology
- 10.1.1. Solid Phase
- 10.1.2. Lateral Flow
- 10.1.3. Agglutination Assays
- 10.1.4. Other Technologies
- 10.2. Market Analysis, Insights and Forecast - by End User
- 10.2.1. Hospitals and Clinics
- 10.2.2. Homecare
- 10.2.3. Other End-Users
- 10.1. Market Analysis, Insights and Forecast - by Technology
- 11. North Americ RDT Industry Analysis, Insights and Forecast, 2019-2031
- 11.1. Market Analysis, Insights and Forecast - By Country/Sub-region
- 11.1.1 United States
- 11.1.2 Canada
- 11.1.3 Mexico
- 12. South America RDT Industry Analysis, Insights and Forecast, 2019-2031
- 12.1. Market Analysis, Insights and Forecast - By Country/Sub-region
- 12.1.1 Brazil
- 12.1.2 Mexico
- 12.1.3 Rest of South America
- 13. Europe RDT Industry Analysis, Insights and Forecast, 2019-2031
- 13.1. Market Analysis, Insights and Forecast - By Country/Sub-region
- 13.1.1 Germany
- 13.1.2 United Kingdom
- 13.1.3 France
- 13.1.4 Italy
- 13.1.5 Spain
- 13.1.6 Rest of Europe
- 14. Asia Pacific RDT Industry Analysis, Insights and Forecast, 2019-2031
- 14.1. Market Analysis, Insights and Forecast - By Country/Sub-region
- 14.1.1 China
- 14.1.2 Japan
- 14.1.3 India
- 14.1.4 South Korea
- 14.1.5 Taiwan
- 14.1.6 Australia
- 14.1.7 Rest of Asia-Pacific
- 15. MEA RDT Industry Analysis, Insights and Forecast, 2019-2031
- 15.1. Market Analysis, Insights and Forecast - By Country/Sub-region
- 15.1.1 Middle East
- 15.1.2 Africa
- 16. Competitive Analysis
- 16.1. Global Market Share Analysis 2024
- 16.2. Company Profiles
- 16.2.1 Becton Dickinson and Company
- 16.2.1.1. Overview
- 16.2.1.2. Products
- 16.2.1.3. SWOT Analysis
- 16.2.1.4. Recent Developments
- 16.2.1.5. Financials (Based on Availability)
- 16.2.2 Alfa Scientific Designs Inc
- 16.2.2.1. Overview
- 16.2.2.2. Products
- 16.2.2.3. SWOT Analysis
- 16.2.2.4. Recent Developments
- 16.2.2.5. Financials (Based on Availability)
- 16.2.3 F Hoffmann-La Roche Ltd
- 16.2.3.1. Overview
- 16.2.3.2. Products
- 16.2.3.3. SWOT Analysis
- 16.2.3.4. Recent Developments
- 16.2.3.5. Financials (Based on Availability)
- 16.2.4 Hologic Inc
- 16.2.4.1. Overview
- 16.2.4.2. Products
- 16.2.4.3. SWOT Analysis
- 16.2.4.4. Recent Developments
- 16.2.4.5. Financials (Based on Availability)
- 16.2.5 BioMerieux
- 16.2.5.1. Overview
- 16.2.5.2. Products
- 16.2.5.3. SWOT Analysis
- 16.2.5.4. Recent Developments
- 16.2.5.5. Financials (Based on Availability)
- 16.2.6 Abbott Laboratories
- 16.2.6.1. Overview
- 16.2.6.2. Products
- 16.2.6.3. SWOT Analysis
- 16.2.6.4. Recent Developments
- 16.2.6.5. Financials (Based on Availability)
- 16.2.7 Danaher Corporation
- 16.2.7.1. Overview
- 16.2.7.2. Products
- 16.2.7.3. SWOT Analysis
- 16.2.7.4. Recent Developments
- 16.2.7.5. Financials (Based on Availability)
- 16.2.8 Siemens Healthcare GmbH
- 16.2.8.1. Overview
- 16.2.8.2. Products
- 16.2.8.3. SWOT Analysis
- 16.2.8.4. Recent Developments
- 16.2.8.5. Financials (Based on Availability)
- 16.2.9 Creative Diagnostics
- 16.2.9.1. Overview
- 16.2.9.2. Products
- 16.2.9.3. SWOT Analysis
- 16.2.9.4. Recent Developments
- 16.2.9.5. Financials (Based on Availability)
- 16.2.10 ACON Laboratories Inc
- 16.2.10.1. Overview
- 16.2.10.2. Products
- 16.2.10.3. SWOT Analysis
- 16.2.10.4. Recent Developments
- 16.2.10.5. Financials (Based on Availability)
- 16.2.11 Artron Laboratories Inc
- 16.2.11.1. Overview
- 16.2.11.2. Products
- 16.2.11.3. SWOT Analysis
- 16.2.11.4. Recent Developments
- 16.2.11.5. Financials (Based on Availability)
- 16.2.12 BTNX Inc
- 16.2.12.1. Overview
- 16.2.12.2. Products
- 16.2.12.3. SWOT Analysis
- 16.2.12.4. Recent Developments
- 16.2.12.5. Financials (Based on Availability)
- 16.2.1 Becton Dickinson and Company
List of Figures
- Figure 1: Global RDT Industry Revenue Breakdown (Million, %) by Region 2024 & 2032
- Figure 2: North Americ RDT Industry Revenue (Million), by Country 2024 & 2032
- Figure 3: North Americ RDT Industry Revenue Share (%), by Country 2024 & 2032
- Figure 4: South America RDT Industry Revenue (Million), by Country 2024 & 2032
- Figure 5: South America RDT Industry Revenue Share (%), by Country 2024 & 2032
- Figure 6: Europe RDT Industry Revenue (Million), by Country 2024 & 2032
- Figure 7: Europe RDT Industry Revenue Share (%), by Country 2024 & 2032
- Figure 8: Asia Pacific RDT Industry Revenue (Million), by Country 2024 & 2032
- Figure 9: Asia Pacific RDT Industry Revenue Share (%), by Country 2024 & 2032
- Figure 10: MEA RDT Industry Revenue (Million), by Country 2024 & 2032
- Figure 11: MEA RDT Industry Revenue Share (%), by Country 2024 & 2032
- Figure 12: North America RDT Industry Revenue (Million), by Technology 2024 & 2032
- Figure 13: North America RDT Industry Revenue Share (%), by Technology 2024 & 2032
- Figure 14: North America RDT Industry Revenue (Million), by End User 2024 & 2032
- Figure 15: North America RDT Industry Revenue Share (%), by End User 2024 & 2032
- Figure 16: North America RDT Industry Revenue (Million), by Country 2024 & 2032
- Figure 17: North America RDT Industry Revenue Share (%), by Country 2024 & 2032
- Figure 18: Europe RDT Industry Revenue (Million), by Technology 2024 & 2032
- Figure 19: Europe RDT Industry Revenue Share (%), by Technology 2024 & 2032
- Figure 20: Europe RDT Industry Revenue (Million), by End User 2024 & 2032
- Figure 21: Europe RDT Industry Revenue Share (%), by End User 2024 & 2032
- Figure 22: Europe RDT Industry Revenue (Million), by Country 2024 & 2032
- Figure 23: Europe RDT Industry Revenue Share (%), by Country 2024 & 2032
- Figure 24: Asia Pacific RDT Industry Revenue (Million), by Technology 2024 & 2032
- Figure 25: Asia Pacific RDT Industry Revenue Share (%), by Technology 2024 & 2032
- Figure 26: Asia Pacific RDT Industry Revenue (Million), by End User 2024 & 2032
- Figure 27: Asia Pacific RDT Industry Revenue Share (%), by End User 2024 & 2032
- Figure 28: Asia Pacific RDT Industry Revenue (Million), by Country 2024 & 2032
- Figure 29: Asia Pacific RDT Industry Revenue Share (%), by Country 2024 & 2032
- Figure 30: Middle East and Africa RDT Industry Revenue (Million), by Technology 2024 & 2032
- Figure 31: Middle East and Africa RDT Industry Revenue Share (%), by Technology 2024 & 2032
- Figure 32: Middle East and Africa RDT Industry Revenue (Million), by End User 2024 & 2032
- Figure 33: Middle East and Africa RDT Industry Revenue Share (%), by End User 2024 & 2032
- Figure 34: Middle East and Africa RDT Industry Revenue (Million), by Country 2024 & 2032
- Figure 35: Middle East and Africa RDT Industry Revenue Share (%), by Country 2024 & 2032
- Figure 36: South America RDT Industry Revenue (Million), by Technology 2024 & 2032
- Figure 37: South America RDT Industry Revenue Share (%), by Technology 2024 & 2032
- Figure 38: South America RDT Industry Revenue (Million), by End User 2024 & 2032
- Figure 39: South America RDT Industry Revenue Share (%), by End User 2024 & 2032
- Figure 40: South America RDT Industry Revenue (Million), by Country 2024 & 2032
- Figure 41: South America RDT Industry Revenue Share (%), by Country 2024 & 2032
List of Tables
- Table 1: Global RDT Industry Revenue Million Forecast, by Region 2019 & 2032
- Table 2: Global RDT Industry Revenue Million Forecast, by Technology 2019 & 2032
- Table 3: Global RDT Industry Revenue Million Forecast, by End User 2019 & 2032
- Table 4: Global RDT Industry Revenue Million Forecast, by Region 2019 & 2032
- Table 5: Global RDT Industry Revenue Million Forecast, by Country 2019 & 2032
- Table 6: United States RDT Industry Revenue (Million) Forecast, by Application 2019 & 2032
- Table 7: Canada RDT Industry Revenue (Million) Forecast, by Application 2019 & 2032
- Table 8: Mexico RDT Industry Revenue (Million) Forecast, by Application 2019 & 2032
- Table 9: Global RDT Industry Revenue Million Forecast, by Country 2019 & 2032
- Table 10: Brazil RDT Industry Revenue (Million) Forecast, by Application 2019 & 2032
- Table 11: Mexico RDT Industry Revenue (Million) Forecast, by Application 2019 & 2032
- Table 12: Rest of South America RDT Industry Revenue (Million) Forecast, by Application 2019 & 2032
- Table 13: Global RDT Industry Revenue Million Forecast, by Country 2019 & 2032
- Table 14: Germany RDT Industry Revenue (Million) Forecast, by Application 2019 & 2032
- Table 15: United Kingdom RDT Industry Revenue (Million) Forecast, by Application 2019 & 2032
- Table 16: France RDT Industry Revenue (Million) Forecast, by Application 2019 & 2032
- Table 17: Italy RDT Industry Revenue (Million) Forecast, by Application 2019 & 2032
- Table 18: Spain RDT Industry Revenue (Million) Forecast, by Application 2019 & 2032
- Table 19: Rest of Europe RDT Industry Revenue (Million) Forecast, by Application 2019 & 2032
- Table 20: Global RDT Industry Revenue Million Forecast, by Country 2019 & 2032
- Table 21: China RDT Industry Revenue (Million) Forecast, by Application 2019 & 2032
- Table 22: Japan RDT Industry Revenue (Million) Forecast, by Application 2019 & 2032
- Table 23: India RDT Industry Revenue (Million) Forecast, by Application 2019 & 2032
- Table 24: South Korea RDT Industry Revenue (Million) Forecast, by Application 2019 & 2032
- Table 25: Taiwan RDT Industry Revenue (Million) Forecast, by Application 2019 & 2032
- Table 26: Australia RDT Industry Revenue (Million) Forecast, by Application 2019 & 2032
- Table 27: Rest of Asia-Pacific RDT Industry Revenue (Million) Forecast, by Application 2019 & 2032
- Table 28: Global RDT Industry Revenue Million Forecast, by Country 2019 & 2032
- Table 29: Middle East RDT Industry Revenue (Million) Forecast, by Application 2019 & 2032
- Table 30: Africa RDT Industry Revenue (Million) Forecast, by Application 2019 & 2032
- Table 31: Global RDT Industry Revenue Million Forecast, by Technology 2019 & 2032
- Table 32: Global RDT Industry Revenue Million Forecast, by End User 2019 & 2032
- Table 33: Global RDT Industry Revenue Million Forecast, by Country 2019 & 2032
- Table 34: United States RDT Industry Revenue (Million) Forecast, by Application 2019 & 2032
- Table 35: Canada RDT Industry Revenue (Million) Forecast, by Application 2019 & 2032
- Table 36: Mexico RDT Industry Revenue (Million) Forecast, by Application 2019 & 2032
- Table 37: Global RDT Industry Revenue Million Forecast, by Technology 2019 & 2032
- Table 38: Global RDT Industry Revenue Million Forecast, by End User 2019 & 2032
- Table 39: Global RDT Industry Revenue Million Forecast, by Country 2019 & 2032
- Table 40: Germany RDT Industry Revenue (Million) Forecast, by Application 2019 & 2032
- Table 41: United Kingdom RDT Industry Revenue (Million) Forecast, by Application 2019 & 2032
- Table 42: France RDT Industry Revenue (Million) Forecast, by Application 2019 & 2032
- Table 43: Italy RDT Industry Revenue (Million) Forecast, by Application 2019 & 2032
- Table 44: Spain RDT Industry Revenue (Million) Forecast, by Application 2019 & 2032
- Table 45: Rest of Europe RDT Industry Revenue (Million) Forecast, by Application 2019 & 2032
- Table 46: Global RDT Industry Revenue Million Forecast, by Technology 2019 & 2032
- Table 47: Global RDT Industry Revenue Million Forecast, by End User 2019 & 2032
- Table 48: Global RDT Industry Revenue Million Forecast, by Country 2019 & 2032
- Table 49: China RDT Industry Revenue (Million) Forecast, by Application 2019 & 2032
- Table 50: Japan RDT Industry Revenue (Million) Forecast, by Application 2019 & 2032
- Table 51: India RDT Industry Revenue (Million) Forecast, by Application 2019 & 2032
- Table 52: Australia RDT Industry Revenue (Million) Forecast, by Application 2019 & 2032
- Table 53: South korea RDT Industry Revenue (Million) Forecast, by Application 2019 & 2032
- Table 54: Rest of Asia Pacific RDT Industry Revenue (Million) Forecast, by Application 2019 & 2032
- Table 55: Global RDT Industry Revenue Million Forecast, by Technology 2019 & 2032
- Table 56: Global RDT Industry Revenue Million Forecast, by End User 2019 & 2032
- Table 57: Global RDT Industry Revenue Million Forecast, by Country 2019 & 2032
- Table 58: GCC RDT Industry Revenue (Million) Forecast, by Application 2019 & 2032
- Table 59: South Africa RDT Industry Revenue (Million) Forecast, by Application 2019 & 2032
- Table 60: Rest of Middle East and Africa RDT Industry Revenue (Million) Forecast, by Application 2019 & 2032
- Table 61: Global RDT Industry Revenue Million Forecast, by Technology 2019 & 2032
- Table 62: Global RDT Industry Revenue Million Forecast, by End User 2019 & 2032
- Table 63: Global RDT Industry Revenue Million Forecast, by Country 2019 & 2032
- Table 64: Brazil RDT Industry Revenue (Million) Forecast, by Application 2019 & 2032
- Table 65: Argentina RDT Industry Revenue (Million) Forecast, by Application 2019 & 2032
- Table 66: Rest of South America RDT Industry Revenue (Million) Forecast, by Application 2019 & 2032
Frequently Asked Questions
1. What is the projected Compound Annual Growth Rate (CAGR) of the RDT Industry?
The projected CAGR is approximately 8.83%.
2. Which companies are prominent players in the RDT Industry?
Key companies in the market include Becton Dickinson and Company, Alfa Scientific Designs Inc, F Hoffmann-La Roche Ltd, Hologic Inc, BioMerieux, Abbott Laboratories, Danaher Corporation, Siemens Healthcare GmbH, Creative Diagnostics, ACON Laboratories Inc, Artron Laboratories Inc, BTNX Inc.
3. What are the main segments of the RDT Industry?
The market segments include Technology, End User.
4. Can you provide details about the market size?
The market size is estimated to be USD 21.35 Million as of 2022.
5. What are some drivers contributing to market growth?
The healthcare industry is increasingly shifting towards point-of-care testing to facilitate immediate clinical decision-making. especially in emergency and outpatient settings..
6. What are the notable trends driving market growth?
The incorporation of mobile health applications and telemedicine with RDTs is growing. allowing for remote monitoring. result sharing. and improved patient management..
7. Are there any restraints impacting market growth?
The approval process for diagnostic tests can be lengthy and complex. with stringent regulations that can hinder the rapid development and deployment of new RDTs..
8. Can you provide examples of recent developments in the market?
February 2023: Mylab launched its rapid tests for sexually transmitted diseases (STIs), including Syphilis, hepatitis C virus (HCV), and human immunodeficiency virus (HIV). The rapid tests include the antibodies against HIV 1 and 2, HCV, and Treponema Pallidum (TP), for detecting HIV, HCV, and Syphilis.
9. What pricing options are available for accessing the report?
Pricing options include single-user, multi-user, and enterprise licenses priced at USD 4750, USD 5250, and USD 8750 respectively.
10. Is the market size provided in terms of value or volume?
The market size is provided in terms of value, measured in Million.
11. Are there any specific market keywords associated with the report?
Yes, the market keyword associated with the report is "RDT Industry," which aids in identifying and referencing the specific market segment covered.
12. How do I determine which pricing option suits my needs best?
The pricing options vary based on user requirements and access needs. Individual users may opt for single-user licenses, while businesses requiring broader access may choose multi-user or enterprise licenses for cost-effective access to the report.
13. Are there any additional resources or data provided in the RDT Industry report?
While the report offers comprehensive insights, it's advisable to review the specific contents or supplementary materials provided to ascertain if additional resources or data are available.
14. How can I stay updated on further developments or reports in the RDT Industry?
To stay informed about further developments, trends, and reports in the RDT Industry, consider subscribing to industry newsletters, following relevant companies and organizations, or regularly checking reputable industry news sources and publications.
Methodology
Step 1 - Identification of Relevant Samples Size from Population Database


Step 2 - Approaches for Defining Global Market Size (Value, Volume* & Price*)

Note*: In applicable scenarios
Step 3 - Data Sources
Primary Research
- Web Analytics
- Survey Reports
- Research Institute
- Latest Research Reports
- Opinion Leaders
Secondary Research
- Annual Reports
- White Paper
- Latest Press Release
- Industry Association
- Paid Database
- Investor Presentations

Step 4 - Data Triangulation
Involves using different sources of information in order to increase the validity of a study
These sources are likely to be stakeholders in a program - participants, other researchers, program staff, other community members, and so on.
Then we put all data in single framework & apply various statistical tools to find out the dynamic on the market.
During the analysis stage, feedback from the stakeholder groups would be compared to determine areas of agreement as well as areas of divergence
