

Key Insights
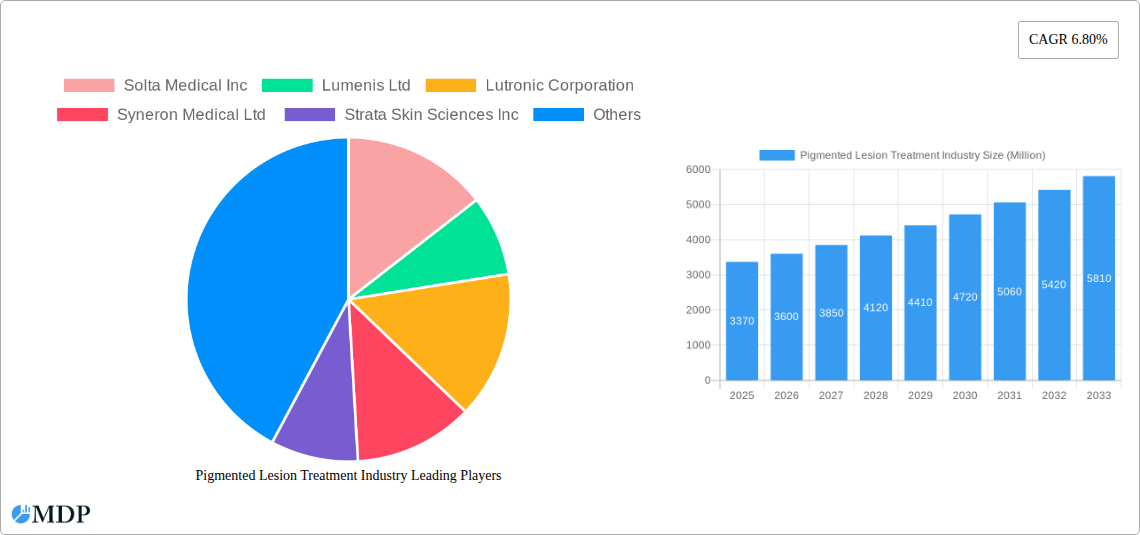
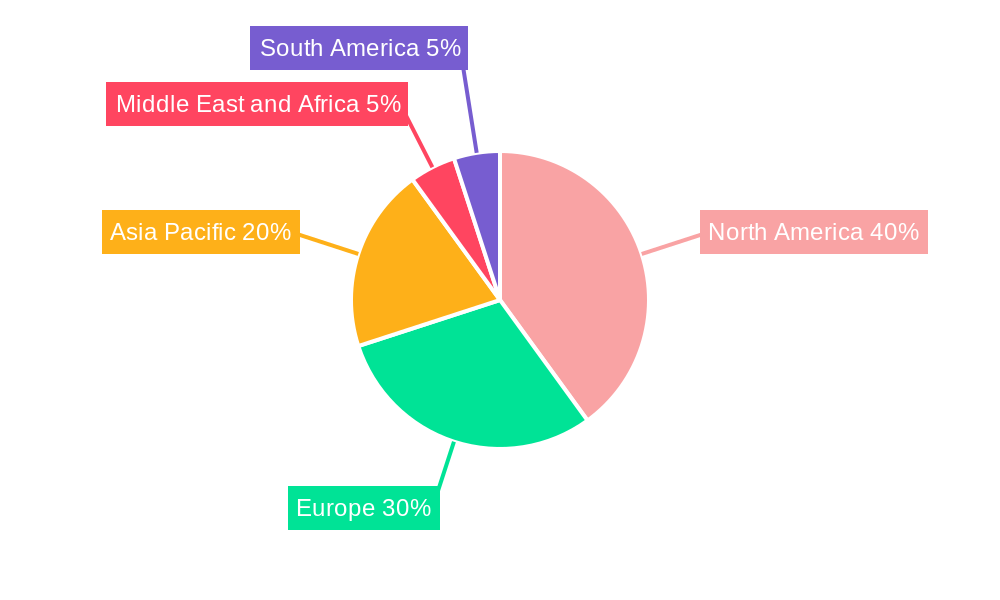
The global pigmented lesion treatment market, valued at $3.37 billion in 2025, is projected to experience robust growth, driven by rising prevalence of skin cancers and cosmetic concerns related to age spots, sunspots, and birthmarks. A compound annual growth rate (CAGR) of 6.80% from 2025 to 2033 signifies a significant expansion, with the market expected to surpass $6 billion by 2033. This growth is fueled by technological advancements in laser and energy-based devices, offering minimally invasive, effective treatment options with shorter recovery times. Increasing disposable incomes and rising awareness about aesthetic procedures across developing economies are also contributing factors. The market is segmented by product type (lasers and energy-based devices holding the largest share due to their efficacy and versatility), end-user (dermatology clinics and beauty clinics being primary revenue generators), and geography, with North America and Europe currently dominating due to high adoption rates and advanced healthcare infrastructure. However, the Asia-Pacific region is poised for significant growth owing to increasing awareness and rising healthcare spending. While high treatment costs and potential side effects pose challenges, the continued innovation in less invasive and more effective technologies is expected to mitigate these restraints.
The competitive landscape is characterized by a mix of established players like Solta Medical, Lumenis, and Cynosure, and emerging companies focusing on niche technologies. Strategic partnerships, mergers, and acquisitions are expected to shape the industry dynamics further. The market is witnessing a shift towards personalized treatments tailored to individual skin types and lesion characteristics, enhancing treatment outcomes and patient satisfaction. Continued research and development in areas like non-ablative laser technologies and improved safety protocols will further drive market expansion in the forecast period. The increasing adoption of teledermatology and remote patient monitoring may also contribute to market growth by expanding access to treatment.
Pigmented Lesion Treatment Industry Market Report: 2019-2033
This comprehensive report provides an in-depth analysis of the Pigmented Lesion Treatment industry, offering invaluable insights for stakeholders seeking to navigate this dynamic market. Covering the period 2019-2033, with a base year of 2025 and a forecast period of 2025-2033, this report unveils market dynamics, trends, leading players, and future growth potential. The global market size is projected to reach xx Million by 2033.
Pigmented Lesion Treatment Industry Market Dynamics & Concentration
The Pigmented Lesion Treatment market is characterized by moderate concentration, with key players like Solta Medical Inc, Lumenis Ltd, Lutronic Corporation, Syneron Medical Ltd, Strata Skin Sciences Inc, Cutera Inc, Lynton Lasers Ltd, Alma Lasers Ltd, and Cynosure Inc holding significant market share. However, the emergence of innovative skincare brands and technological advancements are fostering increased competition. Market share distribution amongst these leading players is estimated to be approximately xx% in 2025, with a projected shift towards a more fragmented landscape by 2033 due to increasing competition and technological breakthroughs.
Innovation is a primary driver, fueled by advancements in laser technology, radiofrequency (RF) devices, and ultrasound technologies. Stringent regulatory frameworks, particularly concerning the safety and efficacy of medical devices, influence market growth. The existence of alternative treatments, such as topical creams and chemical peels, presents a degree of substitution. Consumer preferences are shifting towards minimally invasive procedures with faster recovery times, impacting demand for specific product types. M&A activity in the industry has been moderate over the historical period (2019-2024), with an estimated xx number of deals. The forecast period (2025-2033) is anticipated to witness increased M&A activity as larger players seek to expand their portfolios and market presence.
- Market Concentration: Moderately concentrated, with top players controlling approximately xx% of the market share in 2025.
- Innovation Drivers: Advancements in laser, RF, and ultrasound technologies.
- Regulatory Landscape: Stringent regulations impacting device approvals and market entry.
- Product Substitutes: Topical creams, chemical peels.
- End-User Trends: Growing preference for minimally invasive procedures.
- M&A Activity: Moderate historical activity, with xx deals (2019-2024), and projected increase during 2025-2033.
Pigmented Lesion Treatment Industry Industry Trends & Analysis
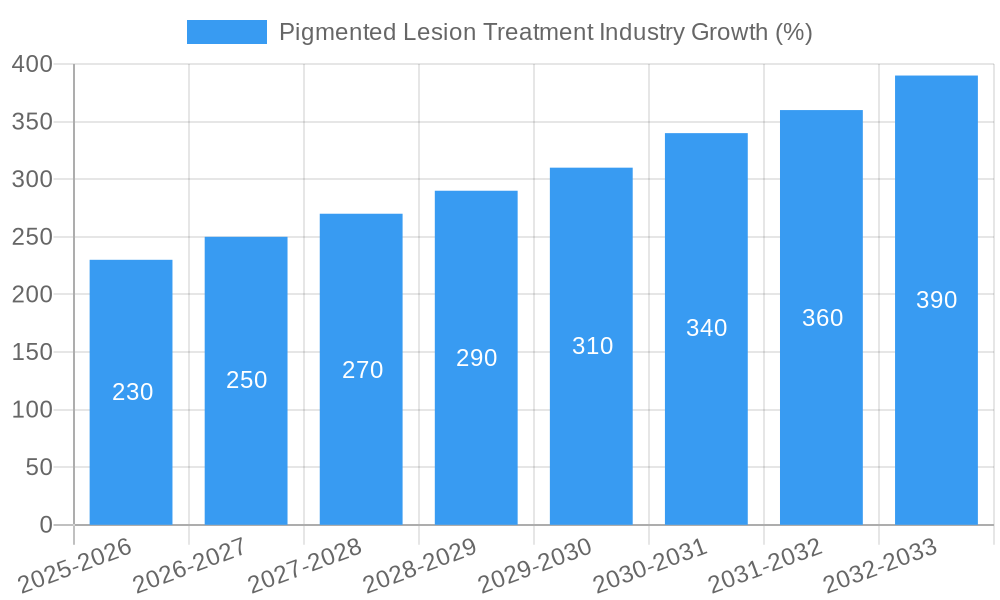
The Pigmented Lesion Treatment market exhibits significant growth potential, driven by several factors. The rising prevalence of skin conditions like age spots, sun damage, and melasma is a major catalyst. Increased consumer awareness regarding aesthetic treatments and the desire for improved skin appearance fuels demand. Technological advancements, such as the development of more precise and efficient devices, are also contributing to market expansion. The market is witnessing a considerable shift towards non-invasive and minimally invasive procedures, influencing consumer preference and driving the adoption of advanced technologies. The market is projected to grow at a CAGR of xx% during the forecast period (2025-2033), with market penetration for advanced devices increasing significantly from xx% in 2025 to xx% in 2033. Competitive dynamics are intensifying, with companies investing heavily in R&D and strategic partnerships to gain market share.
Leading Markets & Segments in Pigmented Lesion Treatment Industry
The North American region is expected to dominate the Pigmented Lesion Treatment market throughout the forecast period, driven by high disposable incomes, increased awareness about aesthetic procedures, and a robust healthcare infrastructure. Within product types, Lasers and Energy-Based Devices currently hold the largest segment share, exceeding xx Million in 2025, owing to their efficacy and versatility. Dermatology clinics represent the largest end-user segment, contributing significantly to the overall market value.
- Dominant Region: North America
- Dominant Product Type: Lasers and Energy Based Devices
- Dominant End-User: Dermatology Clinics
Key Drivers for North American Dominance:
- High disposable incomes and increased spending on aesthetic procedures.
- Strong regulatory support and advanced healthcare infrastructure.
- High prevalence of skin conditions.
Lasers and Energy Based Devices Segment Dominance:
- Efficacy and versatility in treating various pigmented lesions.
- Technological advancements leading to improved precision and safety.
Dermatology Clinics as the Largest End-User:
- High expertise and specialized equipment.
- Strong patient base and trust among consumers.
Pigmented Lesion Treatment Industry Product Developments
Recent product developments highlight a trend toward more targeted, personalized treatments. Companies are focusing on devices with improved precision, reduced downtime, and enhanced safety features. New applications, such as treating specific types of pigmentation or addressing combined skin concerns, are emerging, expanding the market potential. These advancements reflect a response to growing consumer demand for safe and effective solutions with minimal discomfort and fast recovery.
Key Drivers of Pigmented Lesion Treatment Industry Growth
The growth of the pigmented lesion treatment industry is driven by several key factors: Firstly, the increasing prevalence of age-related skin conditions and sun damage is significantly boosting the demand for effective treatments. Secondly, rising disposable incomes and increasing consumer awareness of aesthetic procedures, especially in developed economies, contribute to higher expenditure on treatments. Finally, continuous technological advancements in laser and energy-based devices provide improved outcomes, enhanced safety, and shorter treatment times, further stimulating market growth.
Challenges in the Pigmented Lesion Treatment Industry Market
The industry faces challenges including stringent regulatory approvals impacting product launches, supply chain disruptions affecting device availability, and intense competition among established players and emerging companies. These issues have resulted in variable market penetration rates across different regions and limited access to advanced treatments in certain markets, impacting the overall market growth.
Emerging Opportunities in Pigmented Lesion Treatment Industry
Significant growth opportunities exist through the development of novel treatments addressing previously unmet needs, like personalized medicine approaches and combination therapies. Strategic partnerships between device manufacturers and skincare brands (like the Heure example) offer promising avenues for market expansion. Moreover, increased penetration in emerging markets with growing middle classes presents a strong potential for market growth.
Leading Players in the Pigmented Lesion Treatment Industry Sector
- Solta Medical Inc
- Lumenis Ltd
- Lutronic Corporation
- Syneron Medical Ltd
- Strata Skin Sciences Inc
- Cutera Inc
- Lynton Lasers Ltd
- Alma Lasers Ltd
- Cynosure Inc
Key Milestones in Pigmented Lesion Treatment Industry Industry
- March 2022: Lumenis launched the Splendor X device in the UK market, expanding treatment options for pigmented lesions.
- December 2022: Heure planned a new skincare range targeting skin pigmentation, indicating a growing interest in non-invasive solutions.
Strategic Outlook for Pigmented Lesion Treatment Industry Market
The future of the pigmented lesion treatment market is bright, driven by technological innovation, growing consumer demand, and expansion into new markets. Strategic partnerships, focused R&D, and the development of personalized treatments will be crucial for companies to secure a competitive edge and capitalize on emerging opportunities within this expanding market. The focus on minimally invasive procedures, combined with increasing affordability, positions the market for substantial growth in the coming years.
Pigmented Lesion Treatment Industry Segmentation
-
1. Product Type
- 1.1. Lasers and Energy Based Devices
- 1.2. RF Devices
- 1.3. Ultrasound Devices
- 1.4. Other Product Types
-
2. End User
- 2.1. Dermatology Clinics
- 2.2. Beauty Clinics
- 2.3. Other End Users
Pigmented Lesion Treatment Industry Segmentation By Geography
-
1. North America
- 1.1. United States
- 1.2. Canada
- 1.3. Mexico
-
2. Europe
- 2.1. Germany
- 2.2. United Kingdom
- 2.3. France
- 2.4. Italy
- 2.5. Spain
- 2.6. Rest of Europe
-
3. Asia Pacific
- 3.1. China
- 3.2. Japan
- 3.3. India
- 3.4. Australia
- 3.5. South Korea
- 3.6. Rest of Asia Pacific
-
4. Middle East and Africa
- 4.1. GCC
- 4.2. South Africa
- 4.3. Rest of Middle East and Africa
-
5. South America
- 5.1. Brazil
- 5.2. Argentina
- 5.3. Rest of South America
Pigmented Lesion Treatment Industry REPORT HIGHLIGHTS
| Aspects | Details |
|---|---|
| Study Period | 2019-2033 |
| Base Year | 2024 |
| Estimated Year | 2025 |
| Forecast Period | 2025-2033 |
| Historical Period | 2019-2024 |
| Growth Rate | CAGR of 6.80% from 2019-2033 |
| Segmentation |
|
Table of Contents
- 1. Introduction
- 1.1. Research Scope
- 1.2. Market Segmentation
- 1.3. Research Methodology
- 1.4. Definitions and Assumptions
- 2. Executive Summary
- 2.1. Introduction
- 3. Market Dynamics
- 3.1. Introduction
- 3.2. Market Drivers
- 3.2.1. Rising Geriatric Population; Increasing Prevalence of Pigmentation Disorders
- 3.3. Market Restrains
- 3.3.1. Side Effects Associated with Certain Treatments
- 3.4. Market Trends
- 3.4.1. Lasers and Energy Based Devices are Expected to Witness a Significant Growth
- 4. Market Factor Analysis
- 4.1. Porters Five Forces
- 4.2. Supply/Value Chain
- 4.3. PESTEL analysis
- 4.4. Market Entropy
- 4.5. Patent/Trademark Analysis
- 5. Global Pigmented Lesion Treatment Industry Analysis, Insights and Forecast, 2019-2031
- 5.1. Market Analysis, Insights and Forecast - by Product Type
- 5.1.1. Lasers and Energy Based Devices
- 5.1.2. RF Devices
- 5.1.3. Ultrasound Devices
- 5.1.4. Other Product Types
- 5.2. Market Analysis, Insights and Forecast - by End User
- 5.2.1. Dermatology Clinics
- 5.2.2. Beauty Clinics
- 5.2.3. Other End Users
- 5.3. Market Analysis, Insights and Forecast - by Region
- 5.3.1. North America
- 5.3.2. Europe
- 5.3.3. Asia Pacific
- 5.3.4. Middle East and Africa
- 5.3.5. South America
- 5.1. Market Analysis, Insights and Forecast - by Product Type
- 6. North America Pigmented Lesion Treatment Industry Analysis, Insights and Forecast, 2019-2031
- 6.1. Market Analysis, Insights and Forecast - by Product Type
- 6.1.1. Lasers and Energy Based Devices
- 6.1.2. RF Devices
- 6.1.3. Ultrasound Devices
- 6.1.4. Other Product Types
- 6.2. Market Analysis, Insights and Forecast - by End User
- 6.2.1. Dermatology Clinics
- 6.2.2. Beauty Clinics
- 6.2.3. Other End Users
- 6.1. Market Analysis, Insights and Forecast - by Product Type
- 7. Europe Pigmented Lesion Treatment Industry Analysis, Insights and Forecast, 2019-2031
- 7.1. Market Analysis, Insights and Forecast - by Product Type
- 7.1.1. Lasers and Energy Based Devices
- 7.1.2. RF Devices
- 7.1.3. Ultrasound Devices
- 7.1.4. Other Product Types
- 7.2. Market Analysis, Insights and Forecast - by End User
- 7.2.1. Dermatology Clinics
- 7.2.2. Beauty Clinics
- 7.2.3. Other End Users
- 7.1. Market Analysis, Insights and Forecast - by Product Type
- 8. Asia Pacific Pigmented Lesion Treatment Industry Analysis, Insights and Forecast, 2019-2031
- 8.1. Market Analysis, Insights and Forecast - by Product Type
- 8.1.1. Lasers and Energy Based Devices
- 8.1.2. RF Devices
- 8.1.3. Ultrasound Devices
- 8.1.4. Other Product Types
- 8.2. Market Analysis, Insights and Forecast - by End User
- 8.2.1. Dermatology Clinics
- 8.2.2. Beauty Clinics
- 8.2.3. Other End Users
- 8.1. Market Analysis, Insights and Forecast - by Product Type
- 9. Middle East and Africa Pigmented Lesion Treatment Industry Analysis, Insights and Forecast, 2019-2031
- 9.1. Market Analysis, Insights and Forecast - by Product Type
- 9.1.1. Lasers and Energy Based Devices
- 9.1.2. RF Devices
- 9.1.3. Ultrasound Devices
- 9.1.4. Other Product Types
- 9.2. Market Analysis, Insights and Forecast - by End User
- 9.2.1. Dermatology Clinics
- 9.2.2. Beauty Clinics
- 9.2.3. Other End Users
- 9.1. Market Analysis, Insights and Forecast - by Product Type
- 10. South America Pigmented Lesion Treatment Industry Analysis, Insights and Forecast, 2019-2031
- 10.1. Market Analysis, Insights and Forecast - by Product Type
- 10.1.1. Lasers and Energy Based Devices
- 10.1.2. RF Devices
- 10.1.3. Ultrasound Devices
- 10.1.4. Other Product Types
- 10.2. Market Analysis, Insights and Forecast - by End User
- 10.2.1. Dermatology Clinics
- 10.2.2. Beauty Clinics
- 10.2.3. Other End Users
- 10.1. Market Analysis, Insights and Forecast - by Product Type
- 11. North America Pigmented Lesion Treatment Industry Analysis, Insights and Forecast, 2019-2031
- 11.1. Market Analysis, Insights and Forecast - By Country/Sub-region
- 11.1.1 United States
- 11.1.2 Canada
- 11.1.3 Mexico
- 12. Europe Pigmented Lesion Treatment Industry Analysis, Insights and Forecast, 2019-2031
- 12.1. Market Analysis, Insights and Forecast - By Country/Sub-region
- 12.1.1 Germany
- 12.1.2 United Kingdom
- 12.1.3 France
- 12.1.4 Italy
- 12.1.5 Spain
- 12.1.6 Rest of Europe
- 13. Asia Pacific Pigmented Lesion Treatment Industry Analysis, Insights and Forecast, 2019-2031
- 13.1. Market Analysis, Insights and Forecast - By Country/Sub-region
- 13.1.1 China
- 13.1.2 Japan
- 13.1.3 India
- 13.1.4 Australia
- 13.1.5 South Korea
- 13.1.6 Rest of Asia Pacific
- 14. Middle East and Africa Pigmented Lesion Treatment Industry Analysis, Insights and Forecast, 2019-2031
- 14.1. Market Analysis, Insights and Forecast - By Country/Sub-region
- 14.1.1 GCC
- 14.1.2 South Africa
- 14.1.3 Rest of Middle East and Africa
- 15. South America Pigmented Lesion Treatment Industry Analysis, Insights and Forecast, 2019-2031
- 15.1. Market Analysis, Insights and Forecast - By Country/Sub-region
- 15.1.1 Brazil
- 15.1.2 Argentina
- 15.1.3 Rest of South America
- 16. Competitive Analysis
- 16.1. Global Market Share Analysis 2024
- 16.2. Company Profiles
- 16.2.1 Solta Medical Inc
- 16.2.1.1. Overview
- 16.2.1.2. Products
- 16.2.1.3. SWOT Analysis
- 16.2.1.4. Recent Developments
- 16.2.1.5. Financials (Based on Availability)
- 16.2.2 Lumenis Ltd
- 16.2.2.1. Overview
- 16.2.2.2. Products
- 16.2.2.3. SWOT Analysis
- 16.2.2.4. Recent Developments
- 16.2.2.5. Financials (Based on Availability)
- 16.2.3 Lutronic Corporation
- 16.2.3.1. Overview
- 16.2.3.2. Products
- 16.2.3.3. SWOT Analysis
- 16.2.3.4. Recent Developments
- 16.2.3.5. Financials (Based on Availability)
- 16.2.4 Syneron Medical Ltd
- 16.2.4.1. Overview
- 16.2.4.2. Products
- 16.2.4.3. SWOT Analysis
- 16.2.4.4. Recent Developments
- 16.2.4.5. Financials (Based on Availability)
- 16.2.5 Strata Skin Sciences Inc
- 16.2.5.1. Overview
- 16.2.5.2. Products
- 16.2.5.3. SWOT Analysis
- 16.2.5.4. Recent Developments
- 16.2.5.5. Financials (Based on Availability)
- 16.2.6 Cutera Inc
- 16.2.6.1. Overview
- 16.2.6.2. Products
- 16.2.6.3. SWOT Analysis
- 16.2.6.4. Recent Developments
- 16.2.6.5. Financials (Based on Availability)
- 16.2.7 Lynton Lasers Ltd
- 16.2.7.1. Overview
- 16.2.7.2. Products
- 16.2.7.3. SWOT Analysis
- 16.2.7.4. Recent Developments
- 16.2.7.5. Financials (Based on Availability)
- 16.2.8 Alma Lasers Ltd
- 16.2.8.1. Overview
- 16.2.8.2. Products
- 16.2.8.3. SWOT Analysis
- 16.2.8.4. Recent Developments
- 16.2.8.5. Financials (Based on Availability)
- 16.2.9 Cynosure Inc
- 16.2.9.1. Overview
- 16.2.9.2. Products
- 16.2.9.3. SWOT Analysis
- 16.2.9.4. Recent Developments
- 16.2.9.5. Financials (Based on Availability)
- 16.2.1 Solta Medical Inc
List of Figures
- Figure 1: Global Pigmented Lesion Treatment Industry Revenue Breakdown (Million, %) by Region 2024 & 2032
- Figure 2: Global Pigmented Lesion Treatment Industry Volume Breakdown (K Unit, %) by Region 2024 & 2032
- Figure 3: North America Pigmented Lesion Treatment Industry Revenue (Million), by Country 2024 & 2032
- Figure 4: North America Pigmented Lesion Treatment Industry Volume (K Unit), by Country 2024 & 2032
- Figure 5: North America Pigmented Lesion Treatment Industry Revenue Share (%), by Country 2024 & 2032
- Figure 6: North America Pigmented Lesion Treatment Industry Volume Share (%), by Country 2024 & 2032
- Figure 7: Europe Pigmented Lesion Treatment Industry Revenue (Million), by Country 2024 & 2032
- Figure 8: Europe Pigmented Lesion Treatment Industry Volume (K Unit), by Country 2024 & 2032
- Figure 9: Europe Pigmented Lesion Treatment Industry Revenue Share (%), by Country 2024 & 2032
- Figure 10: Europe Pigmented Lesion Treatment Industry Volume Share (%), by Country 2024 & 2032
- Figure 11: Asia Pacific Pigmented Lesion Treatment Industry Revenue (Million), by Country 2024 & 2032
- Figure 12: Asia Pacific Pigmented Lesion Treatment Industry Volume (K Unit), by Country 2024 & 2032
- Figure 13: Asia Pacific Pigmented Lesion Treatment Industry Revenue Share (%), by Country 2024 & 2032
- Figure 14: Asia Pacific Pigmented Lesion Treatment Industry Volume Share (%), by Country 2024 & 2032
- Figure 15: Middle East and Africa Pigmented Lesion Treatment Industry Revenue (Million), by Country 2024 & 2032
- Figure 16: Middle East and Africa Pigmented Lesion Treatment Industry Volume (K Unit), by Country 2024 & 2032
- Figure 17: Middle East and Africa Pigmented Lesion Treatment Industry Revenue Share (%), by Country 2024 & 2032
- Figure 18: Middle East and Africa Pigmented Lesion Treatment Industry Volume Share (%), by Country 2024 & 2032
- Figure 19: South America Pigmented Lesion Treatment Industry Revenue (Million), by Country 2024 & 2032
- Figure 20: South America Pigmented Lesion Treatment Industry Volume (K Unit), by Country 2024 & 2032
- Figure 21: South America Pigmented Lesion Treatment Industry Revenue Share (%), by Country 2024 & 2032
- Figure 22: South America Pigmented Lesion Treatment Industry Volume Share (%), by Country 2024 & 2032
- Figure 23: North America Pigmented Lesion Treatment Industry Revenue (Million), by Product Type 2024 & 2032
- Figure 24: North America Pigmented Lesion Treatment Industry Volume (K Unit), by Product Type 2024 & 2032
- Figure 25: North America Pigmented Lesion Treatment Industry Revenue Share (%), by Product Type 2024 & 2032
- Figure 26: North America Pigmented Lesion Treatment Industry Volume Share (%), by Product Type 2024 & 2032
- Figure 27: North America Pigmented Lesion Treatment Industry Revenue (Million), by End User 2024 & 2032
- Figure 28: North America Pigmented Lesion Treatment Industry Volume (K Unit), by End User 2024 & 2032
- Figure 29: North America Pigmented Lesion Treatment Industry Revenue Share (%), by End User 2024 & 2032
- Figure 30: North America Pigmented Lesion Treatment Industry Volume Share (%), by End User 2024 & 2032
- Figure 31: North America Pigmented Lesion Treatment Industry Revenue (Million), by Country 2024 & 2032
- Figure 32: North America Pigmented Lesion Treatment Industry Volume (K Unit), by Country 2024 & 2032
- Figure 33: North America Pigmented Lesion Treatment Industry Revenue Share (%), by Country 2024 & 2032
- Figure 34: North America Pigmented Lesion Treatment Industry Volume Share (%), by Country 2024 & 2032
- Figure 35: Europe Pigmented Lesion Treatment Industry Revenue (Million), by Product Type 2024 & 2032
- Figure 36: Europe Pigmented Lesion Treatment Industry Volume (K Unit), by Product Type 2024 & 2032
- Figure 37: Europe Pigmented Lesion Treatment Industry Revenue Share (%), by Product Type 2024 & 2032
- Figure 38: Europe Pigmented Lesion Treatment Industry Volume Share (%), by Product Type 2024 & 2032
- Figure 39: Europe Pigmented Lesion Treatment Industry Revenue (Million), by End User 2024 & 2032
- Figure 40: Europe Pigmented Lesion Treatment Industry Volume (K Unit), by End User 2024 & 2032
- Figure 41: Europe Pigmented Lesion Treatment Industry Revenue Share (%), by End User 2024 & 2032
- Figure 42: Europe Pigmented Lesion Treatment Industry Volume Share (%), by End User 2024 & 2032
- Figure 43: Europe Pigmented Lesion Treatment Industry Revenue (Million), by Country 2024 & 2032
- Figure 44: Europe Pigmented Lesion Treatment Industry Volume (K Unit), by Country 2024 & 2032
- Figure 45: Europe Pigmented Lesion Treatment Industry Revenue Share (%), by Country 2024 & 2032
- Figure 46: Europe Pigmented Lesion Treatment Industry Volume Share (%), by Country 2024 & 2032
- Figure 47: Asia Pacific Pigmented Lesion Treatment Industry Revenue (Million), by Product Type 2024 & 2032
- Figure 48: Asia Pacific Pigmented Lesion Treatment Industry Volume (K Unit), by Product Type 2024 & 2032
- Figure 49: Asia Pacific Pigmented Lesion Treatment Industry Revenue Share (%), by Product Type 2024 & 2032
- Figure 50: Asia Pacific Pigmented Lesion Treatment Industry Volume Share (%), by Product Type 2024 & 2032
- Figure 51: Asia Pacific Pigmented Lesion Treatment Industry Revenue (Million), by End User 2024 & 2032
- Figure 52: Asia Pacific Pigmented Lesion Treatment Industry Volume (K Unit), by End User 2024 & 2032
- Figure 53: Asia Pacific Pigmented Lesion Treatment Industry Revenue Share (%), by End User 2024 & 2032
- Figure 54: Asia Pacific Pigmented Lesion Treatment Industry Volume Share (%), by End User 2024 & 2032
- Figure 55: Asia Pacific Pigmented Lesion Treatment Industry Revenue (Million), by Country 2024 & 2032
- Figure 56: Asia Pacific Pigmented Lesion Treatment Industry Volume (K Unit), by Country 2024 & 2032
- Figure 57: Asia Pacific Pigmented Lesion Treatment Industry Revenue Share (%), by Country 2024 & 2032
- Figure 58: Asia Pacific Pigmented Lesion Treatment Industry Volume Share (%), by Country 2024 & 2032
- Figure 59: Middle East and Africa Pigmented Lesion Treatment Industry Revenue (Million), by Product Type 2024 & 2032
- Figure 60: Middle East and Africa Pigmented Lesion Treatment Industry Volume (K Unit), by Product Type 2024 & 2032
- Figure 61: Middle East and Africa Pigmented Lesion Treatment Industry Revenue Share (%), by Product Type 2024 & 2032
- Figure 62: Middle East and Africa Pigmented Lesion Treatment Industry Volume Share (%), by Product Type 2024 & 2032
- Figure 63: Middle East and Africa Pigmented Lesion Treatment Industry Revenue (Million), by End User 2024 & 2032
- Figure 64: Middle East and Africa Pigmented Lesion Treatment Industry Volume (K Unit), by End User 2024 & 2032
- Figure 65: Middle East and Africa Pigmented Lesion Treatment Industry Revenue Share (%), by End User 2024 & 2032
- Figure 66: Middle East and Africa Pigmented Lesion Treatment Industry Volume Share (%), by End User 2024 & 2032
- Figure 67: Middle East and Africa Pigmented Lesion Treatment Industry Revenue (Million), by Country 2024 & 2032
- Figure 68: Middle East and Africa Pigmented Lesion Treatment Industry Volume (K Unit), by Country 2024 & 2032
- Figure 69: Middle East and Africa Pigmented Lesion Treatment Industry Revenue Share (%), by Country 2024 & 2032
- Figure 70: Middle East and Africa Pigmented Lesion Treatment Industry Volume Share (%), by Country 2024 & 2032
- Figure 71: South America Pigmented Lesion Treatment Industry Revenue (Million), by Product Type 2024 & 2032
- Figure 72: South America Pigmented Lesion Treatment Industry Volume (K Unit), by Product Type 2024 & 2032
- Figure 73: South America Pigmented Lesion Treatment Industry Revenue Share (%), by Product Type 2024 & 2032
- Figure 74: South America Pigmented Lesion Treatment Industry Volume Share (%), by Product Type 2024 & 2032
- Figure 75: South America Pigmented Lesion Treatment Industry Revenue (Million), by End User 2024 & 2032
- Figure 76: South America Pigmented Lesion Treatment Industry Volume (K Unit), by End User 2024 & 2032
- Figure 77: South America Pigmented Lesion Treatment Industry Revenue Share (%), by End User 2024 & 2032
- Figure 78: South America Pigmented Lesion Treatment Industry Volume Share (%), by End User 2024 & 2032
- Figure 79: South America Pigmented Lesion Treatment Industry Revenue (Million), by Country 2024 & 2032
- Figure 80: South America Pigmented Lesion Treatment Industry Volume (K Unit), by Country 2024 & 2032
- Figure 81: South America Pigmented Lesion Treatment Industry Revenue Share (%), by Country 2024 & 2032
- Figure 82: South America Pigmented Lesion Treatment Industry Volume Share (%), by Country 2024 & 2032
List of Tables
- Table 1: Global Pigmented Lesion Treatment Industry Revenue Million Forecast, by Region 2019 & 2032
- Table 2: Global Pigmented Lesion Treatment Industry Volume K Unit Forecast, by Region 2019 & 2032
- Table 3: Global Pigmented Lesion Treatment Industry Revenue Million Forecast, by Product Type 2019 & 2032
- Table 4: Global Pigmented Lesion Treatment Industry Volume K Unit Forecast, by Product Type 2019 & 2032
- Table 5: Global Pigmented Lesion Treatment Industry Revenue Million Forecast, by End User 2019 & 2032
- Table 6: Global Pigmented Lesion Treatment Industry Volume K Unit Forecast, by End User 2019 & 2032
- Table 7: Global Pigmented Lesion Treatment Industry Revenue Million Forecast, by Region 2019 & 2032
- Table 8: Global Pigmented Lesion Treatment Industry Volume K Unit Forecast, by Region 2019 & 2032
- Table 9: Global Pigmented Lesion Treatment Industry Revenue Million Forecast, by Country 2019 & 2032
- Table 10: Global Pigmented Lesion Treatment Industry Volume K Unit Forecast, by Country 2019 & 2032
- Table 11: United States Pigmented Lesion Treatment Industry Revenue (Million) Forecast, by Application 2019 & 2032
- Table 12: United States Pigmented Lesion Treatment Industry Volume (K Unit) Forecast, by Application 2019 & 2032
- Table 13: Canada Pigmented Lesion Treatment Industry Revenue (Million) Forecast, by Application 2019 & 2032
- Table 14: Canada Pigmented Lesion Treatment Industry Volume (K Unit) Forecast, by Application 2019 & 2032
- Table 15: Mexico Pigmented Lesion Treatment Industry Revenue (Million) Forecast, by Application 2019 & 2032
- Table 16: Mexico Pigmented Lesion Treatment Industry Volume (K Unit) Forecast, by Application 2019 & 2032
- Table 17: Global Pigmented Lesion Treatment Industry Revenue Million Forecast, by Country 2019 & 2032
- Table 18: Global Pigmented Lesion Treatment Industry Volume K Unit Forecast, by Country 2019 & 2032
- Table 19: Germany Pigmented Lesion Treatment Industry Revenue (Million) Forecast, by Application 2019 & 2032
- Table 20: Germany Pigmented Lesion Treatment Industry Volume (K Unit) Forecast, by Application 2019 & 2032
- Table 21: United Kingdom Pigmented Lesion Treatment Industry Revenue (Million) Forecast, by Application 2019 & 2032
- Table 22: United Kingdom Pigmented Lesion Treatment Industry Volume (K Unit) Forecast, by Application 2019 & 2032
- Table 23: France Pigmented Lesion Treatment Industry Revenue (Million) Forecast, by Application 2019 & 2032
- Table 24: France Pigmented Lesion Treatment Industry Volume (K Unit) Forecast, by Application 2019 & 2032
- Table 25: Italy Pigmented Lesion Treatment Industry Revenue (Million) Forecast, by Application 2019 & 2032
- Table 26: Italy Pigmented Lesion Treatment Industry Volume (K Unit) Forecast, by Application 2019 & 2032
- Table 27: Spain Pigmented Lesion Treatment Industry Revenue (Million) Forecast, by Application 2019 & 2032
- Table 28: Spain Pigmented Lesion Treatment Industry Volume (K Unit) Forecast, by Application 2019 & 2032
- Table 29: Rest of Europe Pigmented Lesion Treatment Industry Revenue (Million) Forecast, by Application 2019 & 2032
- Table 30: Rest of Europe Pigmented Lesion Treatment Industry Volume (K Unit) Forecast, by Application 2019 & 2032
- Table 31: Global Pigmented Lesion Treatment Industry Revenue Million Forecast, by Country 2019 & 2032
- Table 32: Global Pigmented Lesion Treatment Industry Volume K Unit Forecast, by Country 2019 & 2032
- Table 33: China Pigmented Lesion Treatment Industry Revenue (Million) Forecast, by Application 2019 & 2032
- Table 34: China Pigmented Lesion Treatment Industry Volume (K Unit) Forecast, by Application 2019 & 2032
- Table 35: Japan Pigmented Lesion Treatment Industry Revenue (Million) Forecast, by Application 2019 & 2032
- Table 36: Japan Pigmented Lesion Treatment Industry Volume (K Unit) Forecast, by Application 2019 & 2032
- Table 37: India Pigmented Lesion Treatment Industry Revenue (Million) Forecast, by Application 2019 & 2032
- Table 38: India Pigmented Lesion Treatment Industry Volume (K Unit) Forecast, by Application 2019 & 2032
- Table 39: Australia Pigmented Lesion Treatment Industry Revenue (Million) Forecast, by Application 2019 & 2032
- Table 40: Australia Pigmented Lesion Treatment Industry Volume (K Unit) Forecast, by Application 2019 & 2032
- Table 41: South Korea Pigmented Lesion Treatment Industry Revenue (Million) Forecast, by Application 2019 & 2032
- Table 42: South Korea Pigmented Lesion Treatment Industry Volume (K Unit) Forecast, by Application 2019 & 2032
- Table 43: Rest of Asia Pacific Pigmented Lesion Treatment Industry Revenue (Million) Forecast, by Application 2019 & 2032
- Table 44: Rest of Asia Pacific Pigmented Lesion Treatment Industry Volume (K Unit) Forecast, by Application 2019 & 2032
- Table 45: Global Pigmented Lesion Treatment Industry Revenue Million Forecast, by Country 2019 & 2032
- Table 46: Global Pigmented Lesion Treatment Industry Volume K Unit Forecast, by Country 2019 & 2032
- Table 47: GCC Pigmented Lesion Treatment Industry Revenue (Million) Forecast, by Application 2019 & 2032
- Table 48: GCC Pigmented Lesion Treatment Industry Volume (K Unit) Forecast, by Application 2019 & 2032
- Table 49: South Africa Pigmented Lesion Treatment Industry Revenue (Million) Forecast, by Application 2019 & 2032
- Table 50: South Africa Pigmented Lesion Treatment Industry Volume (K Unit) Forecast, by Application 2019 & 2032
- Table 51: Rest of Middle East and Africa Pigmented Lesion Treatment Industry Revenue (Million) Forecast, by Application 2019 & 2032
- Table 52: Rest of Middle East and Africa Pigmented Lesion Treatment Industry Volume (K Unit) Forecast, by Application 2019 & 2032
- Table 53: Global Pigmented Lesion Treatment Industry Revenue Million Forecast, by Country 2019 & 2032
- Table 54: Global Pigmented Lesion Treatment Industry Volume K Unit Forecast, by Country 2019 & 2032
- Table 55: Brazil Pigmented Lesion Treatment Industry Revenue (Million) Forecast, by Application 2019 & 2032
- Table 56: Brazil Pigmented Lesion Treatment Industry Volume (K Unit) Forecast, by Application 2019 & 2032
- Table 57: Argentina Pigmented Lesion Treatment Industry Revenue (Million) Forecast, by Application 2019 & 2032
- Table 58: Argentina Pigmented Lesion Treatment Industry Volume (K Unit) Forecast, by Application 2019 & 2032
- Table 59: Rest of South America Pigmented Lesion Treatment Industry Revenue (Million) Forecast, by Application 2019 & 2032
- Table 60: Rest of South America Pigmented Lesion Treatment Industry Volume (K Unit) Forecast, by Application 2019 & 2032
- Table 61: Global Pigmented Lesion Treatment Industry Revenue Million Forecast, by Product Type 2019 & 2032
- Table 62: Global Pigmented Lesion Treatment Industry Volume K Unit Forecast, by Product Type 2019 & 2032
- Table 63: Global Pigmented Lesion Treatment Industry Revenue Million Forecast, by End User 2019 & 2032
- Table 64: Global Pigmented Lesion Treatment Industry Volume K Unit Forecast, by End User 2019 & 2032
- Table 65: Global Pigmented Lesion Treatment Industry Revenue Million Forecast, by Country 2019 & 2032
- Table 66: Global Pigmented Lesion Treatment Industry Volume K Unit Forecast, by Country 2019 & 2032
- Table 67: United States Pigmented Lesion Treatment Industry Revenue (Million) Forecast, by Application 2019 & 2032
- Table 68: United States Pigmented Lesion Treatment Industry Volume (K Unit) Forecast, by Application 2019 & 2032
- Table 69: Canada Pigmented Lesion Treatment Industry Revenue (Million) Forecast, by Application 2019 & 2032
- Table 70: Canada Pigmented Lesion Treatment Industry Volume (K Unit) Forecast, by Application 2019 & 2032
- Table 71: Mexico Pigmented Lesion Treatment Industry Revenue (Million) Forecast, by Application 2019 & 2032
- Table 72: Mexico Pigmented Lesion Treatment Industry Volume (K Unit) Forecast, by Application 2019 & 2032
- Table 73: Global Pigmented Lesion Treatment Industry Revenue Million Forecast, by Product Type 2019 & 2032
- Table 74: Global Pigmented Lesion Treatment Industry Volume K Unit Forecast, by Product Type 2019 & 2032
- Table 75: Global Pigmented Lesion Treatment Industry Revenue Million Forecast, by End User 2019 & 2032
- Table 76: Global Pigmented Lesion Treatment Industry Volume K Unit Forecast, by End User 2019 & 2032
- Table 77: Global Pigmented Lesion Treatment Industry Revenue Million Forecast, by Country 2019 & 2032
- Table 78: Global Pigmented Lesion Treatment Industry Volume K Unit Forecast, by Country 2019 & 2032
- Table 79: Germany Pigmented Lesion Treatment Industry Revenue (Million) Forecast, by Application 2019 & 2032
- Table 80: Germany Pigmented Lesion Treatment Industry Volume (K Unit) Forecast, by Application 2019 & 2032
- Table 81: United Kingdom Pigmented Lesion Treatment Industry Revenue (Million) Forecast, by Application 2019 & 2032
- Table 82: United Kingdom Pigmented Lesion Treatment Industry Volume (K Unit) Forecast, by Application 2019 & 2032
- Table 83: France Pigmented Lesion Treatment Industry Revenue (Million) Forecast, by Application 2019 & 2032
- Table 84: France Pigmented Lesion Treatment Industry Volume (K Unit) Forecast, by Application 2019 & 2032
- Table 85: Italy Pigmented Lesion Treatment Industry Revenue (Million) Forecast, by Application 2019 & 2032
- Table 86: Italy Pigmented Lesion Treatment Industry Volume (K Unit) Forecast, by Application 2019 & 2032
- Table 87: Spain Pigmented Lesion Treatment Industry Revenue (Million) Forecast, by Application 2019 & 2032
- Table 88: Spain Pigmented Lesion Treatment Industry Volume (K Unit) Forecast, by Application 2019 & 2032
- Table 89: Rest of Europe Pigmented Lesion Treatment Industry Revenue (Million) Forecast, by Application 2019 & 2032
- Table 90: Rest of Europe Pigmented Lesion Treatment Industry Volume (K Unit) Forecast, by Application 2019 & 2032
- Table 91: Global Pigmented Lesion Treatment Industry Revenue Million Forecast, by Product Type 2019 & 2032
- Table 92: Global Pigmented Lesion Treatment Industry Volume K Unit Forecast, by Product Type 2019 & 2032
- Table 93: Global Pigmented Lesion Treatment Industry Revenue Million Forecast, by End User 2019 & 2032
- Table 94: Global Pigmented Lesion Treatment Industry Volume K Unit Forecast, by End User 2019 & 2032
- Table 95: Global Pigmented Lesion Treatment Industry Revenue Million Forecast, by Country 2019 & 2032
- Table 96: Global Pigmented Lesion Treatment Industry Volume K Unit Forecast, by Country 2019 & 2032
- Table 97: China Pigmented Lesion Treatment Industry Revenue (Million) Forecast, by Application 2019 & 2032
- Table 98: China Pigmented Lesion Treatment Industry Volume (K Unit) Forecast, by Application 2019 & 2032
- Table 99: Japan Pigmented Lesion Treatment Industry Revenue (Million) Forecast, by Application 2019 & 2032
- Table 100: Japan Pigmented Lesion Treatment Industry Volume (K Unit) Forecast, by Application 2019 & 2032
- Table 101: India Pigmented Lesion Treatment Industry Revenue (Million) Forecast, by Application 2019 & 2032
- Table 102: India Pigmented Lesion Treatment Industry Volume (K Unit) Forecast, by Application 2019 & 2032
- Table 103: Australia Pigmented Lesion Treatment Industry Revenue (Million) Forecast, by Application 2019 & 2032
- Table 104: Australia Pigmented Lesion Treatment Industry Volume (K Unit) Forecast, by Application 2019 & 2032
- Table 105: South Korea Pigmented Lesion Treatment Industry Revenue (Million) Forecast, by Application 2019 & 2032
- Table 106: South Korea Pigmented Lesion Treatment Industry Volume (K Unit) Forecast, by Application 2019 & 2032
- Table 107: Rest of Asia Pacific Pigmented Lesion Treatment Industry Revenue (Million) Forecast, by Application 2019 & 2032
- Table 108: Rest of Asia Pacific Pigmented Lesion Treatment Industry Volume (K Unit) Forecast, by Application 2019 & 2032
- Table 109: Global Pigmented Lesion Treatment Industry Revenue Million Forecast, by Product Type 2019 & 2032
- Table 110: Global Pigmented Lesion Treatment Industry Volume K Unit Forecast, by Product Type 2019 & 2032
- Table 111: Global Pigmented Lesion Treatment Industry Revenue Million Forecast, by End User 2019 & 2032
- Table 112: Global Pigmented Lesion Treatment Industry Volume K Unit Forecast, by End User 2019 & 2032
- Table 113: Global Pigmented Lesion Treatment Industry Revenue Million Forecast, by Country 2019 & 2032
- Table 114: Global Pigmented Lesion Treatment Industry Volume K Unit Forecast, by Country 2019 & 2032
- Table 115: GCC Pigmented Lesion Treatment Industry Revenue (Million) Forecast, by Application 2019 & 2032
- Table 116: GCC Pigmented Lesion Treatment Industry Volume (K Unit) Forecast, by Application 2019 & 2032
- Table 117: South Africa Pigmented Lesion Treatment Industry Revenue (Million) Forecast, by Application 2019 & 2032
- Table 118: South Africa Pigmented Lesion Treatment Industry Volume (K Unit) Forecast, by Application 2019 & 2032
- Table 119: Rest of Middle East and Africa Pigmented Lesion Treatment Industry Revenue (Million) Forecast, by Application 2019 & 2032
- Table 120: Rest of Middle East and Africa Pigmented Lesion Treatment Industry Volume (K Unit) Forecast, by Application 2019 & 2032
- Table 121: Global Pigmented Lesion Treatment Industry Revenue Million Forecast, by Product Type 2019 & 2032
- Table 122: Global Pigmented Lesion Treatment Industry Volume K Unit Forecast, by Product Type 2019 & 2032
- Table 123: Global Pigmented Lesion Treatment Industry Revenue Million Forecast, by End User 2019 & 2032
- Table 124: Global Pigmented Lesion Treatment Industry Volume K Unit Forecast, by End User 2019 & 2032
- Table 125: Global Pigmented Lesion Treatment Industry Revenue Million Forecast, by Country 2019 & 2032
- Table 126: Global Pigmented Lesion Treatment Industry Volume K Unit Forecast, by Country 2019 & 2032
- Table 127: Brazil Pigmented Lesion Treatment Industry Revenue (Million) Forecast, by Application 2019 & 2032
- Table 128: Brazil Pigmented Lesion Treatment Industry Volume (K Unit) Forecast, by Application 2019 & 2032
- Table 129: Argentina Pigmented Lesion Treatment Industry Revenue (Million) Forecast, by Application 2019 & 2032
- Table 130: Argentina Pigmented Lesion Treatment Industry Volume (K Unit) Forecast, by Application 2019 & 2032
- Table 131: Rest of South America Pigmented Lesion Treatment Industry Revenue (Million) Forecast, by Application 2019 & 2032
- Table 132: Rest of South America Pigmented Lesion Treatment Industry Volume (K Unit) Forecast, by Application 2019 & 2032
Frequently Asked Questions
1. What is the projected Compound Annual Growth Rate (CAGR) of the Pigmented Lesion Treatment Industry?
The projected CAGR is approximately 6.80%.
2. Which companies are prominent players in the Pigmented Lesion Treatment Industry?
Key companies in the market include Solta Medical Inc, Lumenis Ltd, Lutronic Corporation, Syneron Medical Ltd , Strata Skin Sciences Inc, Cutera Inc, Lynton Lasers Ltd, Alma Lasers Ltd, Cynosure Inc.
3. What are the main segments of the Pigmented Lesion Treatment Industry?
The market segments include Product Type, End User.
4. Can you provide details about the market size?
The market size is estimated to be USD 3.37 Million as of 2022.
5. What are some drivers contributing to market growth?
Rising Geriatric Population; Increasing Prevalence of Pigmentation Disorders.
6. What are the notable trends driving market growth?
Lasers and Energy Based Devices are Expected to Witness a Significant Growth.
7. Are there any restraints impacting market growth?
Side Effects Associated with Certain Treatments.
8. Can you provide examples of recent developments in the market?
December 2022: Singapore-based skincare brand Heure, known for its proprietary encapsulation tech, planned to launch a sophomore range targeting skin pigmentation in 2023.
9. What pricing options are available for accessing the report?
Pricing options include single-user, multi-user, and enterprise licenses priced at USD 4750, USD 5250, and USD 8750 respectively.
10. Is the market size provided in terms of value or volume?
The market size is provided in terms of value, measured in Million and volume, measured in K Unit.
11. Are there any specific market keywords associated with the report?
Yes, the market keyword associated with the report is "Pigmented Lesion Treatment Industry," which aids in identifying and referencing the specific market segment covered.
12. How do I determine which pricing option suits my needs best?
The pricing options vary based on user requirements and access needs. Individual users may opt for single-user licenses, while businesses requiring broader access may choose multi-user or enterprise licenses for cost-effective access to the report.
13. Are there any additional resources or data provided in the Pigmented Lesion Treatment Industry report?
While the report offers comprehensive insights, it's advisable to review the specific contents or supplementary materials provided to ascertain if additional resources or data are available.
14. How can I stay updated on further developments or reports in the Pigmented Lesion Treatment Industry?
To stay informed about further developments, trends, and reports in the Pigmented Lesion Treatment Industry, consider subscribing to industry newsletters, following relevant companies and organizations, or regularly checking reputable industry news sources and publications.
Methodology
Step 1 - Identification of Relevant Samples Size from Population Database


Step 2 - Approaches for Defining Global Market Size (Value, Volume* & Price*)

Note*: In applicable scenarios
Step 3 - Data Sources
Primary Research
- Web Analytics
- Survey Reports
- Research Institute
- Latest Research Reports
- Opinion Leaders
Secondary Research
- Annual Reports
- White Paper
- Latest Press Release
- Industry Association
- Paid Database
- Investor Presentations

Step 4 - Data Triangulation
Involves using different sources of information in order to increase the validity of a study
These sources are likely to be stakeholders in a program - participants, other researchers, program staff, other community members, and so on.
Then we put all data in single framework & apply various statistical tools to find out the dynamic on the market.
During the analysis stage, feedback from the stakeholder groups would be compared to determine areas of agreement as well as areas of divergence
