

Key Insights
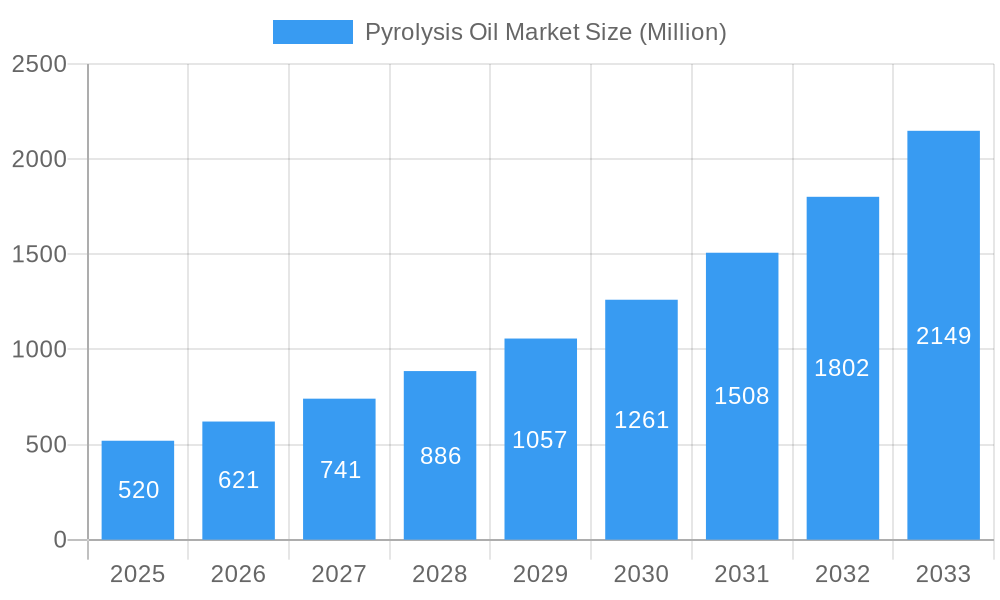
The pyrolysis oil market, valued at $0.52 billion in 2025, is experiencing robust growth, projected to expand at a compound annual growth rate (CAGR) of 19.71% from 2025 to 2033. This surge is driven primarily by the increasing demand for sustainable and renewable energy sources, coupled with stringent environmental regulations aimed at reducing reliance on fossil fuels. The rising awareness of plastic waste management challenges is also significantly fueling market expansion, as pyrolysis offers a viable solution for converting waste plastic into valuable fuel products. Key application segments, including fuels and chemicals, are witnessing considerable growth, driven by the versatile nature of pyrolysis oil and its adaptability in various industrial processes. Furthermore, technological advancements in pyrolysis technologies are enhancing efficiency and reducing production costs, thereby attracting more investments and driving market expansion. The growing adoption of circular economy principles globally further bolsters the market's prospects, with several nations implementing policies that incentivize waste-to-energy projects.
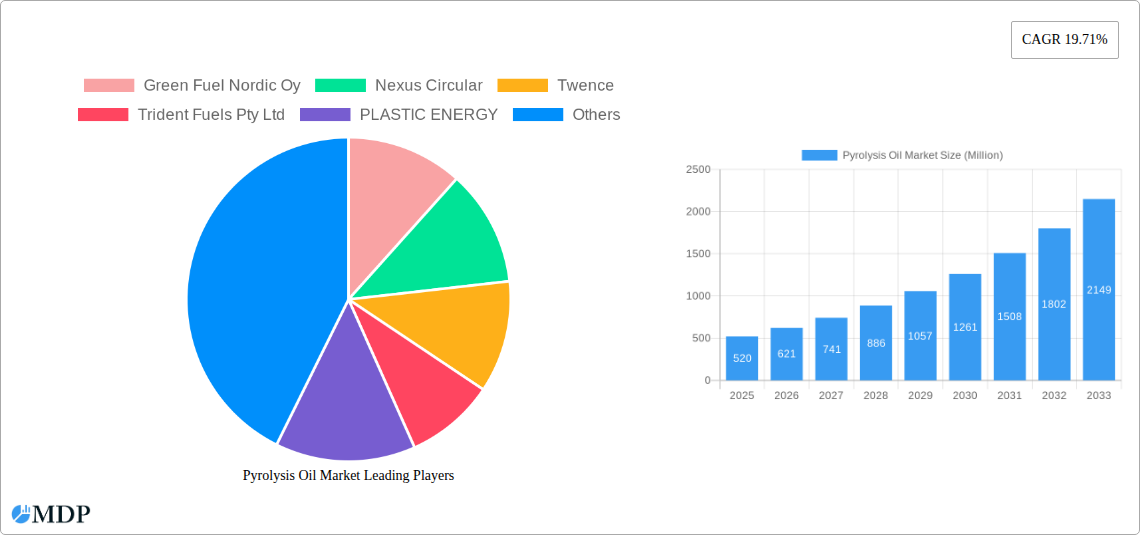
Pyrolysis Oil Market Market Size (In Million)
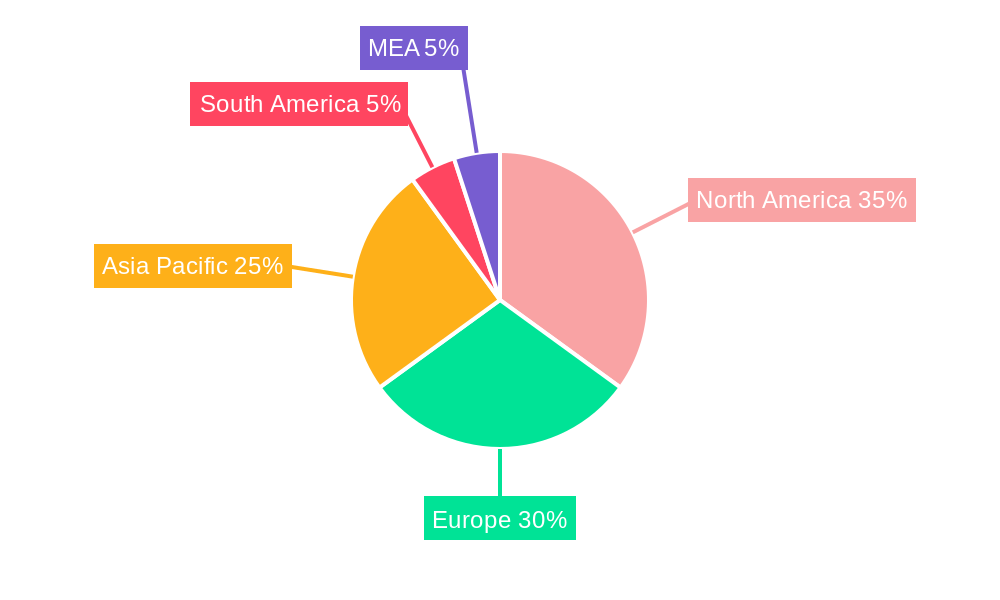
Significant regional variations exist within the market. North America and Europe, with their established recycling infrastructure and stringent environmental norms, currently hold significant market shares. However, the Asia-Pacific region, characterized by rapid industrialization and a substantial plastic waste generation rate, is poised for substantial growth in the coming years. The presence of several key players, including Green Fuel Nordic Oy, Nexus Circular, and Plastic Energy, underscores the competitive landscape. These companies are actively investing in research and development, as well as expanding their production capacities, to capitalize on the increasing market demand. The future of the pyrolysis oil market appears promising, with continued growth fueled by a combination of environmental concerns, technological improvements, and supportive government policies.
Pyrolysis Oil Market Company Market Share
Pyrolysis Oil Market: A Comprehensive Report (2019-2033)
This comprehensive report provides an in-depth analysis of the Pyrolysis Oil Market, offering valuable insights for industry stakeholders, investors, and researchers. The study period covers 2019-2033, with a base year of 2025 and a forecast period of 2025-2033. The report meticulously examines market dynamics, leading players, technological advancements, and future growth potential. This report is crucial for understanding the rapidly evolving landscape of this significant market and making informed strategic decisions. The market is projected to reach xx Million by 2033, exhibiting a CAGR of xx% during the forecast period.
Pyrolysis Oil Market Market Dynamics & Concentration
The pyrolysis oil market is characterized by a moderate level of concentration, with several key players holding significant market share. However, the market is also witnessing increased competition from new entrants driven by growing environmental concerns and the need for sustainable waste management solutions. Market share is currently dominated by a few large players such as PLASTIC ENERGY, Quantafuel ASA, and Alterra Energy LLC, but several smaller companies are aggressively expanding their capacity. The market concentration ratio (CR4) is estimated at xx%, indicating a relatively fragmented landscape with opportunities for both established and emerging companies.
Key Drivers of Market Dynamics:
- Stringent environmental regulations: Governments worldwide are implementing stricter regulations on plastic waste disposal, creating a strong demand for sustainable alternatives like pyrolysis oil.
- Technological advancements: Ongoing innovations in pyrolysis technology are improving efficiency, reducing costs, and expanding the range of feedstocks that can be processed.
- Growing demand for biofuels: The increasing focus on renewable energy sources fuels the demand for pyrolysis oil as a sustainable alternative to fossil fuels.
- Fluctuating crude oil prices: The volatility of crude oil prices influences the competitiveness of pyrolysis oil as a cost-effective alternative.
- Strategic mergers and acquisitions (M&A): The number of M&A deals in the pyrolysis oil market has increased in recent years, indicating consolidation and strategic expansion by major players. Approximately xx M&A deals were recorded between 2020 and 2024.
Pyrolysis Oil Market Industry Trends & Analysis
The global pyrolysis oil market is experiencing robust growth, driven by several factors. The increasing volume of plastic waste generated globally necessitates sustainable solutions, propelling the demand for pyrolysis oil. Technological innovations are leading to increased efficiency and reduced production costs, further boosting market growth. Consumer preferences are shifting towards eco-friendly products, fueling the adoption of pyrolysis oil in various applications. The market is witnessing intensified competition, with companies focusing on technological advancements, strategic partnerships, and geographic expansion. The market is expected to reach xx Million by 2033, with a CAGR of xx% from 2025 to 2033. Market penetration in key regions is steadily increasing, with Europe and North America currently leading the way, while the Asia-Pacific region is experiencing significant growth potential.
Leading Markets & Segments in Pyrolysis Oil Market
The pyrolysis oil market is witnessing significant growth across various regions and segments. Waste plastic is the dominant raw material, contributing to the largest market share due to its high availability and suitability for pyrolysis. Fuels constitute the largest application segment, owing to the increasing demand for sustainable alternatives to fossil fuels.
Dominant Regions:
- Europe: Stringent environmental regulations and significant government support for renewable energy initiatives are driving market growth in Europe.
- North America: Growing awareness of environmental issues and increasing investment in advanced recycling technologies are contributing to market expansion in North America.
- Asia-Pacific: Rapid industrialization and rising plastic waste generation in developing economies are creating significant opportunities for pyrolysis oil in this region.
Key Drivers by Segment:
- Waste Plastic: Abundant availability, government regulations driving waste management initiatives.
- Fuels: Demand for sustainable alternatives to fossil fuels, supportive government policies.
- Chemicals: Growing demand for bio-based chemicals, applications in various industries.
Detailed Dominance Analysis: Europe holds the largest market share currently, followed by North America. The Asia-Pacific region is expected to witness the fastest growth in the coming years due to a surge in waste plastic generation and supportive government regulations.
Pyrolysis Oil Market Product Developments
Recent product developments in the pyrolysis oil market focus on improving process efficiency, expanding feedstock flexibility, and enhancing product quality. Innovations include advanced reactor designs, optimized process parameters, and improved downstream processing techniques. These developments have broadened the applications of pyrolysis oil, leading to increased market penetration in various industries including fuels, chemicals, and materials. The enhanced quality of pyrolysis oil also contributes to its competitiveness and cost-effectiveness.
Key Drivers of Pyrolysis Oil Market Growth
The pyrolysis oil market’s growth is primarily propelled by stringent government regulations aimed at reducing plastic waste and promoting sustainable solutions. Technological advancements leading to greater efficiency and lower costs are also significant. Furthermore, the growing demand for biofuels and the increasing awareness of environmental issues among consumers are key drivers. Examples include the EU's plastic strategy and various national-level policies supporting waste-to-energy initiatives.
Challenges in the Pyrolysis Oil Market Market
The pyrolysis oil market faces several challenges, including the high capital expenditure required for setting up pyrolysis plants. Technical complexities associated with the process and inconsistent quality of feedstock also present hurdles. Furthermore, competition from other waste management technologies and fluctuations in crude oil prices can impact the market's profitability. These challenges limit wider adoption, particularly in developing regions. The estimated impact of these challenges on market growth is a reduction of xx% in the projected growth rate.
Emerging Opportunities in Pyrolysis Oil Market
The pyrolysis oil market presents several emerging opportunities. Technological breakthroughs continue to enhance the efficiency and scalability of pyrolysis processes, leading to lower production costs and broader applications. Strategic partnerships between technology providers, waste management companies, and end-users are driving market expansion. The exploration of new feedstocks and the development of innovative applications for pyrolysis oil further create opportunities for growth.
Leading Players in the Pyrolysis Oil Market Sector
- Green Fuel Nordic Oy
- Nexus Circular
- Twence
- Trident Fuels Pty Ltd
- PLASTIC ENERGY
- Ensyn
- Bioenergy Ae Cote-Nord
- Alterra Energy LLC
- New Energy Kft
- Mk Aromatics Limited
- New Hope Energy
- Quantafuel ASA
- Plastic Advanced Recycling Corp
- Setra Group
Key Milestones in Pyrolysis Oil Market Industry
- May 2022: ArcelorMittal Mining Canada and BioÉnergie AE Côte-Nord Canada signed a three-year agreement to supply 16 Million liters of pyrolytic oil annually to ArcelorMittal's pellet plant. This significantly boosted the market’s credibility and visibility within the steel industry.
- May 2022: New Hope Energy and TotalEnergies partnered to build an advanced recycling plant in Texas, transforming plastic waste into recycled feedstock for virgin-quality polymers. This collaboration showcases the industry's growing interest in advanced recycling technologies.
- February 2023: Alterra Energy, LLC secured a license agreement with a Freepoint Eco-Systems subsidiary, resulting in a new 192,000-metric-ton-per-year plastic waste processing facility in the US Gulf Coast. This significantly increased processing capacity in a key market.
- June 2023: Audi Hungaria partnered with New Energy Kft. to utilize pyrolysis for recycling tire waste from its Gyor plant. This collaboration highlighted the technology's effectiveness in addressing specific waste streams.
Strategic Outlook for Pyrolysis Oil Market Market
The pyrolysis oil market holds immense potential for future growth, driven by the increasing global focus on sustainability, the expanding volume of plastic waste, and continuous technological advancements in pyrolysis technologies. Strategic partnerships between key players and the exploration of new feedstock sources will further enhance market expansion. The potential for integrating pyrolysis oil into existing industrial processes and its versatility in creating a range of products will drive significant growth over the next decade.
Pyrolysis Oil Market Segmentation
-
1. Raw Material
- 1.1. Waste Plastic
- 1.2. Waste Rubber
- 1.3. Wood
- 1.4. Oil Sludge
- 1.5. Other Raw Materials
-
2. Application
- 2.1. Fuels
- 2.2. Chemicals
Pyrolysis Oil Market Segmentation By Geography
-
1. Asia Pacific
- 1.1. China
- 1.2. India
- 1.3. Japan
- 1.4. Thailand
- 1.5. Vietnam
- 1.6. Malaysia
- 1.7. Indonesia
- 1.8. South Korea
- 1.9. Rest of Asia Pacific
-
2. North America
- 2.1. United States
- 2.2. Canada
- 2.3. Mexico
-
3. Europe
- 3.1. Germany
- 3.2. France
- 3.3. United Kingdom
- 3.4. Italy
- 3.5. NORDIC
- 3.6. Spain
- 3.7. Turkey
- 3.8. Russia
- 3.9. Rest of Europe
-
4. South America
- 4.1. Brazil
- 4.2. Argentina
- 4.3. Colombia
- 4.4. Rest of South America
-
5. Middle East and Africa
- 5.1. Saudi Arabia
- 5.2. South Africa
- 5.3. Morocco
- 5.4. Qatar
- 5.5. Egypt
- 5.6. United Arab Emirates
- 5.7. Nigeria
- 5.8. Rest of Middle East and Africa
Pyrolysis Oil Market Regional Market Share
Geographic Coverage of Pyrolysis Oil Market
Pyrolysis Oil Market REPORT HIGHLIGHTS
| Aspects | Details |
|---|---|
| Study Period | 2020-2034 |
| Base Year | 2025 |
| Estimated Year | 2026 |
| Forecast Period | 2026-2034 |
| Historical Period | 2020-2025 |
| Growth Rate | CAGR of 19.71% from 2020-2034 |
| Segmentation |
|
Table of Contents
- 1. Introduction
- 1.1. Research Scope
- 1.2. Market Segmentation
- 1.3. Research Objective
- 1.4. Definitions and Assumptions
- 2. Executive Summary
- 2.1. Market Snapshot
- 3. Market Dynamics
- 3.1. Market Drivers
- 3.2. Market Restrains
- 3.3. Market Trends
- 3.4. Market Opportunities
- 4. Market Factor Analysis
- 4.1. Porters Five Forces
- 4.1.1. Bargaining Power of Suppliers
- 4.1.2. Bargaining Power of Buyers
- 4.1.3. Threat of New Entrants
- 4.1.4. Threat of Substitutes
- 4.1.5. Competitive Rivalry
- 4.2. PESTEL analysis
- 4.3. BCG Analysis
- 4.3.1. Stars (High Growth, High Market Share)
- 4.3.2. Cash Cows (Low Growth, High Market Share)
- 4.3.3. Question Mark (High Growth, Low Market Share)
- 4.3.4. Dogs (Low Growth, Low Market Share)
- 4.4. Ansoff Matrix Analysis
- 4.5. Supply Chain Analysis
- 4.6. Regulatory Landscape
- 4.7. Current Market Potential and Opportunity Assessment (TAM–SAM–SOM Framework)
- 4.8. MDP Analyst Note
- 4.1. Porters Five Forces
- 5. Market Analysis, Insights and Forecast 2021-2033
- 5.1. Market Analysis, Insights and Forecast - by Raw Material
- 5.1.1. Waste Plastic
- 5.1.2. Waste Rubber
- 5.1.3. Wood
- 5.1.4. Oil Sludge
- 5.1.5. Other Raw Materials
- 5.2. Market Analysis, Insights and Forecast - by Application
- 5.2.1. Fuels
- 5.2.2. Chemicals
- 5.3. Market Analysis, Insights and Forecast - by Region
- 5.3.1. Asia Pacific
- 5.3.2. North America
- 5.3.3. Europe
- 5.3.4. South America
- 5.3.5. Middle East and Africa
- 5.1. Market Analysis, Insights and Forecast - by Raw Material
- 6. Global Pyrolysis Oil Market Analysis, Insights and Forecast, 2021-2033
- 6.1. Market Analysis, Insights and Forecast - by Raw Material
- 6.1.1. Waste Plastic
- 6.1.2. Waste Rubber
- 6.1.3. Wood
- 6.1.4. Oil Sludge
- 6.1.5. Other Raw Materials
- 6.2. Market Analysis, Insights and Forecast - by Application
- 6.2.1. Fuels
- 6.2.2. Chemicals
- 6.1. Market Analysis, Insights and Forecast - by Raw Material
- 7. Asia Pacific Pyrolysis Oil Market Analysis, Insights and Forecast, 2020-2032
- 7.1. Market Analysis, Insights and Forecast - by Raw Material
- 7.1.1. Waste Plastic
- 7.1.2. Waste Rubber
- 7.1.3. Wood
- 7.1.4. Oil Sludge
- 7.1.5. Other Raw Materials
- 7.2. Market Analysis, Insights and Forecast - by Application
- 7.2.1. Fuels
- 7.2.2. Chemicals
- 7.1. Market Analysis, Insights and Forecast - by Raw Material
- 8. North America Pyrolysis Oil Market Analysis, Insights and Forecast, 2020-2032
- 8.1. Market Analysis, Insights and Forecast - by Raw Material
- 8.1.1. Waste Plastic
- 8.1.2. Waste Rubber
- 8.1.3. Wood
- 8.1.4. Oil Sludge
- 8.1.5. Other Raw Materials
- 8.2. Market Analysis, Insights and Forecast - by Application
- 8.2.1. Fuels
- 8.2.2. Chemicals
- 8.1. Market Analysis, Insights and Forecast - by Raw Material
- 9. Europe Pyrolysis Oil Market Analysis, Insights and Forecast, 2020-2032
- 9.1. Market Analysis, Insights and Forecast - by Raw Material
- 9.1.1. Waste Plastic
- 9.1.2. Waste Rubber
- 9.1.3. Wood
- 9.1.4. Oil Sludge
- 9.1.5. Other Raw Materials
- 9.2. Market Analysis, Insights and Forecast - by Application
- 9.2.1. Fuels
- 9.2.2. Chemicals
- 9.1. Market Analysis, Insights and Forecast - by Raw Material
- 10. South America Pyrolysis Oil Market Analysis, Insights and Forecast, 2020-2032
- 10.1. Market Analysis, Insights and Forecast - by Raw Material
- 10.1.1. Waste Plastic
- 10.1.2. Waste Rubber
- 10.1.3. Wood
- 10.1.4. Oil Sludge
- 10.1.5. Other Raw Materials
- 10.2. Market Analysis, Insights and Forecast - by Application
- 10.2.1. Fuels
- 10.2.2. Chemicals
- 10.1. Market Analysis, Insights and Forecast - by Raw Material
- 11. Middle East and Africa Pyrolysis Oil Market Analysis, Insights and Forecast, 2020-2032
- 11.1. Market Analysis, Insights and Forecast - by Raw Material
- 11.1.1. Waste Plastic
- 11.1.2. Waste Rubber
- 11.1.3. Wood
- 11.1.4. Oil Sludge
- 11.1.5. Other Raw Materials
- 11.2. Market Analysis, Insights and Forecast - by Application
- 11.2.1. Fuels
- 11.2.2. Chemicals
- 11.1. Market Analysis, Insights and Forecast - by Raw Material
- 12. Competitive Analysis
- 12.1. Company Profiles
- 12.1.1 Green Fuel Nordic Oy
- 12.1.1.1. Company Overview
- 12.1.1.2. Products
- 12.1.1.3. Company Financials
- 12.1.1.4. SWOT Analysis
- 12.1.2 Nexus Circular
- 12.1.2.1. Company Overview
- 12.1.2.2. Products
- 12.1.2.3. Company Financials
- 12.1.2.4. SWOT Analysis
- 12.1.3 Twence
- 12.1.3.1. Company Overview
- 12.1.3.2. Products
- 12.1.3.3. Company Financials
- 12.1.3.4. SWOT Analysis
- 12.1.4 Trident Fuels Pty Ltd
- 12.1.4.1. Company Overview
- 12.1.4.2. Products
- 12.1.4.3. Company Financials
- 12.1.4.4. SWOT Analysis
- 12.1.5 PLASTIC ENERGY
- 12.1.5.1. Company Overview
- 12.1.5.2. Products
- 12.1.5.3. Company Financials
- 12.1.5.4. SWOT Analysis
- 12.1.6 Ensyn
- 12.1.6.1. Company Overview
- 12.1.6.2. Products
- 12.1.6.3. Company Financials
- 12.1.6.4. SWOT Analysis
- 12.1.7 Bioenergy Ae Cote-Nord
- 12.1.7.1. Company Overview
- 12.1.7.2. Products
- 12.1.7.3. Company Financials
- 12.1.7.4. SWOT Analysis
- 12.1.8 Alterra Energy LLC
- 12.1.8.1. Company Overview
- 12.1.8.2. Products
- 12.1.8.3. Company Financials
- 12.1.8.4. SWOT Analysis
- 12.1.9 New Energy Kft
- 12.1.9.1. Company Overview
- 12.1.9.2. Products
- 12.1.9.3. Company Financials
- 12.1.9.4. SWOT Analysis
- 12.1.10 Mk Aromatics Limited
- 12.1.10.1. Company Overview
- 12.1.10.2. Products
- 12.1.10.3. Company Financials
- 12.1.10.4. SWOT Analysis
- 12.1.11 New Hope Energy
- 12.1.11.1. Company Overview
- 12.1.11.2. Products
- 12.1.11.3. Company Financials
- 12.1.11.4. SWOT Analysis
- 12.1.12 Quantafuel ASA
- 12.1.12.1. Company Overview
- 12.1.12.2. Products
- 12.1.12.3. Company Financials
- 12.1.12.4. SWOT Analysis
- 12.1.13 Plastic Advanced Recycling Corp
- 12.1.13.1. Company Overview
- 12.1.13.2. Products
- 12.1.13.3. Company Financials
- 12.1.13.4. SWOT Analysis
- 12.1.14 Setra Group
- 12.1.14.1. Company Overview
- 12.1.14.2. Products
- 12.1.14.3. Company Financials
- 12.1.14.4. SWOT Analysis
- 12.1.1 Green Fuel Nordic Oy
- 12.2. Market Entropy
- 12.2.1 Company's Key Areas Served
- 12.2.2 Recent Developments
- 12.3. Company Market Share Analysis 2025
- 12.3.1 Top 5 Companies Market Share Analysis
- 12.3.2 Top 3 Companies Market Share Analysis
- 12.4. List of Potential Customers
- 13. Research Methodology
List of Figures
- Figure 1: Global Pyrolysis Oil Market Revenue Breakdown (Million, %) by Region 2025 & 2033
- Figure 2: Global Pyrolysis Oil Market Volume Breakdown (K Tons, %) by Region 2025 & 2033
- Figure 3: Asia Pacific Pyrolysis Oil Market Revenue (Million), by Raw Material 2025 & 2033
- Figure 4: Asia Pacific Pyrolysis Oil Market Volume (K Tons), by Raw Material 2025 & 2033
- Figure 5: Asia Pacific Pyrolysis Oil Market Revenue Share (%), by Raw Material 2025 & 2033
- Figure 6: Asia Pacific Pyrolysis Oil Market Volume Share (%), by Raw Material 2025 & 2033
- Figure 7: Asia Pacific Pyrolysis Oil Market Revenue (Million), by Application 2025 & 2033
- Figure 8: Asia Pacific Pyrolysis Oil Market Volume (K Tons), by Application 2025 & 2033
- Figure 9: Asia Pacific Pyrolysis Oil Market Revenue Share (%), by Application 2025 & 2033
- Figure 10: Asia Pacific Pyrolysis Oil Market Volume Share (%), by Application 2025 & 2033
- Figure 11: Asia Pacific Pyrolysis Oil Market Revenue (Million), by Country 2025 & 2033
- Figure 12: Asia Pacific Pyrolysis Oil Market Volume (K Tons), by Country 2025 & 2033
- Figure 13: Asia Pacific Pyrolysis Oil Market Revenue Share (%), by Country 2025 & 2033
- Figure 14: Asia Pacific Pyrolysis Oil Market Volume Share (%), by Country 2025 & 2033
- Figure 15: North America Pyrolysis Oil Market Revenue (Million), by Raw Material 2025 & 2033
- Figure 16: North America Pyrolysis Oil Market Volume (K Tons), by Raw Material 2025 & 2033
- Figure 17: North America Pyrolysis Oil Market Revenue Share (%), by Raw Material 2025 & 2033
- Figure 18: North America Pyrolysis Oil Market Volume Share (%), by Raw Material 2025 & 2033
- Figure 19: North America Pyrolysis Oil Market Revenue (Million), by Application 2025 & 2033
- Figure 20: North America Pyrolysis Oil Market Volume (K Tons), by Application 2025 & 2033
- Figure 21: North America Pyrolysis Oil Market Revenue Share (%), by Application 2025 & 2033
- Figure 22: North America Pyrolysis Oil Market Volume Share (%), by Application 2025 & 2033
- Figure 23: North America Pyrolysis Oil Market Revenue (Million), by Country 2025 & 2033
- Figure 24: North America Pyrolysis Oil Market Volume (K Tons), by Country 2025 & 2033
- Figure 25: North America Pyrolysis Oil Market Revenue Share (%), by Country 2025 & 2033
- Figure 26: North America Pyrolysis Oil Market Volume Share (%), by Country 2025 & 2033
- Figure 27: Europe Pyrolysis Oil Market Revenue (Million), by Raw Material 2025 & 2033
- Figure 28: Europe Pyrolysis Oil Market Volume (K Tons), by Raw Material 2025 & 2033
- Figure 29: Europe Pyrolysis Oil Market Revenue Share (%), by Raw Material 2025 & 2033
- Figure 30: Europe Pyrolysis Oil Market Volume Share (%), by Raw Material 2025 & 2033
- Figure 31: Europe Pyrolysis Oil Market Revenue (Million), by Application 2025 & 2033
- Figure 32: Europe Pyrolysis Oil Market Volume (K Tons), by Application 2025 & 2033
- Figure 33: Europe Pyrolysis Oil Market Revenue Share (%), by Application 2025 & 2033
- Figure 34: Europe Pyrolysis Oil Market Volume Share (%), by Application 2025 & 2033
- Figure 35: Europe Pyrolysis Oil Market Revenue (Million), by Country 2025 & 2033
- Figure 36: Europe Pyrolysis Oil Market Volume (K Tons), by Country 2025 & 2033
- Figure 37: Europe Pyrolysis Oil Market Revenue Share (%), by Country 2025 & 2033
- Figure 38: Europe Pyrolysis Oil Market Volume Share (%), by Country 2025 & 2033
- Figure 39: South America Pyrolysis Oil Market Revenue (Million), by Raw Material 2025 & 2033
- Figure 40: South America Pyrolysis Oil Market Volume (K Tons), by Raw Material 2025 & 2033
- Figure 41: South America Pyrolysis Oil Market Revenue Share (%), by Raw Material 2025 & 2033
- Figure 42: South America Pyrolysis Oil Market Volume Share (%), by Raw Material 2025 & 2033
- Figure 43: South America Pyrolysis Oil Market Revenue (Million), by Application 2025 & 2033
- Figure 44: South America Pyrolysis Oil Market Volume (K Tons), by Application 2025 & 2033
- Figure 45: South America Pyrolysis Oil Market Revenue Share (%), by Application 2025 & 2033
- Figure 46: South America Pyrolysis Oil Market Volume Share (%), by Application 2025 & 2033
- Figure 47: South America Pyrolysis Oil Market Revenue (Million), by Country 2025 & 2033
- Figure 48: South America Pyrolysis Oil Market Volume (K Tons), by Country 2025 & 2033
- Figure 49: South America Pyrolysis Oil Market Revenue Share (%), by Country 2025 & 2033
- Figure 50: South America Pyrolysis Oil Market Volume Share (%), by Country 2025 & 2033
- Figure 51: Middle East and Africa Pyrolysis Oil Market Revenue (Million), by Raw Material 2025 & 2033
- Figure 52: Middle East and Africa Pyrolysis Oil Market Volume (K Tons), by Raw Material 2025 & 2033
- Figure 53: Middle East and Africa Pyrolysis Oil Market Revenue Share (%), by Raw Material 2025 & 2033
- Figure 54: Middle East and Africa Pyrolysis Oil Market Volume Share (%), by Raw Material 2025 & 2033
- Figure 55: Middle East and Africa Pyrolysis Oil Market Revenue (Million), by Application 2025 & 2033
- Figure 56: Middle East and Africa Pyrolysis Oil Market Volume (K Tons), by Application 2025 & 2033
- Figure 57: Middle East and Africa Pyrolysis Oil Market Revenue Share (%), by Application 2025 & 2033
- Figure 58: Middle East and Africa Pyrolysis Oil Market Volume Share (%), by Application 2025 & 2033
- Figure 59: Middle East and Africa Pyrolysis Oil Market Revenue (Million), by Country 2025 & 2033
- Figure 60: Middle East and Africa Pyrolysis Oil Market Volume (K Tons), by Country 2025 & 2033
- Figure 61: Middle East and Africa Pyrolysis Oil Market Revenue Share (%), by Country 2025 & 2033
- Figure 62: Middle East and Africa Pyrolysis Oil Market Volume Share (%), by Country 2025 & 2033
List of Tables
- Table 1: Global Pyrolysis Oil Market Revenue Million Forecast, by Raw Material 2020 & 2033
- Table 2: Global Pyrolysis Oil Market Volume K Tons Forecast, by Raw Material 2020 & 2033
- Table 3: Global Pyrolysis Oil Market Revenue Million Forecast, by Application 2020 & 2033
- Table 4: Global Pyrolysis Oil Market Volume K Tons Forecast, by Application 2020 & 2033
- Table 5: Global Pyrolysis Oil Market Revenue Million Forecast, by Region 2020 & 2033
- Table 6: Global Pyrolysis Oil Market Volume K Tons Forecast, by Region 2020 & 2033
- Table 7: Global Pyrolysis Oil Market Revenue Million Forecast, by Raw Material 2020 & 2033
- Table 8: Global Pyrolysis Oil Market Volume K Tons Forecast, by Raw Material 2020 & 2033
- Table 9: Global Pyrolysis Oil Market Revenue Million Forecast, by Application 2020 & 2033
- Table 10: Global Pyrolysis Oil Market Volume K Tons Forecast, by Application 2020 & 2033
- Table 11: Global Pyrolysis Oil Market Revenue Million Forecast, by Country 2020 & 2033
- Table 12: Global Pyrolysis Oil Market Volume K Tons Forecast, by Country 2020 & 2033
- Table 13: China Pyrolysis Oil Market Revenue (Million) Forecast, by Application 2020 & 2033
- Table 14: China Pyrolysis Oil Market Volume (K Tons) Forecast, by Application 2020 & 2033
- Table 15: India Pyrolysis Oil Market Revenue (Million) Forecast, by Application 2020 & 2033
- Table 16: India Pyrolysis Oil Market Volume (K Tons) Forecast, by Application 2020 & 2033
- Table 17: Japan Pyrolysis Oil Market Revenue (Million) Forecast, by Application 2020 & 2033
- Table 18: Japan Pyrolysis Oil Market Volume (K Tons) Forecast, by Application 2020 & 2033
- Table 19: Thailand Pyrolysis Oil Market Revenue (Million) Forecast, by Application 2020 & 2033
- Table 20: Thailand Pyrolysis Oil Market Volume (K Tons) Forecast, by Application 2020 & 2033
- Table 21: Vietnam Pyrolysis Oil Market Revenue (Million) Forecast, by Application 2020 & 2033
- Table 22: Vietnam Pyrolysis Oil Market Volume (K Tons) Forecast, by Application 2020 & 2033
- Table 23: Malaysia Pyrolysis Oil Market Revenue (Million) Forecast, by Application 2020 & 2033
- Table 24: Malaysia Pyrolysis Oil Market Volume (K Tons) Forecast, by Application 2020 & 2033
- Table 25: Indonesia Pyrolysis Oil Market Revenue (Million) Forecast, by Application 2020 & 2033
- Table 26: Indonesia Pyrolysis Oil Market Volume (K Tons) Forecast, by Application 2020 & 2033
- Table 27: South Korea Pyrolysis Oil Market Revenue (Million) Forecast, by Application 2020 & 2033
- Table 28: South Korea Pyrolysis Oil Market Volume (K Tons) Forecast, by Application 2020 & 2033
- Table 29: Rest of Asia Pacific Pyrolysis Oil Market Revenue (Million) Forecast, by Application 2020 & 2033
- Table 30: Rest of Asia Pacific Pyrolysis Oil Market Volume (K Tons) Forecast, by Application 2020 & 2033
- Table 31: Global Pyrolysis Oil Market Revenue Million Forecast, by Raw Material 2020 & 2033
- Table 32: Global Pyrolysis Oil Market Volume K Tons Forecast, by Raw Material 2020 & 2033
- Table 33: Global Pyrolysis Oil Market Revenue Million Forecast, by Application 2020 & 2033
- Table 34: Global Pyrolysis Oil Market Volume K Tons Forecast, by Application 2020 & 2033
- Table 35: Global Pyrolysis Oil Market Revenue Million Forecast, by Country 2020 & 2033
- Table 36: Global Pyrolysis Oil Market Volume K Tons Forecast, by Country 2020 & 2033
- Table 37: United States Pyrolysis Oil Market Revenue (Million) Forecast, by Application 2020 & 2033
- Table 38: United States Pyrolysis Oil Market Volume (K Tons) Forecast, by Application 2020 & 2033
- Table 39: Canada Pyrolysis Oil Market Revenue (Million) Forecast, by Application 2020 & 2033
- Table 40: Canada Pyrolysis Oil Market Volume (K Tons) Forecast, by Application 2020 & 2033
- Table 41: Mexico Pyrolysis Oil Market Revenue (Million) Forecast, by Application 2020 & 2033
- Table 42: Mexico Pyrolysis Oil Market Volume (K Tons) Forecast, by Application 2020 & 2033
- Table 43: Global Pyrolysis Oil Market Revenue Million Forecast, by Raw Material 2020 & 2033
- Table 44: Global Pyrolysis Oil Market Volume K Tons Forecast, by Raw Material 2020 & 2033
- Table 45: Global Pyrolysis Oil Market Revenue Million Forecast, by Application 2020 & 2033
- Table 46: Global Pyrolysis Oil Market Volume K Tons Forecast, by Application 2020 & 2033
- Table 47: Global Pyrolysis Oil Market Revenue Million Forecast, by Country 2020 & 2033
- Table 48: Global Pyrolysis Oil Market Volume K Tons Forecast, by Country 2020 & 2033
- Table 49: Germany Pyrolysis Oil Market Revenue (Million) Forecast, by Application 2020 & 2033
- Table 50: Germany Pyrolysis Oil Market Volume (K Tons) Forecast, by Application 2020 & 2033
- Table 51: France Pyrolysis Oil Market Revenue (Million) Forecast, by Application 2020 & 2033
- Table 52: France Pyrolysis Oil Market Volume (K Tons) Forecast, by Application 2020 & 2033
- Table 53: United Kingdom Pyrolysis Oil Market Revenue (Million) Forecast, by Application 2020 & 2033
- Table 54: United Kingdom Pyrolysis Oil Market Volume (K Tons) Forecast, by Application 2020 & 2033
- Table 55: Italy Pyrolysis Oil Market Revenue (Million) Forecast, by Application 2020 & 2033
- Table 56: Italy Pyrolysis Oil Market Volume (K Tons) Forecast, by Application 2020 & 2033
- Table 57: NORDIC Pyrolysis Oil Market Revenue (Million) Forecast, by Application 2020 & 2033
- Table 58: NORDIC Pyrolysis Oil Market Volume (K Tons) Forecast, by Application 2020 & 2033
- Table 59: Spain Pyrolysis Oil Market Revenue (Million) Forecast, by Application 2020 & 2033
- Table 60: Spain Pyrolysis Oil Market Volume (K Tons) Forecast, by Application 2020 & 2033
- Table 61: Turkey Pyrolysis Oil Market Revenue (Million) Forecast, by Application 2020 & 2033
- Table 62: Turkey Pyrolysis Oil Market Volume (K Tons) Forecast, by Application 2020 & 2033
- Table 63: Russia Pyrolysis Oil Market Revenue (Million) Forecast, by Application 2020 & 2033
- Table 64: Russia Pyrolysis Oil Market Volume (K Tons) Forecast, by Application 2020 & 2033
- Table 65: Rest of Europe Pyrolysis Oil Market Revenue (Million) Forecast, by Application 2020 & 2033
- Table 66: Rest of Europe Pyrolysis Oil Market Volume (K Tons) Forecast, by Application 2020 & 2033
- Table 67: Global Pyrolysis Oil Market Revenue Million Forecast, by Raw Material 2020 & 2033
- Table 68: Global Pyrolysis Oil Market Volume K Tons Forecast, by Raw Material 2020 & 2033
- Table 69: Global Pyrolysis Oil Market Revenue Million Forecast, by Application 2020 & 2033
- Table 70: Global Pyrolysis Oil Market Volume K Tons Forecast, by Application 2020 & 2033
- Table 71: Global Pyrolysis Oil Market Revenue Million Forecast, by Country 2020 & 2033
- Table 72: Global Pyrolysis Oil Market Volume K Tons Forecast, by Country 2020 & 2033
- Table 73: Brazil Pyrolysis Oil Market Revenue (Million) Forecast, by Application 2020 & 2033
- Table 74: Brazil Pyrolysis Oil Market Volume (K Tons) Forecast, by Application 2020 & 2033
- Table 75: Argentina Pyrolysis Oil Market Revenue (Million) Forecast, by Application 2020 & 2033
- Table 76: Argentina Pyrolysis Oil Market Volume (K Tons) Forecast, by Application 2020 & 2033
- Table 77: Colombia Pyrolysis Oil Market Revenue (Million) Forecast, by Application 2020 & 2033
- Table 78: Colombia Pyrolysis Oil Market Volume (K Tons) Forecast, by Application 2020 & 2033
- Table 79: Rest of South America Pyrolysis Oil Market Revenue (Million) Forecast, by Application 2020 & 2033
- Table 80: Rest of South America Pyrolysis Oil Market Volume (K Tons) Forecast, by Application 2020 & 2033
- Table 81: Global Pyrolysis Oil Market Revenue Million Forecast, by Raw Material 2020 & 2033
- Table 82: Global Pyrolysis Oil Market Volume K Tons Forecast, by Raw Material 2020 & 2033
- Table 83: Global Pyrolysis Oil Market Revenue Million Forecast, by Application 2020 & 2033
- Table 84: Global Pyrolysis Oil Market Volume K Tons Forecast, by Application 2020 & 2033
- Table 85: Global Pyrolysis Oil Market Revenue Million Forecast, by Country 2020 & 2033
- Table 86: Global Pyrolysis Oil Market Volume K Tons Forecast, by Country 2020 & 2033
- Table 87: Saudi Arabia Pyrolysis Oil Market Revenue (Million) Forecast, by Application 2020 & 2033
- Table 88: Saudi Arabia Pyrolysis Oil Market Volume (K Tons) Forecast, by Application 2020 & 2033
- Table 89: South Africa Pyrolysis Oil Market Revenue (Million) Forecast, by Application 2020 & 2033
- Table 90: South Africa Pyrolysis Oil Market Volume (K Tons) Forecast, by Application 2020 & 2033
- Table 91: Morocco Pyrolysis Oil Market Revenue (Million) Forecast, by Application 2020 & 2033
- Table 92: Morocco Pyrolysis Oil Market Volume (K Tons) Forecast, by Application 2020 & 2033
- Table 93: Qatar Pyrolysis Oil Market Revenue (Million) Forecast, by Application 2020 & 2033
- Table 94: Qatar Pyrolysis Oil Market Volume (K Tons) Forecast, by Application 2020 & 2033
- Table 95: Egypt Pyrolysis Oil Market Revenue (Million) Forecast, by Application 2020 & 2033
- Table 96: Egypt Pyrolysis Oil Market Volume (K Tons) Forecast, by Application 2020 & 2033
- Table 97: United Arab Emirates Pyrolysis Oil Market Revenue (Million) Forecast, by Application 2020 & 2033
- Table 98: United Arab Emirates Pyrolysis Oil Market Volume (K Tons) Forecast, by Application 2020 & 2033
- Table 99: Nigeria Pyrolysis Oil Market Revenue (Million) Forecast, by Application 2020 & 2033
- Table 100: Nigeria Pyrolysis Oil Market Volume (K Tons) Forecast, by Application 2020 & 2033
- Table 101: Rest of Middle East and Africa Pyrolysis Oil Market Revenue (Million) Forecast, by Application 2020 & 2033
- Table 102: Rest of Middle East and Africa Pyrolysis Oil Market Volume (K Tons) Forecast, by Application 2020 & 2033
Frequently Asked Questions
1. What is the projected Compound Annual Growth Rate (CAGR) of the Pyrolysis Oil Market?
The projected CAGR is approximately 19.71%.
2. Which companies are prominent players in the Pyrolysis Oil Market?
Key companies in the market include Green Fuel Nordic Oy, Nexus Circular, Twence, Trident Fuels Pty Ltd, PLASTIC ENERGY, Ensyn, Bioenergy Ae Cote-Nord, Alterra Energy LLC, New Energy Kft, Mk Aromatics Limited, New Hope Energy, Quantafuel ASA, Plastic Advanced Recycling Corp, Setra Group.
3. What are the main segments of the Pyrolysis Oil Market?
The market segments include Raw Material, Application.
4. Can you provide details about the market size?
The market size is estimated to be USD 0.52 Million as of 2022.
5. What are some drivers contributing to market growth?
Rising Demand For Environment-friendly Fuel and Raw Material Alternatives; Increasing Demand From Heat and Power Generation Sectors.
6. What are the notable trends driving market growth?
Increasing Demand for Fuel Application.
7. Are there any restraints impacting market growth?
Problems Associated With Storage. Transportation. and Application of Pyrolysis Oil.
8. Can you provide examples of recent developments in the market?
June 2023: Audi Hungaria announced its cooperation with New Energy Kft. to deal with tire waste generated at Audi’s Gyor plant. The process for recycling tire waste was pyrolysis, in which tire waste is chemically converted into oil that petrochemical companies can use to produce new plastics, while the resulting recovered carbon black is utilized in tire production.
9. What pricing options are available for accessing the report?
Pricing options include single-user, multi-user, and enterprise licenses priced at USD 4750, USD 5250, and USD 8750 respectively.
10. Is the market size provided in terms of value or volume?
The market size is provided in terms of value, measured in Million and volume, measured in K Tons.
11. Are there any specific market keywords associated with the report?
Yes, the market keyword associated with the report is "Pyrolysis Oil Market," which aids in identifying and referencing the specific market segment covered.
12. How do I determine which pricing option suits my needs best?
The pricing options vary based on user requirements and access needs. Individual users may opt for single-user licenses, while businesses requiring broader access may choose multi-user or enterprise licenses for cost-effective access to the report.
13. Are there any additional resources or data provided in the Pyrolysis Oil Market report?
While the report offers comprehensive insights, it's advisable to review the specific contents or supplementary materials provided to ascertain if additional resources or data are available.
14. How can I stay updated on further developments or reports in the Pyrolysis Oil Market?
To stay informed about further developments, trends, and reports in the Pyrolysis Oil Market, consider subscribing to industry newsletters, following relevant companies and organizations, or regularly checking reputable industry news sources and publications.
Methodology
Step 1 - Identification of Relevant Samples Size from Population Database


Step 2 - Approaches for Defining Global Market Size (Value, Volume* & Price*)

Note*: In applicable scenarios
Step 3 - Data Sources
Primary Research
- Web Analytics
- Survey Reports
- Research Institute
- Latest Research Reports
- Opinion Leaders
Secondary Research
- Annual Reports
- White Paper
- Latest Press Release
- Industry Association
- Paid Database
- Investor Presentations

Step 4 - Data Triangulation
Involves using different sources of information in order to increase the validity of a study
These sources are likely to be stakeholders in a program - participants, other researchers, program staff, other community members, and so on.
Then we put all data in single framework & apply various statistical tools to find out the dynamic on the market.
During the analysis stage, feedback from the stakeholder groups would be compared to determine areas of agreement as well as areas of divergence