

Key Insights
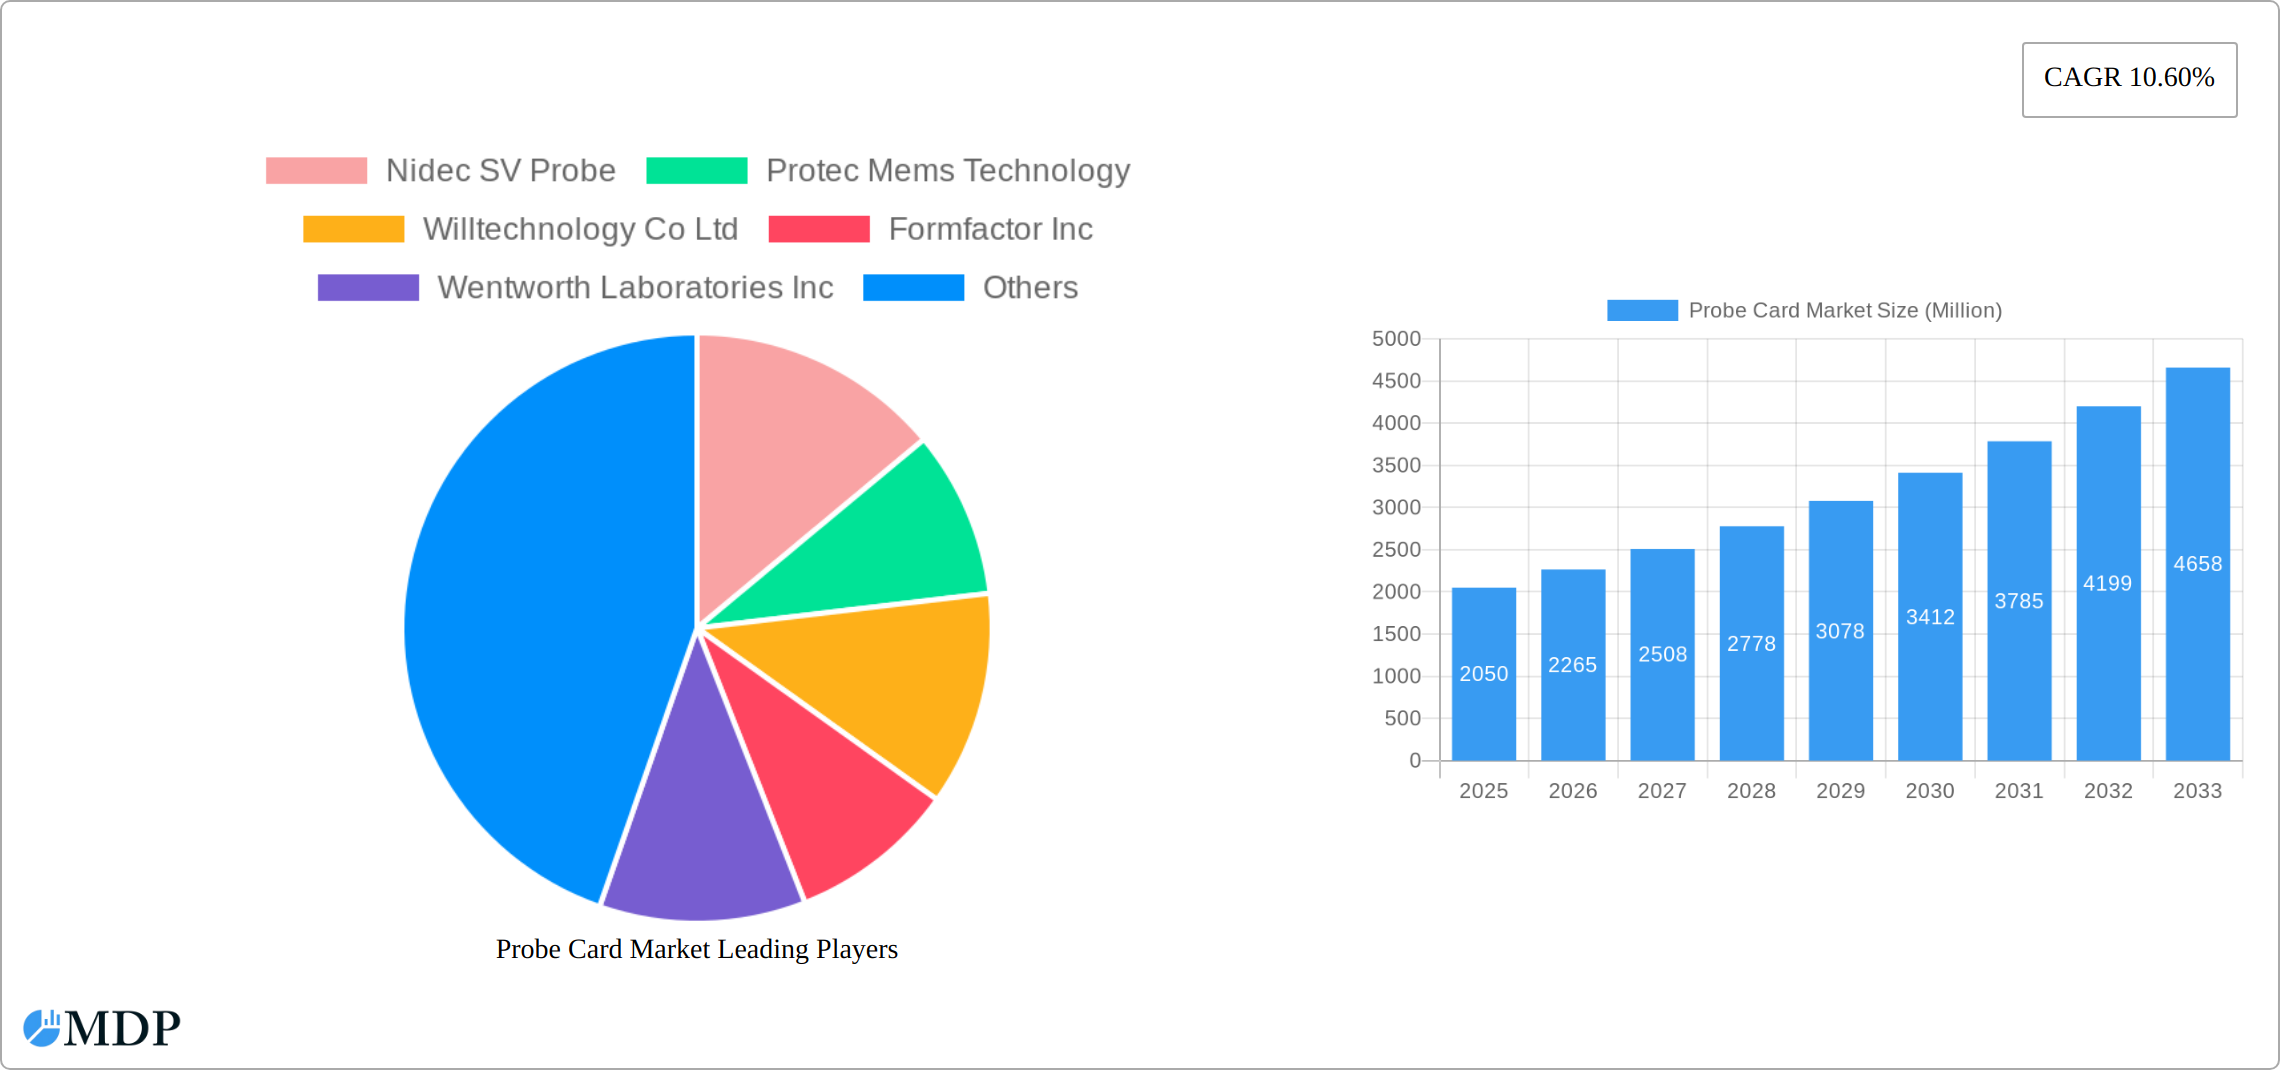
The global probe card market, valued at $2.05 billion in 2025, is projected to experience robust growth, exhibiting a compound annual growth rate (CAGR) of 10.60% from 2025 to 2033. This expansion is fueled by several key factors. The increasing demand for advanced semiconductor devices, particularly in the automotive, 5G, and high-performance computing sectors, is a significant driver. Miniaturization trends in semiconductor packaging necessitate more sophisticated probe cards capable of handling denser chip designs and smaller features, stimulating innovation and market growth. Furthermore, the rising adoption of advanced semiconductor manufacturing techniques, such as advanced node fabrication (e.g., 3nm and beyond), necessitates higher-quality and more specialized probe cards, further contributing to market expansion. Growth is also being seen across various probe card types, including advanced probe cards which offer higher performance and reliability compared to standard options. The shift towards sophisticated applications like DRAM, flash memory, and foundry/logic chips is another key driver. While challenges exist, such as the cyclical nature of the semiconductor industry and potential supply chain disruptions, the long-term outlook for the probe card market remains positive.
Technological advancements within the probe card industry itself, such as the development of MEMS (Microelectromechanical Systems) based probe cards and the continued refinement of cantilever and vertical probe technologies, are also crucial to market growth. The geographic distribution of market share reflects the concentration of semiconductor manufacturing and R&D activities. North America and Asia Pacific (particularly China, Japan, South Korea and Taiwan) are expected to dominate the market due to the presence of major semiconductor manufacturers and significant investments in research and development. However, other regions, like Europe and certain parts of Asia are also experiencing notable growth driven by rising regional semiconductor manufacturing capabilities and increasing investments in infrastructure. Competition among established players like Formfactor, Technoprobe, and Nidec SV Probe, along with emerging innovative companies is fostering innovation and driving down costs, benefiting the overall market. The continued expansion of the semiconductor industry and the associated demand for advanced testing solutions underpin the market's long-term positive trajectory.
Probe Card Market: A Comprehensive Market Analysis Report (2019-2033)
This comprehensive report provides an in-depth analysis of the global Probe Card market, offering invaluable insights for stakeholders across the semiconductor industry. From market dynamics and leading players to emerging opportunities and future growth prospects, this report covers all essential aspects of this crucial technology sector. The study period spans from 2019 to 2033, with 2025 serving as both the base and estimated year. The report's meticulous research and data-driven analysis ensure informed decision-making and strategic planning. The market is expected to reach xx Million by 2033.
Probe Card Market Market Dynamics & Concentration
The Probe Card market is characterized by a moderately concentrated landscape with a few dominant players and numerous smaller specialized firms. Market concentration is influenced by factors such as technological advancements, economies of scale, and the stringent requirements of the semiconductor industry. The market share of the top five players is estimated at xx%, indicating a degree of oligopolistic competition. Recent years have witnessed a moderate level of mergers and acquisitions (M&A) activity, primarily driven by companies seeking to expand their product portfolios and geographic reach. The number of M&A deals in the past five years has averaged approximately xx per year.
Innovation Drivers: Continuous miniaturization of semiconductor devices necessitates ongoing innovation in probe card technology, including advancements in materials science, design methodologies, and manufacturing processes. This constant push for improved performance and reliability fuels market growth.
Regulatory Frameworks: Government regulations and industry standards related to safety and environmental compliance influence the design and manufacturing of probe cards. Adherence to these frameworks is crucial for market participation.
Product Substitutes: While no direct substitutes exist for probe cards in their core application, alternative testing methodologies might emerge, posing potential long-term competition.
End-User Trends: The increasing demand for high-performance computing, artificial intelligence, and 5G technology drives the demand for advanced probe cards capable of testing increasingly complex semiconductor devices.
M&A Activities: Recent M&A activity highlights the strategic importance of consolidation in the market. Larger companies are strategically acquiring smaller, specialized firms to expand their technological capabilities and market presence.
Probe Card Market Industry Trends & Analysis
The Probe Card market is experiencing robust growth, driven by several key factors. The Compound Annual Growth Rate (CAGR) during the forecast period (2025-2033) is projected to be xx%. This growth is primarily fueled by the increasing demand for advanced semiconductor devices across various applications, including consumer electronics, automotive, and industrial automation. Technological disruptions, such as the development of advanced materials and manufacturing processes, continuously improve the performance and reliability of probe cards, further accelerating market penetration. Market penetration in key regions is projected to exceed xx% by 2033. Consumer preferences for faster, smaller, and more energy-efficient electronic devices stimulate demand for advanced semiconductor testing technologies, directly impacting the probe card market. The competitive dynamics are characterized by both collaboration and competition, with leading companies investing heavily in research and development to maintain a technological edge.

Leading Markets & Segments in Probe Card Market
The Asia-Pacific region is currently the dominant market for probe cards, driven primarily by the large concentration of semiconductor manufacturing facilities in countries such as South Korea, Taiwan, and China. This dominance is primarily attributed to the robust growth of the electronics and semiconductor industry in the region, fueled by strong economic growth and government support.
Key Drivers by Region:
- Asia-Pacific: Strong semiconductor manufacturing base, government support for technological advancement, and growing demand for electronics.
- North America: High concentration of leading semiconductor companies and research institutions, fostering innovation and product development.
- Europe: Growing adoption of advanced technologies in various industries, leading to increased demand for advanced probe cards.
Dominant Segments:
- By Technology: MEMS probe cards are experiencing rapid growth due to their superior performance and miniaturization capabilities.
- By Application: The DRAM segment is a key market driver due to the high demand for high-bandwidth memory solutions.
- By Type: The advanced probe card segment is rapidly expanding, driven by the need for high-performance testing capabilities for complex semiconductor devices.
Probe Card Market Product Developments
Recent years have witnessed significant product innovations in the probe card market, focusing on enhancing performance, reliability, and cost-effectiveness. These developments include the introduction of new materials, advanced manufacturing processes, and innovative designs aimed at addressing the challenges associated with testing increasingly complex semiconductor devices. The incorporation of MEMS technology, for example, allows for higher density and improved signal integrity, while new materials enable higher current carrying capabilities. These advancements have led to improved testing accuracy and speed, making them well-suited to meet the demands of the evolving semiconductor industry.
Key Drivers of Probe Card Market Growth
Several factors are propelling the growth of the probe card market. Technological advancements, such as the development of MEMS-based probe cards and improved material science, enhance testing capabilities and efficiency. The increasing demand for high-performance computing, 5G infrastructure, and automotive electronics fuels the demand for advanced semiconductor testing solutions. Furthermore, government initiatives aimed at promoting technological innovation and investment in the semiconductor industry provide further impetus for market expansion.
Challenges in the Probe Card Market Market
The Probe Card market faces challenges, including increasing manufacturing costs, supply chain disruptions impacting material availability, and intense competition among established players and new entrants. These factors can lead to margin pressures and slower growth in certain segments. Stringent regulatory requirements in different countries and regions also pose compliance challenges. The impact of these challenges can be seen in the fluctuation of market growth rates and reduced profit margins for certain companies.
Emerging Opportunities in Probe Card Market
Significant opportunities exist for growth in the probe card market. The rising demand for high-bandwidth memory (HBM) and advanced packaging technologies requires innovative solutions, opening avenues for probe card manufacturers. Strategic partnerships and collaborations between semiconductor companies and probe card manufacturers can drive innovation and market expansion. The exploration of new materials and designs will unlock further efficiency gains and support the testing of even more complex semiconductor devices. Expansion into emerging markets, especially in Asia-Pacific and other rapidly growing economies, can also yield substantial market growth.
Leading Players in the Probe Card Market Sector
- Nidec SV Probe
- Protec Mems Technology
- Willtechnology Co Ltd
- Formfactor Inc
- Wentworth Laboratories Inc
- Japan Electronic Materials Corporation
- Micronics Japan Co Ltd
- TSE Co Lt
- Feinmetall Gmbh
- Star Technologies Inc
- Technoprobe S P A
- Mpi Corporation
- GGB Industries Inc
- Korea Instruments Co Ltd
Key Milestones in Probe Card Market Industry
- January 2024: Samsung establishes a new research laboratory in the United States focused on next-generation 3D-DRAM, boosting demand for advanced probe cards.
- April 2024: FormFactor unveils COMPASS, a presentation highlighting advancements in probe card design to maximize current carrying capacity (CCC), impacting the high-current applications market.
Strategic Outlook for Probe Card Market Market
The Probe Card market is poised for significant growth, driven by technological advancements, increasing demand for advanced semiconductor devices, and strategic investments in research and development. Companies focusing on innovation, strategic partnerships, and expansion into emerging markets will be well-positioned to capitalize on future growth opportunities. The long-term outlook remains positive, with continued growth expected throughout the forecast period.
Probe Card Market Segmentation
-
1. Technology
- 1.1. MEMS
- 1.2. Vertical
- 1.3. Cantilever
- 1.4. Speciality
- 1.5. Other Technologies
-
2. Application
- 2.1. DRAM
- 2.2. Flash
- 2.3. Foundry and Logic
- 2.4. Parametric
- 2.5. Other Applications
-
3. Type
- 3.1. Standard Probe Card
- 3.2. Advanced Probe Card
Probe Card Market Segmentation By Geography
- 1. North America
- 2. Europe
- 3. Asia
- 4. Australia and New Zealand
- 5. Latin America
- 6. Middle East and Africa

Probe Card Market REPORT HIGHLIGHTS
| Aspects | Details |
|---|---|
| Study Period | 2019-2033 |
| Base Year | 2024 |
| Estimated Year | 2025 |
| Forecast Period | 2025-2033 |
| Historical Period | 2019-2024 |
| Growth Rate | CAGR of 10.60% from 2019-2033 |
| Segmentation |
|
Table of Contents
- 1. Introduction
- 1.1. Research Scope
- 1.2. Market Segmentation
- 1.3. Research Methodology
- 1.4. Definitions and Assumptions
- 2. Executive Summary
- 2.1. Introduction
- 3. Market Dynamics
- 3.1. Introduction
- 3.2. Market Drivers
- 3.2.1. Increase in Demand for Consumer Electronics and IOT; Miniaturization of Electronic Products; Technological Advancement And Innovations in Semiconductor Industry
- 3.3. Market Restrains
- 3.3.1. High Costs Associated with Probe Cards; Lack of Awareness Among Consumers Regarding The Benefits of Probe Card Solution
- 3.4. Market Trends
- 3.4.1. MEMS to Dominate the Technology Segment
- 4. Market Factor Analysis
- 4.1. Porters Five Forces
- 4.2. Supply/Value Chain
- 4.3. PESTEL analysis
- 4.4. Market Entropy
- 4.5. Patent/Trademark Analysis
- 5. Global Probe Card Market Analysis, Insights and Forecast, 2019-2031
- 5.1. Market Analysis, Insights and Forecast - by Technology
- 5.1.1. MEMS
- 5.1.2. Vertical
- 5.1.3. Cantilever
- 5.1.4. Speciality
- 5.1.5. Other Technologies
- 5.2. Market Analysis, Insights and Forecast - by Application
- 5.2.1. DRAM
- 5.2.2. Flash
- 5.2.3. Foundry and Logic
- 5.2.4. Parametric
- 5.2.5. Other Applications
- 5.3. Market Analysis, Insights and Forecast - by Type
- 5.3.1. Standard Probe Card
- 5.3.2. Advanced Probe Card
- 5.4. Market Analysis, Insights and Forecast - by Region
- 5.4.1. North America
- 5.4.2. Europe
- 5.4.3. Asia
- 5.4.4. Australia and New Zealand
- 5.4.5. Latin America
- 5.4.6. Middle East and Africa
- 5.1. Market Analysis, Insights and Forecast - by Technology
- 6. North America Probe Card Market Analysis, Insights and Forecast, 2019-2031
- 6.1. Market Analysis, Insights and Forecast - by Technology
- 6.1.1. MEMS
- 6.1.2. Vertical
- 6.1.3. Cantilever
- 6.1.4. Speciality
- 6.1.5. Other Technologies
- 6.2. Market Analysis, Insights and Forecast - by Application
- 6.2.1. DRAM
- 6.2.2. Flash
- 6.2.3. Foundry and Logic
- 6.2.4. Parametric
- 6.2.5. Other Applications
- 6.3. Market Analysis, Insights and Forecast - by Type
- 6.3.1. Standard Probe Card
- 6.3.2. Advanced Probe Card
- 6.1. Market Analysis, Insights and Forecast - by Technology
- 7. Europe Probe Card Market Analysis, Insights and Forecast, 2019-2031
- 7.1. Market Analysis, Insights and Forecast - by Technology
- 7.1.1. MEMS
- 7.1.2. Vertical
- 7.1.3. Cantilever
- 7.1.4. Speciality
- 7.1.5. Other Technologies
- 7.2. Market Analysis, Insights and Forecast - by Application
- 7.2.1. DRAM
- 7.2.2. Flash
- 7.2.3. Foundry and Logic
- 7.2.4. Parametric
- 7.2.5. Other Applications
- 7.3. Market Analysis, Insights and Forecast - by Type
- 7.3.1. Standard Probe Card
- 7.3.2. Advanced Probe Card
- 7.1. Market Analysis, Insights and Forecast - by Technology
- 8. Asia Probe Card Market Analysis, Insights and Forecast, 2019-2031
- 8.1. Market Analysis, Insights and Forecast - by Technology
- 8.1.1. MEMS
- 8.1.2. Vertical
- 8.1.3. Cantilever
- 8.1.4. Speciality
- 8.1.5. Other Technologies
- 8.2. Market Analysis, Insights and Forecast - by Application
- 8.2.1. DRAM
- 8.2.2. Flash
- 8.2.3. Foundry and Logic
- 8.2.4. Parametric
- 8.2.5. Other Applications
- 8.3. Market Analysis, Insights and Forecast - by Type
- 8.3.1. Standard Probe Card
- 8.3.2. Advanced Probe Card
- 8.1. Market Analysis, Insights and Forecast - by Technology
- 9. Australia and New Zealand Probe Card Market Analysis, Insights and Forecast, 2019-2031
- 9.1. Market Analysis, Insights and Forecast - by Technology
- 9.1.1. MEMS
- 9.1.2. Vertical
- 9.1.3. Cantilever
- 9.1.4. Speciality
- 9.1.5. Other Technologies
- 9.2. Market Analysis, Insights and Forecast - by Application
- 9.2.1. DRAM
- 9.2.2. Flash
- 9.2.3. Foundry and Logic
- 9.2.4. Parametric
- 9.2.5. Other Applications
- 9.3. Market Analysis, Insights and Forecast - by Type
- 9.3.1. Standard Probe Card
- 9.3.2. Advanced Probe Card
- 9.1. Market Analysis, Insights and Forecast - by Technology
- 10. Latin America Probe Card Market Analysis, Insights and Forecast, 2019-2031
- 10.1. Market Analysis, Insights and Forecast - by Technology
- 10.1.1. MEMS
- 10.1.2. Vertical
- 10.1.3. Cantilever
- 10.1.4. Speciality
- 10.1.5. Other Technologies
- 10.2. Market Analysis, Insights and Forecast - by Application
- 10.2.1. DRAM
- 10.2.2. Flash
- 10.2.3. Foundry and Logic
- 10.2.4. Parametric
- 10.2.5. Other Applications
- 10.3. Market Analysis, Insights and Forecast - by Type
- 10.3.1. Standard Probe Card
- 10.3.2. Advanced Probe Card
- 10.1. Market Analysis, Insights and Forecast - by Technology
- 11. Middle East and Africa Probe Card Market Analysis, Insights and Forecast, 2019-2031
- 11.1. Market Analysis, Insights and Forecast - by Technology
- 11.1.1. MEMS
- 11.1.2. Vertical
- 11.1.3. Cantilever
- 11.1.4. Speciality
- 11.1.5. Other Technologies
- 11.2. Market Analysis, Insights and Forecast - by Application
- 11.2.1. DRAM
- 11.2.2. Flash
- 11.2.3. Foundry and Logic
- 11.2.4. Parametric
- 11.2.5. Other Applications
- 11.3. Market Analysis, Insights and Forecast - by Type
- 11.3.1. Standard Probe Card
- 11.3.2. Advanced Probe Card
- 11.1. Market Analysis, Insights and Forecast - by Technology
- 12. North America Probe Card Market Analysis, Insights and Forecast, 2019-2031
- 12.1. Market Analysis, Insights and Forecast - By Country/Sub-region
- 12.1.1 United States
- 12.1.2 Canada
- 12.1.3 Mexico
- 13. Europe Probe Card Market Analysis, Insights and Forecast, 2019-2031
- 13.1. Market Analysis, Insights and Forecast - By Country/Sub-region
- 13.1.1 Germany
- 13.1.2 United Kingdom
- 13.1.3 France
- 13.1.4 Spain
- 13.1.5 Italy
- 13.1.6 Spain
- 13.1.7 Belgium
- 13.1.8 Netherland
- 13.1.9 Nordics
- 13.1.10 Rest of Europe
- 14. Asia Pacific Probe Card Market Analysis, Insights and Forecast, 2019-2031
- 14.1. Market Analysis, Insights and Forecast - By Country/Sub-region
- 14.1.1 China
- 14.1.2 Japan
- 14.1.3 India
- 14.1.4 South Korea
- 14.1.5 Southeast Asia
- 14.1.6 Australia
- 14.1.7 Indonesia
- 14.1.8 Phillipes
- 14.1.9 Singapore
- 14.1.10 Thailandc
- 14.1.11 Rest of Asia Pacific
- 15. South America Probe Card Market Analysis, Insights and Forecast, 2019-2031
- 15.1. Market Analysis, Insights and Forecast - By Country/Sub-region
- 15.1.1 Brazil
- 15.1.2 Argentina
- 15.1.3 Peru
- 15.1.4 Chile
- 15.1.5 Colombia
- 15.1.6 Ecuador
- 15.1.7 Venezuela
- 15.1.8 Rest of South America
- 16. North America Probe Card Market Analysis, Insights and Forecast, 2019-2031
- 16.1. Market Analysis, Insights and Forecast - By Country/Sub-region
- 16.1.1 United States
- 16.1.2 Canada
- 16.1.3 Mexico
- 17. MEA Probe Card Market Analysis, Insights and Forecast, 2019-2031
- 17.1. Market Analysis, Insights and Forecast - By Country/Sub-region
- 17.1.1 United Arab Emirates
- 17.1.2 Saudi Arabia
- 17.1.3 South Africa
- 17.1.4 Rest of Middle East and Africa
- 18. Competitive Analysis
- 18.1. Global Market Share Analysis 2024
- 18.2. Company Profiles
- 18.2.1 Nidec SV Probe
- 18.2.1.1. Overview
- 18.2.1.2. Products
- 18.2.1.3. SWOT Analysis
- 18.2.1.4. Recent Developments
- 18.2.1.5. Financials (Based on Availability)
- 18.2.2 Protec Mems Technology
- 18.2.2.1. Overview
- 18.2.2.2. Products
- 18.2.2.3. SWOT Analysis
- 18.2.2.4. Recent Developments
- 18.2.2.5. Financials (Based on Availability)
- 18.2.3 Willtechnology Co Ltd
- 18.2.3.1. Overview
- 18.2.3.2. Products
- 18.2.3.3. SWOT Analysis
- 18.2.3.4. Recent Developments
- 18.2.3.5. Financials (Based on Availability)
- 18.2.4 Formfactor Inc
- 18.2.4.1. Overview
- 18.2.4.2. Products
- 18.2.4.3. SWOT Analysis
- 18.2.4.4. Recent Developments
- 18.2.4.5. Financials (Based on Availability)
- 18.2.5 Wentworth Laboratories Inc
- 18.2.5.1. Overview
- 18.2.5.2. Products
- 18.2.5.3. SWOT Analysis
- 18.2.5.4. Recent Developments
- 18.2.5.5. Financials (Based on Availability)
- 18.2.6 Japan Electronic Materials Corporation
- 18.2.6.1. Overview
- 18.2.6.2. Products
- 18.2.6.3. SWOT Analysis
- 18.2.6.4. Recent Developments
- 18.2.6.5. Financials (Based on Availability)
- 18.2.7 Micronics Japan Co Ltd
- 18.2.7.1. Overview
- 18.2.7.2. Products
- 18.2.7.3. SWOT Analysis
- 18.2.7.4. Recent Developments
- 18.2.7.5. Financials (Based on Availability)
- 18.2.8 TSE Co Lt
- 18.2.8.1. Overview
- 18.2.8.2. Products
- 18.2.8.3. SWOT Analysis
- 18.2.8.4. Recent Developments
- 18.2.8.5. Financials (Based on Availability)
- 18.2.9 Feinmetall Gmbh
- 18.2.9.1. Overview
- 18.2.9.2. Products
- 18.2.9.3. SWOT Analysis
- 18.2.9.4. Recent Developments
- 18.2.9.5. Financials (Based on Availability)
- 18.2.10 Star Technologies Inc
- 18.2.10.1. Overview
- 18.2.10.2. Products
- 18.2.10.3. SWOT Analysis
- 18.2.10.4. Recent Developments
- 18.2.10.5. Financials (Based on Availability)
- 18.2.11 Technoprobe S P A
- 18.2.11.1. Overview
- 18.2.11.2. Products
- 18.2.11.3. SWOT Analysis
- 18.2.11.4. Recent Developments
- 18.2.11.5. Financials (Based on Availability)
- 18.2.12 Mpi Corporation
- 18.2.12.1. Overview
- 18.2.12.2. Products
- 18.2.12.3. SWOT Analysis
- 18.2.12.4. Recent Developments
- 18.2.12.5. Financials (Based on Availability)
- 18.2.13 GGB Industries Inc
- 18.2.13.1. Overview
- 18.2.13.2. Products
- 18.2.13.3. SWOT Analysis
- 18.2.13.4. Recent Developments
- 18.2.13.5. Financials (Based on Availability)
- 18.2.14 Korea Instruments Co Ltd
- 18.2.14.1. Overview
- 18.2.14.2. Products
- 18.2.14.3. SWOT Analysis
- 18.2.14.4. Recent Developments
- 18.2.14.5. Financials (Based on Availability)
- 18.2.1 Nidec SV Probe
List of Figures
- Figure 1: Global Probe Card Market Revenue Breakdown (Million, %) by Region 2024 & 2032
- Figure 2: Global Probe Card Market Volume Breakdown (K Unit, %) by Region 2024 & 2032
- Figure 3: North America Probe Card Market Revenue (Million), by Country 2024 & 2032
- Figure 4: North America Probe Card Market Volume (K Unit), by Country 2024 & 2032
- Figure 5: North America Probe Card Market Revenue Share (%), by Country 2024 & 2032
- Figure 6: North America Probe Card Market Volume Share (%), by Country 2024 & 2032
- Figure 7: Europe Probe Card Market Revenue (Million), by Country 2024 & 2032
- Figure 8: Europe Probe Card Market Volume (K Unit), by Country 2024 & 2032
- Figure 9: Europe Probe Card Market Revenue Share (%), by Country 2024 & 2032
- Figure 10: Europe Probe Card Market Volume Share (%), by Country 2024 & 2032
- Figure 11: Asia Pacific Probe Card Market Revenue (Million), by Country 2024 & 2032
- Figure 12: Asia Pacific Probe Card Market Volume (K Unit), by Country 2024 & 2032
- Figure 13: Asia Pacific Probe Card Market Revenue Share (%), by Country 2024 & 2032
- Figure 14: Asia Pacific Probe Card Market Volume Share (%), by Country 2024 & 2032
- Figure 15: South America Probe Card Market Revenue (Million), by Country 2024 & 2032
- Figure 16: South America Probe Card Market Volume (K Unit), by Country 2024 & 2032
- Figure 17: South America Probe Card Market Revenue Share (%), by Country 2024 & 2032
- Figure 18: South America Probe Card Market Volume Share (%), by Country 2024 & 2032
- Figure 19: North America Probe Card Market Revenue (Million), by Country 2024 & 2032
- Figure 20: North America Probe Card Market Volume (K Unit), by Country 2024 & 2032
- Figure 21: North America Probe Card Market Revenue Share (%), by Country 2024 & 2032
- Figure 22: North America Probe Card Market Volume Share (%), by Country 2024 & 2032
- Figure 23: MEA Probe Card Market Revenue (Million), by Country 2024 & 2032
- Figure 24: MEA Probe Card Market Volume (K Unit), by Country 2024 & 2032
- Figure 25: MEA Probe Card Market Revenue Share (%), by Country 2024 & 2032
- Figure 26: MEA Probe Card Market Volume Share (%), by Country 2024 & 2032
- Figure 27: North America Probe Card Market Revenue (Million), by Technology 2024 & 2032
- Figure 28: North America Probe Card Market Volume (K Unit), by Technology 2024 & 2032
- Figure 29: North America Probe Card Market Revenue Share (%), by Technology 2024 & 2032
- Figure 30: North America Probe Card Market Volume Share (%), by Technology 2024 & 2032
- Figure 31: North America Probe Card Market Revenue (Million), by Application 2024 & 2032
- Figure 32: North America Probe Card Market Volume (K Unit), by Application 2024 & 2032
- Figure 33: North America Probe Card Market Revenue Share (%), by Application 2024 & 2032
- Figure 34: North America Probe Card Market Volume Share (%), by Application 2024 & 2032
- Figure 35: North America Probe Card Market Revenue (Million), by Type 2024 & 2032
- Figure 36: North America Probe Card Market Volume (K Unit), by Type 2024 & 2032
- Figure 37: North America Probe Card Market Revenue Share (%), by Type 2024 & 2032
- Figure 38: North America Probe Card Market Volume Share (%), by Type 2024 & 2032
- Figure 39: North America Probe Card Market Revenue (Million), by Country 2024 & 2032
- Figure 40: North America Probe Card Market Volume (K Unit), by Country 2024 & 2032
- Figure 41: North America Probe Card Market Revenue Share (%), by Country 2024 & 2032
- Figure 42: North America Probe Card Market Volume Share (%), by Country 2024 & 2032
- Figure 43: Europe Probe Card Market Revenue (Million), by Technology 2024 & 2032
- Figure 44: Europe Probe Card Market Volume (K Unit), by Technology 2024 & 2032
- Figure 45: Europe Probe Card Market Revenue Share (%), by Technology 2024 & 2032
- Figure 46: Europe Probe Card Market Volume Share (%), by Technology 2024 & 2032
- Figure 47: Europe Probe Card Market Revenue (Million), by Application 2024 & 2032
- Figure 48: Europe Probe Card Market Volume (K Unit), by Application 2024 & 2032
- Figure 49: Europe Probe Card Market Revenue Share (%), by Application 2024 & 2032
- Figure 50: Europe Probe Card Market Volume Share (%), by Application 2024 & 2032
- Figure 51: Europe Probe Card Market Revenue (Million), by Type 2024 & 2032
- Figure 52: Europe Probe Card Market Volume (K Unit), by Type 2024 & 2032
- Figure 53: Europe Probe Card Market Revenue Share (%), by Type 2024 & 2032
- Figure 54: Europe Probe Card Market Volume Share (%), by Type 2024 & 2032
- Figure 55: Europe Probe Card Market Revenue (Million), by Country 2024 & 2032
- Figure 56: Europe Probe Card Market Volume (K Unit), by Country 2024 & 2032
- Figure 57: Europe Probe Card Market Revenue Share (%), by Country 2024 & 2032
- Figure 58: Europe Probe Card Market Volume Share (%), by Country 2024 & 2032
- Figure 59: Asia Probe Card Market Revenue (Million), by Technology 2024 & 2032
- Figure 60: Asia Probe Card Market Volume (K Unit), by Technology 2024 & 2032
- Figure 61: Asia Probe Card Market Revenue Share (%), by Technology 2024 & 2032
- Figure 62: Asia Probe Card Market Volume Share (%), by Technology 2024 & 2032
- Figure 63: Asia Probe Card Market Revenue (Million), by Application 2024 & 2032
- Figure 64: Asia Probe Card Market Volume (K Unit), by Application 2024 & 2032
- Figure 65: Asia Probe Card Market Revenue Share (%), by Application 2024 & 2032
- Figure 66: Asia Probe Card Market Volume Share (%), by Application 2024 & 2032
- Figure 67: Asia Probe Card Market Revenue (Million), by Type 2024 & 2032
- Figure 68: Asia Probe Card Market Volume (K Unit), by Type 2024 & 2032
- Figure 69: Asia Probe Card Market Revenue Share (%), by Type 2024 & 2032
- Figure 70: Asia Probe Card Market Volume Share (%), by Type 2024 & 2032
- Figure 71: Asia Probe Card Market Revenue (Million), by Country 2024 & 2032
- Figure 72: Asia Probe Card Market Volume (K Unit), by Country 2024 & 2032
- Figure 73: Asia Probe Card Market Revenue Share (%), by Country 2024 & 2032
- Figure 74: Asia Probe Card Market Volume Share (%), by Country 2024 & 2032
- Figure 75: Australia and New Zealand Probe Card Market Revenue (Million), by Technology 2024 & 2032
- Figure 76: Australia and New Zealand Probe Card Market Volume (K Unit), by Technology 2024 & 2032
- Figure 77: Australia and New Zealand Probe Card Market Revenue Share (%), by Technology 2024 & 2032
- Figure 78: Australia and New Zealand Probe Card Market Volume Share (%), by Technology 2024 & 2032
- Figure 79: Australia and New Zealand Probe Card Market Revenue (Million), by Application 2024 & 2032
- Figure 80: Australia and New Zealand Probe Card Market Volume (K Unit), by Application 2024 & 2032
- Figure 81: Australia and New Zealand Probe Card Market Revenue Share (%), by Application 2024 & 2032
- Figure 82: Australia and New Zealand Probe Card Market Volume Share (%), by Application 2024 & 2032
- Figure 83: Australia and New Zealand Probe Card Market Revenue (Million), by Type 2024 & 2032
- Figure 84: Australia and New Zealand Probe Card Market Volume (K Unit), by Type 2024 & 2032
- Figure 85: Australia and New Zealand Probe Card Market Revenue Share (%), by Type 2024 & 2032
- Figure 86: Australia and New Zealand Probe Card Market Volume Share (%), by Type 2024 & 2032
- Figure 87: Australia and New Zealand Probe Card Market Revenue (Million), by Country 2024 & 2032
- Figure 88: Australia and New Zealand Probe Card Market Volume (K Unit), by Country 2024 & 2032
- Figure 89: Australia and New Zealand Probe Card Market Revenue Share (%), by Country 2024 & 2032
- Figure 90: Australia and New Zealand Probe Card Market Volume Share (%), by Country 2024 & 2032
- Figure 91: Latin America Probe Card Market Revenue (Million), by Technology 2024 & 2032
- Figure 92: Latin America Probe Card Market Volume (K Unit), by Technology 2024 & 2032
- Figure 93: Latin America Probe Card Market Revenue Share (%), by Technology 2024 & 2032
- Figure 94: Latin America Probe Card Market Volume Share (%), by Technology 2024 & 2032
- Figure 95: Latin America Probe Card Market Revenue (Million), by Application 2024 & 2032
- Figure 96: Latin America Probe Card Market Volume (K Unit), by Application 2024 & 2032
- Figure 97: Latin America Probe Card Market Revenue Share (%), by Application 2024 & 2032
- Figure 98: Latin America Probe Card Market Volume Share (%), by Application 2024 & 2032
- Figure 99: Latin America Probe Card Market Revenue (Million), by Type 2024 & 2032
- Figure 100: Latin America Probe Card Market Volume (K Unit), by Type 2024 & 2032
- Figure 101: Latin America Probe Card Market Revenue Share (%), by Type 2024 & 2032
- Figure 102: Latin America Probe Card Market Volume Share (%), by Type 2024 & 2032
- Figure 103: Latin America Probe Card Market Revenue (Million), by Country 2024 & 2032
- Figure 104: Latin America Probe Card Market Volume (K Unit), by Country 2024 & 2032
- Figure 105: Latin America Probe Card Market Revenue Share (%), by Country 2024 & 2032
- Figure 106: Latin America Probe Card Market Volume Share (%), by Country 2024 & 2032
- Figure 107: Middle East and Africa Probe Card Market Revenue (Million), by Technology 2024 & 2032
- Figure 108: Middle East and Africa Probe Card Market Volume (K Unit), by Technology 2024 & 2032
- Figure 109: Middle East and Africa Probe Card Market Revenue Share (%), by Technology 2024 & 2032
- Figure 110: Middle East and Africa Probe Card Market Volume Share (%), by Technology 2024 & 2032
- Figure 111: Middle East and Africa Probe Card Market Revenue (Million), by Application 2024 & 2032
- Figure 112: Middle East and Africa Probe Card Market Volume (K Unit), by Application 2024 & 2032
- Figure 113: Middle East and Africa Probe Card Market Revenue Share (%), by Application 2024 & 2032
- Figure 114: Middle East and Africa Probe Card Market Volume Share (%), by Application 2024 & 2032
- Figure 115: Middle East and Africa Probe Card Market Revenue (Million), by Type 2024 & 2032
- Figure 116: Middle East and Africa Probe Card Market Volume (K Unit), by Type 2024 & 2032
- Figure 117: Middle East and Africa Probe Card Market Revenue Share (%), by Type 2024 & 2032
- Figure 118: Middle East and Africa Probe Card Market Volume Share (%), by Type 2024 & 2032
- Figure 119: Middle East and Africa Probe Card Market Revenue (Million), by Country 2024 & 2032
- Figure 120: Middle East and Africa Probe Card Market Volume (K Unit), by Country 2024 & 2032
- Figure 121: Middle East and Africa Probe Card Market Revenue Share (%), by Country 2024 & 2032
- Figure 122: Middle East and Africa Probe Card Market Volume Share (%), by Country 2024 & 2032
List of Tables
- Table 1: Global Probe Card Market Revenue Million Forecast, by Region 2019 & 2032
- Table 2: Global Probe Card Market Volume K Unit Forecast, by Region 2019 & 2032
- Table 3: Global Probe Card Market Revenue Million Forecast, by Technology 2019 & 2032
- Table 4: Global Probe Card Market Volume K Unit Forecast, by Technology 2019 & 2032
- Table 5: Global Probe Card Market Revenue Million Forecast, by Application 2019 & 2032
- Table 6: Global Probe Card Market Volume K Unit Forecast, by Application 2019 & 2032
- Table 7: Global Probe Card Market Revenue Million Forecast, by Type 2019 & 2032
- Table 8: Global Probe Card Market Volume K Unit Forecast, by Type 2019 & 2032
- Table 9: Global Probe Card Market Revenue Million Forecast, by Region 2019 & 2032
- Table 10: Global Probe Card Market Volume K Unit Forecast, by Region 2019 & 2032
- Table 11: Global Probe Card Market Revenue Million Forecast, by Country 2019 & 2032
- Table 12: Global Probe Card Market Volume K Unit Forecast, by Country 2019 & 2032
- Table 13: United States Probe Card Market Revenue (Million) Forecast, by Application 2019 & 2032
- Table 14: United States Probe Card Market Volume (K Unit) Forecast, by Application 2019 & 2032
- Table 15: Canada Probe Card Market Revenue (Million) Forecast, by Application 2019 & 2032
- Table 16: Canada Probe Card Market Volume (K Unit) Forecast, by Application 2019 & 2032
- Table 17: Mexico Probe Card Market Revenue (Million) Forecast, by Application 2019 & 2032
- Table 18: Mexico Probe Card Market Volume (K Unit) Forecast, by Application 2019 & 2032
- Table 19: Global Probe Card Market Revenue Million Forecast, by Country 2019 & 2032
- Table 20: Global Probe Card Market Volume K Unit Forecast, by Country 2019 & 2032
- Table 21: Germany Probe Card Market Revenue (Million) Forecast, by Application 2019 & 2032
- Table 22: Germany Probe Card Market Volume (K Unit) Forecast, by Application 2019 & 2032
- Table 23: United Kingdom Probe Card Market Revenue (Million) Forecast, by Application 2019 & 2032
- Table 24: United Kingdom Probe Card Market Volume (K Unit) Forecast, by Application 2019 & 2032
- Table 25: France Probe Card Market Revenue (Million) Forecast, by Application 2019 & 2032
- Table 26: France Probe Card Market Volume (K Unit) Forecast, by Application 2019 & 2032
- Table 27: Spain Probe Card Market Revenue (Million) Forecast, by Application 2019 & 2032
- Table 28: Spain Probe Card Market Volume (K Unit) Forecast, by Application 2019 & 2032
- Table 29: Italy Probe Card Market Revenue (Million) Forecast, by Application 2019 & 2032
- Table 30: Italy Probe Card Market Volume (K Unit) Forecast, by Application 2019 & 2032
- Table 31: Spain Probe Card Market Revenue (Million) Forecast, by Application 2019 & 2032
- Table 32: Spain Probe Card Market Volume (K Unit) Forecast, by Application 2019 & 2032
- Table 33: Belgium Probe Card Market Revenue (Million) Forecast, by Application 2019 & 2032
- Table 34: Belgium Probe Card Market Volume (K Unit) Forecast, by Application 2019 & 2032
- Table 35: Netherland Probe Card Market Revenue (Million) Forecast, by Application 2019 & 2032
- Table 36: Netherland Probe Card Market Volume (K Unit) Forecast, by Application 2019 & 2032
- Table 37: Nordics Probe Card Market Revenue (Million) Forecast, by Application 2019 & 2032
- Table 38: Nordics Probe Card Market Volume (K Unit) Forecast, by Application 2019 & 2032
- Table 39: Rest of Europe Probe Card Market Revenue (Million) Forecast, by Application 2019 & 2032
- Table 40: Rest of Europe Probe Card Market Volume (K Unit) Forecast, by Application 2019 & 2032
- Table 41: Global Probe Card Market Revenue Million Forecast, by Country 2019 & 2032
- Table 42: Global Probe Card Market Volume K Unit Forecast, by Country 2019 & 2032
- Table 43: China Probe Card Market Revenue (Million) Forecast, by Application 2019 & 2032
- Table 44: China Probe Card Market Volume (K Unit) Forecast, by Application 2019 & 2032
- Table 45: Japan Probe Card Market Revenue (Million) Forecast, by Application 2019 & 2032
- Table 46: Japan Probe Card Market Volume (K Unit) Forecast, by Application 2019 & 2032
- Table 47: India Probe Card Market Revenue (Million) Forecast, by Application 2019 & 2032
- Table 48: India Probe Card Market Volume (K Unit) Forecast, by Application 2019 & 2032
- Table 49: South Korea Probe Card Market Revenue (Million) Forecast, by Application 2019 & 2032
- Table 50: South Korea Probe Card Market Volume (K Unit) Forecast, by Application 2019 & 2032
- Table 51: Southeast Asia Probe Card Market Revenue (Million) Forecast, by Application 2019 & 2032
- Table 52: Southeast Asia Probe Card Market Volume (K Unit) Forecast, by Application 2019 & 2032
- Table 53: Australia Probe Card Market Revenue (Million) Forecast, by Application 2019 & 2032
- Table 54: Australia Probe Card Market Volume (K Unit) Forecast, by Application 2019 & 2032
- Table 55: Indonesia Probe Card Market Revenue (Million) Forecast, by Application 2019 & 2032
- Table 56: Indonesia Probe Card Market Volume (K Unit) Forecast, by Application 2019 & 2032
- Table 57: Phillipes Probe Card Market Revenue (Million) Forecast, by Application 2019 & 2032
- Table 58: Phillipes Probe Card Market Volume (K Unit) Forecast, by Application 2019 & 2032
- Table 59: Singapore Probe Card Market Revenue (Million) Forecast, by Application 2019 & 2032
- Table 60: Singapore Probe Card Market Volume (K Unit) Forecast, by Application 2019 & 2032
- Table 61: Thailandc Probe Card Market Revenue (Million) Forecast, by Application 2019 & 2032
- Table 62: Thailandc Probe Card Market Volume (K Unit) Forecast, by Application 2019 & 2032
- Table 63: Rest of Asia Pacific Probe Card Market Revenue (Million) Forecast, by Application 2019 & 2032
- Table 64: Rest of Asia Pacific Probe Card Market Volume (K Unit) Forecast, by Application 2019 & 2032
- Table 65: Global Probe Card Market Revenue Million Forecast, by Country 2019 & 2032
- Table 66: Global Probe Card Market Volume K Unit Forecast, by Country 2019 & 2032
- Table 67: Brazil Probe Card Market Revenue (Million) Forecast, by Application 2019 & 2032
- Table 68: Brazil Probe Card Market Volume (K Unit) Forecast, by Application 2019 & 2032
- Table 69: Argentina Probe Card Market Revenue (Million) Forecast, by Application 2019 & 2032
- Table 70: Argentina Probe Card Market Volume (K Unit) Forecast, by Application 2019 & 2032
- Table 71: Peru Probe Card Market Revenue (Million) Forecast, by Application 2019 & 2032
- Table 72: Peru Probe Card Market Volume (K Unit) Forecast, by Application 2019 & 2032
- Table 73: Chile Probe Card Market Revenue (Million) Forecast, by Application 2019 & 2032
- Table 74: Chile Probe Card Market Volume (K Unit) Forecast, by Application 2019 & 2032
- Table 75: Colombia Probe Card Market Revenue (Million) Forecast, by Application 2019 & 2032
- Table 76: Colombia Probe Card Market Volume (K Unit) Forecast, by Application 2019 & 2032
- Table 77: Ecuador Probe Card Market Revenue (Million) Forecast, by Application 2019 & 2032
- Table 78: Ecuador Probe Card Market Volume (K Unit) Forecast, by Application 2019 & 2032
- Table 79: Venezuela Probe Card Market Revenue (Million) Forecast, by Application 2019 & 2032
- Table 80: Venezuela Probe Card Market Volume (K Unit) Forecast, by Application 2019 & 2032
- Table 81: Rest of South America Probe Card Market Revenue (Million) Forecast, by Application 2019 & 2032
- Table 82: Rest of South America Probe Card Market Volume (K Unit) Forecast, by Application 2019 & 2032
- Table 83: Global Probe Card Market Revenue Million Forecast, by Country 2019 & 2032
- Table 84: Global Probe Card Market Volume K Unit Forecast, by Country 2019 & 2032
- Table 85: United States Probe Card Market Revenue (Million) Forecast, by Application 2019 & 2032
- Table 86: United States Probe Card Market Volume (K Unit) Forecast, by Application 2019 & 2032
- Table 87: Canada Probe Card Market Revenue (Million) Forecast, by Application 2019 & 2032
- Table 88: Canada Probe Card Market Volume (K Unit) Forecast, by Application 2019 & 2032
- Table 89: Mexico Probe Card Market Revenue (Million) Forecast, by Application 2019 & 2032
- Table 90: Mexico Probe Card Market Volume (K Unit) Forecast, by Application 2019 & 2032
- Table 91: Global Probe Card Market Revenue Million Forecast, by Country 2019 & 2032
- Table 92: Global Probe Card Market Volume K Unit Forecast, by Country 2019 & 2032
- Table 93: United Arab Emirates Probe Card Market Revenue (Million) Forecast, by Application 2019 & 2032
- Table 94: United Arab Emirates Probe Card Market Volume (K Unit) Forecast, by Application 2019 & 2032
- Table 95: Saudi Arabia Probe Card Market Revenue (Million) Forecast, by Application 2019 & 2032
- Table 96: Saudi Arabia Probe Card Market Volume (K Unit) Forecast, by Application 2019 & 2032
- Table 97: South Africa Probe Card Market Revenue (Million) Forecast, by Application 2019 & 2032
- Table 98: South Africa Probe Card Market Volume (K Unit) Forecast, by Application 2019 & 2032
- Table 99: Rest of Middle East and Africa Probe Card Market Revenue (Million) Forecast, by Application 2019 & 2032
- Table 100: Rest of Middle East and Africa Probe Card Market Volume (K Unit) Forecast, by Application 2019 & 2032
- Table 101: Global Probe Card Market Revenue Million Forecast, by Technology 2019 & 2032
- Table 102: Global Probe Card Market Volume K Unit Forecast, by Technology 2019 & 2032
- Table 103: Global Probe Card Market Revenue Million Forecast, by Application 2019 & 2032
- Table 104: Global Probe Card Market Volume K Unit Forecast, by Application 2019 & 2032
- Table 105: Global Probe Card Market Revenue Million Forecast, by Type 2019 & 2032
- Table 106: Global Probe Card Market Volume K Unit Forecast, by Type 2019 & 2032
- Table 107: Global Probe Card Market Revenue Million Forecast, by Country 2019 & 2032
- Table 108: Global Probe Card Market Volume K Unit Forecast, by Country 2019 & 2032
- Table 109: Global Probe Card Market Revenue Million Forecast, by Technology 2019 & 2032
- Table 110: Global Probe Card Market Volume K Unit Forecast, by Technology 2019 & 2032
- Table 111: Global Probe Card Market Revenue Million Forecast, by Application 2019 & 2032
- Table 112: Global Probe Card Market Volume K Unit Forecast, by Application 2019 & 2032
- Table 113: Global Probe Card Market Revenue Million Forecast, by Type 2019 & 2032
- Table 114: Global Probe Card Market Volume K Unit Forecast, by Type 2019 & 2032
- Table 115: Global Probe Card Market Revenue Million Forecast, by Country 2019 & 2032
- Table 116: Global Probe Card Market Volume K Unit Forecast, by Country 2019 & 2032
- Table 117: Global Probe Card Market Revenue Million Forecast, by Technology 2019 & 2032
- Table 118: Global Probe Card Market Volume K Unit Forecast, by Technology 2019 & 2032
- Table 119: Global Probe Card Market Revenue Million Forecast, by Application 2019 & 2032
- Table 120: Global Probe Card Market Volume K Unit Forecast, by Application 2019 & 2032
- Table 121: Global Probe Card Market Revenue Million Forecast, by Type 2019 & 2032
- Table 122: Global Probe Card Market Volume K Unit Forecast, by Type 2019 & 2032
- Table 123: Global Probe Card Market Revenue Million Forecast, by Country 2019 & 2032
- Table 124: Global Probe Card Market Volume K Unit Forecast, by Country 2019 & 2032
- Table 125: Global Probe Card Market Revenue Million Forecast, by Technology 2019 & 2032
- Table 126: Global Probe Card Market Volume K Unit Forecast, by Technology 2019 & 2032
- Table 127: Global Probe Card Market Revenue Million Forecast, by Application 2019 & 2032
- Table 128: Global Probe Card Market Volume K Unit Forecast, by Application 2019 & 2032
- Table 129: Global Probe Card Market Revenue Million Forecast, by Type 2019 & 2032
- Table 130: Global Probe Card Market Volume K Unit Forecast, by Type 2019 & 2032
- Table 131: Global Probe Card Market Revenue Million Forecast, by Country 2019 & 2032
- Table 132: Global Probe Card Market Volume K Unit Forecast, by Country 2019 & 2032
- Table 133: Global Probe Card Market Revenue Million Forecast, by Technology 2019 & 2032
- Table 134: Global Probe Card Market Volume K Unit Forecast, by Technology 2019 & 2032
- Table 135: Global Probe Card Market Revenue Million Forecast, by Application 2019 & 2032
- Table 136: Global Probe Card Market Volume K Unit Forecast, by Application 2019 & 2032
- Table 137: Global Probe Card Market Revenue Million Forecast, by Type 2019 & 2032
- Table 138: Global Probe Card Market Volume K Unit Forecast, by Type 2019 & 2032
- Table 139: Global Probe Card Market Revenue Million Forecast, by Country 2019 & 2032
- Table 140: Global Probe Card Market Volume K Unit Forecast, by Country 2019 & 2032
- Table 141: Global Probe Card Market Revenue Million Forecast, by Technology 2019 & 2032
- Table 142: Global Probe Card Market Volume K Unit Forecast, by Technology 2019 & 2032
- Table 143: Global Probe Card Market Revenue Million Forecast, by Application 2019 & 2032
- Table 144: Global Probe Card Market Volume K Unit Forecast, by Application 2019 & 2032
- Table 145: Global Probe Card Market Revenue Million Forecast, by Type 2019 & 2032
- Table 146: Global Probe Card Market Volume K Unit Forecast, by Type 2019 & 2032
- Table 147: Global Probe Card Market Revenue Million Forecast, by Country 2019 & 2032
- Table 148: Global Probe Card Market Volume K Unit Forecast, by Country 2019 & 2032
Frequently Asked Questions
1. What is the projected Compound Annual Growth Rate (CAGR) of the Probe Card Market?
The projected CAGR is approximately 10.60%.
2. Which companies are prominent players in the Probe Card Market?
Key companies in the market include Nidec SV Probe, Protec Mems Technology, Willtechnology Co Ltd, Formfactor Inc, Wentworth Laboratories Inc, Japan Electronic Materials Corporation, Micronics Japan Co Ltd, TSE Co Lt, Feinmetall Gmbh, Star Technologies Inc, Technoprobe S P A, Mpi Corporation, GGB Industries Inc, Korea Instruments Co Ltd.
3. What are the main segments of the Probe Card Market?
The market segments include Technology, Application, Type.
4. Can you provide details about the market size?
The market size is estimated to be USD 2.05 Million as of 2022.
5. What are some drivers contributing to market growth?
Increase in Demand for Consumer Electronics and IOT; Miniaturization of Electronic Products; Technological Advancement And Innovations in Semiconductor Industry.
6. What are the notable trends driving market growth?
MEMS to Dominate the Technology Segment.
7. Are there any restraints impacting market growth?
High Costs Associated with Probe Cards; Lack of Awareness Among Consumers Regarding The Benefits of Probe Card Solution.
8. Can you provide examples of recent developments in the market?
April 2024 - FormFactor released a new presentation called COMPASS, focusing on maximizing CCC in a Probe Card and the journey toward an Unburnable Probe. The presentation explores different tactics for probe card design to enhance CCC to achieve an effective CCC above 2.5A at an 80-um minimum pitch. The strategies mentioned involve implementing new probe designs and architectural improvements to maintain probe integrity in high-stress, high-current conditions.
9. What pricing options are available for accessing the report?
Pricing options include single-user, multi-user, and enterprise licenses priced at USD 4750, USD 5250, and USD 8750 respectively.
10. Is the market size provided in terms of value or volume?
The market size is provided in terms of value, measured in Million and volume, measured in K Unit.
11. Are there any specific market keywords associated with the report?
Yes, the market keyword associated with the report is "Probe Card Market," which aids in identifying and referencing the specific market segment covered.
12. How do I determine which pricing option suits my needs best?
The pricing options vary based on user requirements and access needs. Individual users may opt for single-user licenses, while businesses requiring broader access may choose multi-user or enterprise licenses for cost-effective access to the report.
13. Are there any additional resources or data provided in the Probe Card Market report?
While the report offers comprehensive insights, it's advisable to review the specific contents or supplementary materials provided to ascertain if additional resources or data are available.
14. How can I stay updated on further developments or reports in the Probe Card Market?
To stay informed about further developments, trends, and reports in the Probe Card Market, consider subscribing to industry newsletters, following relevant companies and organizations, or regularly checking reputable industry news sources and publications.
Methodology
Step 1 - Identification of Relevant Samples Size from Population Database


Step 2 - Approaches for Defining Global Market Size (Value, Volume* & Price*)

Note*: In applicable scenarios
Step 3 - Data Sources
Primary Research
- Web Analytics
- Survey Reports
- Research Institute
- Latest Research Reports
- Opinion Leaders
Secondary Research
- Annual Reports
- White Paper
- Latest Press Release
- Industry Association
- Paid Database
- Investor Presentations

Step 4 - Data Triangulation
Involves using different sources of information in order to increase the validity of a study
These sources are likely to be stakeholders in a program - participants, other researchers, program staff, other community members, and so on.
Then we put all data in single framework & apply various statistical tools to find out the dynamic on the market.
During the analysis stage, feedback from the stakeholder groups would be compared to determine areas of agreement as well as areas of divergence
