

Key Insights
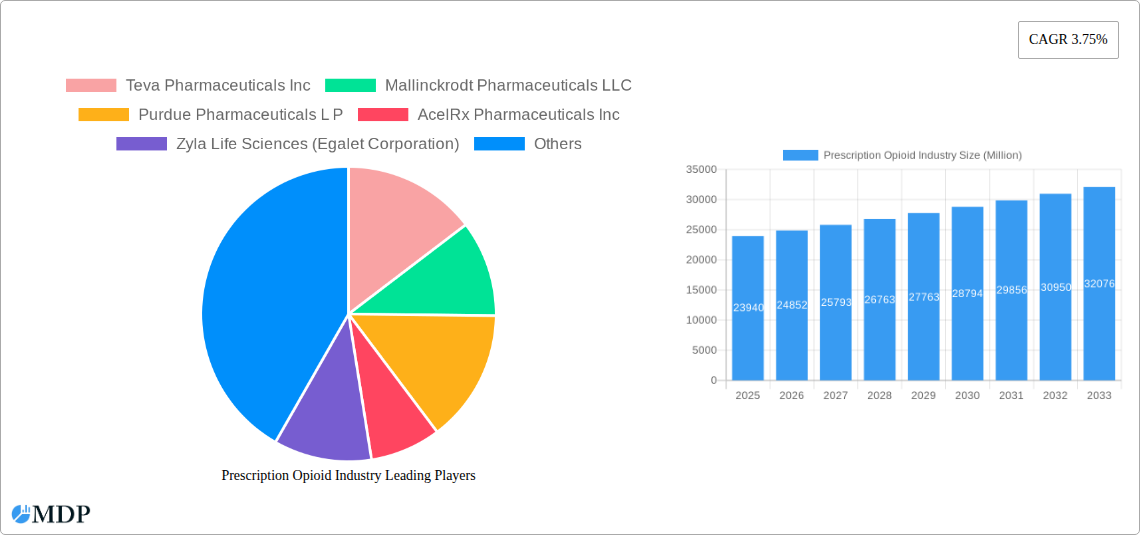
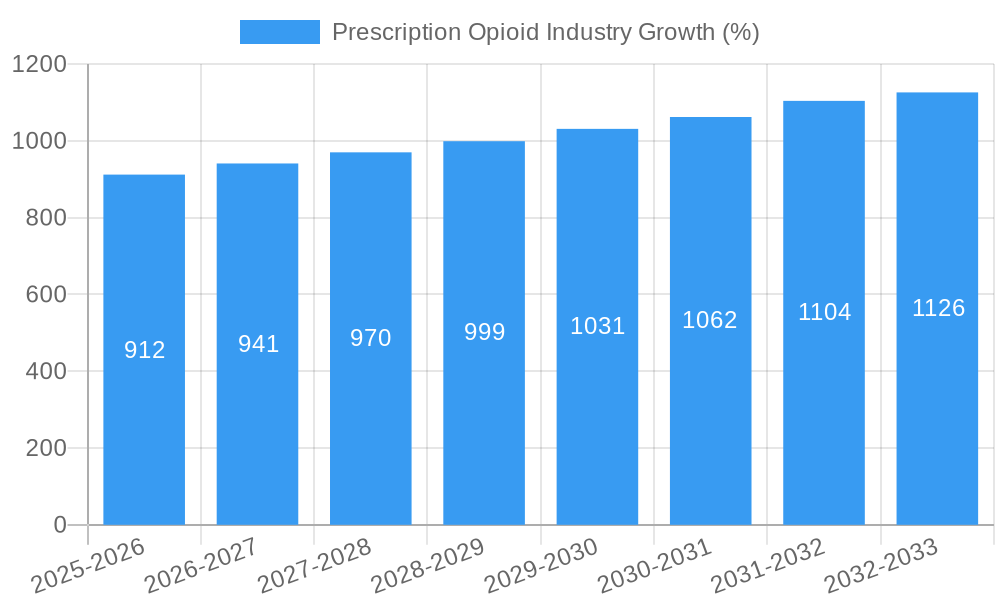
The global prescription opioid market, valued at $23.94 billion in 2025, is projected to experience steady growth, driven by a persistent need for effective pain management solutions, particularly for chronic conditions like arthritis and cancer. The market's 3.75% CAGR from 2019 to 2024 suggests a continued, albeit moderate, expansion through 2033. Key growth drivers include an aging global population with increased susceptibility to chronic pain, the rising prevalence of opioid-responsive conditions, and ongoing research into improved opioid formulations with reduced side effects. However, the market faces significant headwinds, primarily stemming from stringent regulations aimed at curbing opioid abuse and misuse, leading to increased scrutiny and stricter prescribing practices. This regulatory pressure is likely to moderate market growth, impacting the sales of high-potency opioids like fentanyl while potentially boosting the demand for safer alternatives and non-opioid pain management therapies. Market segmentation reveals a diverse landscape, with pain management dominating applications, while strong agonists like fentanyl and morphine command significant shares within product types. Regional variations reflect differing healthcare systems and regulatory environments, with North America and Europe holding considerable market shares. Competitive dynamics are intense, with major pharmaceutical companies actively involved in research, development, and distribution of opioid analgesics, constantly navigating the balance between providing effective pain relief and mitigating the risk of addiction and misuse.
The ongoing evolution of the prescription opioid market hinges on striking a delicate balance between addressing the substantial unmet need for pain management and mitigating the risks associated with opioid use. Innovative strategies focusing on improved formulations, safer delivery systems, and enhanced patient monitoring are crucial for sustainable market growth. Furthermore, a greater emphasis on responsible prescribing practices, coupled with expanded access to non-opioid pain management options, is expected to shape future market trends. This will necessitate a collaborative approach involving pharmaceutical companies, healthcare professionals, regulatory bodies, and patients to find a pathway towards effective pain management while minimizing the risk of abuse and harm. The development of new, non-addictive analgesics poses both a challenge and an opportunity for existing market players. Successful navigation of these complex factors will determine the trajectory of this vital, albeit sensitive, sector.
Prescription Opioid Industry Market Report: 2019-2033
This comprehensive report provides a detailed analysis of the global prescription opioid market, offering invaluable insights for stakeholders across the pharmaceutical industry. Covering the period 2019-2033, with a focus on 2025, this report examines market dynamics, leading players, emerging trends, and future opportunities within this complex and evolving sector. The report utilizes rigorous data analysis to project a xx Million market value by 2033, providing crucial information for strategic decision-making.
Prescription Opioid Industry Market Dynamics & Concentration
The prescription opioid market, valued at xx Million in 2024, exhibits a moderately concentrated structure with a few major players holding significant market share. Market concentration is influenced by factors including regulatory hurdles, stringent approvals processes, and high barriers to entry for new competitors. Innovation in opioid formulations, particularly those focused on reducing abuse potential and improving safety profiles, represents a key driver of growth. The regulatory landscape is constantly evolving, with agencies like the FDA actively monitoring opioid prescribing practices and implementing stricter controls. This regulatory pressure, alongside the rise of opioid alternatives and a shift towards non-opioid pain management strategies, influences market dynamics significantly. Mergers and acquisitions (M&A) activity within the industry has been relatively moderate in recent years, with a total of xx M&A deals recorded between 2019 and 2024. Key M&A drivers include portfolio diversification and expansion into newer opioid formulations. End-user trends show a growing preference for improved safety profiles and extended-release formulations, driving demand for innovative products.
- Market Share: Top 5 companies hold approximately xx% of the market share.
- M&A Activity: xx deals between 2019-2024, primarily focused on strategic acquisitions of smaller companies specializing in novel opioid formulations.
- Regulatory Framework: Stringent regulations and evolving guidelines impacting product approvals and prescribing practices.
- Product Substitutes: Increased competition from non-opioid analgesics and alternative pain management therapies.
Prescription Opioid Industry Industry Trends & Analysis
The prescription opioid market is characterized by a complex interplay of factors driving its growth and evolution. While overall market growth may be slowing due to increased regulatory scrutiny and concerns about opioid abuse, the market remains significant, exhibiting a CAGR of xx% during the forecast period (2025-2033). This is largely driven by technological advancements in formulation and delivery systems leading to improved efficacy and reduced side effects. Consumer preferences are shifting towards safer and more effective formulations, fostering demand for extended-release and abuse-deterrent opioids. However, this positive trend is countered by the increasing adoption of non-opioid pain management methods, which is impacting market penetration and overall growth rates. Competition among established players is intensifying, pushing innovation and fostering a focus on differentiation through unique product features and formulations.
Leading Markets & Segments in Prescription Opioid Industry
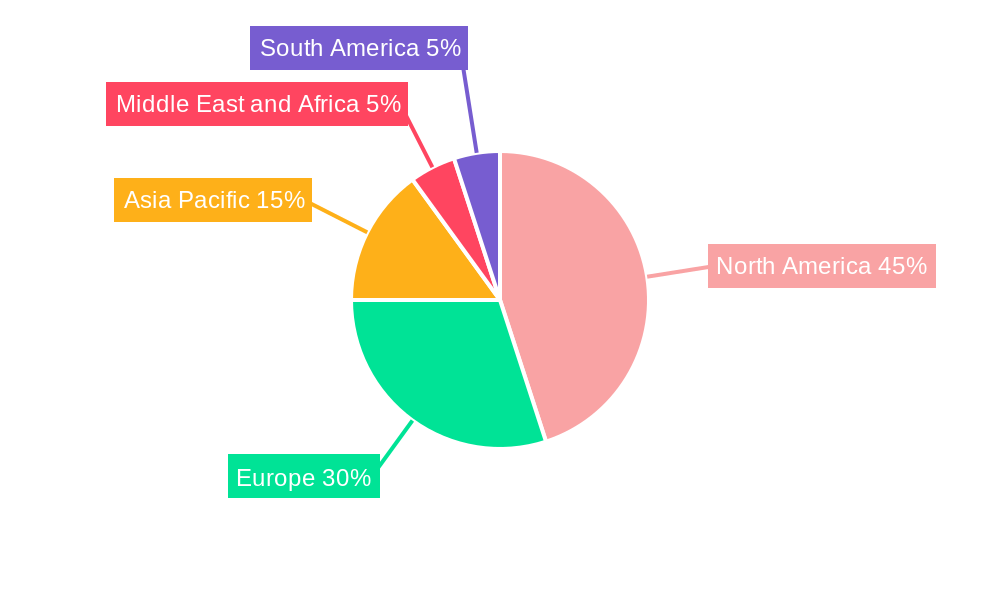
The North American market continues to dominate the global prescription opioid landscape, accounting for approximately xx% of the total market value in 2024. This dominance is attributed to a number of factors, including high rates of chronic pain conditions, established healthcare infrastructure, and relatively high per capita healthcare spending. Within product types, Fentanyl holds the largest market share (xx%), followed by Morphine (xx%) and Oxycodone (xx%). In terms of receptor binding, Strong Agonists currently dominate, but there's a growing market segment for Mild to Moderate Agonists due to their potentially reduced side-effect profile. Pain management remains the primary application, though new applications are constantly being explored.
- Key Drivers for North American Dominance:
- High prevalence of chronic pain conditions.
- Well-established healthcare infrastructure.
- High per capita healthcare expenditure.
- Segment Dominance:
- Product Type: Fentanyl
- Receptor Binding: Strong Agonist
- Application: Pain Management
Prescription Opioid Industry Product Developments
Recent product developments within the prescription opioid industry are largely focused on addressing the critical issues of abuse potential and safety. This includes innovative formulations, such as extended-release opioids with abuse-deterrent properties, and the development of novel analgesics designed to minimize the risk of addiction. Companies are exploring new drug delivery systems to enhance efficacy and reduce side effects, while also adapting to the increasing regulatory scrutiny of opioid-based products.
Key Drivers of Prescription Opioid Industry Growth
Technological advancements leading to safer, more effective formulations are a key growth driver. Furthermore, economic factors, such as increasing healthcare spending in certain regions and rising prevalence of chronic pain conditions, contribute to market expansion. However, a critical factor is the regulatory landscape. While stringent regulations present challenges, they simultaneously drive innovation and encourage the development of safer opioid alternatives.
Challenges in the Prescription Opioid Industry Market
The prescription opioid market faces significant challenges, including stringent regulations that increase the cost and time required for product development and approval. Supply chain disruptions can impact market availability and pricing, while intense competition necessitates continuous innovation to maintain market share. The negative public perception surrounding opioids and the ongoing opioid crisis further pose considerable challenges for industry players.
Emerging Opportunities in Prescription Opioid Industry
Emerging opportunities lie in the development of innovative opioid formulations designed to address abuse potential and enhance patient safety. Strategic partnerships between pharmaceutical companies and research institutions may yield novel pain management solutions. Expanding into new geographic markets with high unmet medical needs also presents substantial growth potential.
Leading Players in the Prescription Opioid Industry Sector
- Teva Pharmaceuticals Inc
- Mallinckrodt Pharmaceuticals LLC
- Purdue Pharmaceuticals L P
- AcelRx Pharmaceuticals Inc
- Zyla Life Sciences (Egalet Corporation)
- Alcaliber SA
- Hikma Pharmaceuticals PLC
- Johnson and Johnson
- Amneal Pharmaceuticals Inc
- Vertice Pharma LLC
- AbbVie Inc (Allergan PLC)
- Endo Pharmaceuticals Inc
- Sun Pharmaceutical Industries Ltd
- Pfizer Inc
Key Milestones in Prescription Opioid Industry Industry
- January 2022: Trevena, Inc.'s OLINVYK (oliceridine) injection NDA accepted by China's NMPA.
- October 2021: Esteve Pharmaceuticals receives FDA approval for SEGLENTIS (celecoxib and tramadol hydrochloride).
Strategic Outlook for Prescription Opioid Industry Market
The future of the prescription opioid market hinges on the development of safer, more effective, and abuse-deterrent formulations. Strategic partnerships and collaborations will be vital for driving innovation and addressing the complex challenges surrounding opioid use. Expansion into emerging markets and leveraging digital health technologies to improve patient monitoring and management represent key strategic opportunities for future growth.
Prescription Opioid Industry Segmentation
-
1. Product Type
- 1.1. Codeine
- 1.2. Fentanyl
- 1.3. Morphine
- 1.4. Meperidine
- 1.5. Methadone
- 1.6. Other Product Types
-
2. Receptor Binding
- 2.1. Strong Agonist
- 2.2. Mild to Moderate Agonist
-
3. Application
-
3.1. Pain Management
- 3.1.1. Cancer Pain
- 3.1.2. Neuropathic Pain
- 3.1.3. Osteoarthritis Pain
- 3.1.4. Other Pain Managements
- 3.2. Cold and Cough
- 3.3. Diarrhoea
- 3.4. Other Applications
-
3.1. Pain Management
Prescription Opioid Industry Segmentation By Geography
-
1. North America
- 1.1. United States
- 1.2. Canada
- 1.3. Mexico
-
2. Europe
- 2.1. Germany
- 2.2. United Kingdom
- 2.3. France
- 2.4. Italy
- 2.5. Spain
- 2.6. Rest of Europe
-
3. Asia Pacific
- 3.1. China
- 3.2. Japan
- 3.3. India
- 3.4. Australia
- 3.5. South Korea
- 3.6. Rest of Asia Pacific
-
4. Middle East and Africa
- 4.1. GCC
- 4.2. South Africa
- 4.3. Rest of Middle East and Africa
-
5. South America
- 5.1. Brazil
- 5.2. Argentina
- 5.3. Rest of South America
Prescription Opioid Industry REPORT HIGHLIGHTS
| Aspects | Details |
|---|---|
| Study Period | 2019-2033 |
| Base Year | 2024 |
| Estimated Year | 2025 |
| Forecast Period | 2025-2033 |
| Historical Period | 2019-2024 |
| Growth Rate | CAGR of 3.75% from 2019-2033 |
| Segmentation |
|
Table of Contents
- 1. Introduction
- 1.1. Research Scope
- 1.2. Market Segmentation
- 1.3. Research Methodology
- 1.4. Definitions and Assumptions
- 2. Executive Summary
- 2.1. Introduction
- 3. Market Dynamics
- 3.1. Introduction
- 3.2. Market Drivers
- 3.2.1. Rising Prevalence of Orthopedic Diseases and Chronic Pain; Inclination toward Extended Release Formulations from Immediate Release of Opioids; Rising Focus on Abuse-deterrent Formulation (ADF) by Generic Manufacturers
- 3.3. Market Restrains
- 3.3.1. Advent and Legalization of Cannabis as an Alternative to Opioids; Prescription Drug Abuse
- 3.4. Market Trends
- 3.4.1. Strong Agonists are Expected to Hold Significant Market Share in the Receptor Binding Segment
- 4. Market Factor Analysis
- 4.1. Porters Five Forces
- 4.2. Supply/Value Chain
- 4.3. PESTEL analysis
- 4.4. Market Entropy
- 4.5. Patent/Trademark Analysis
- 5. Global Prescription Opioid Industry Analysis, Insights and Forecast, 2019-2031
- 5.1. Market Analysis, Insights and Forecast - by Product Type
- 5.1.1. Codeine
- 5.1.2. Fentanyl
- 5.1.3. Morphine
- 5.1.4. Meperidine
- 5.1.5. Methadone
- 5.1.6. Other Product Types
- 5.2. Market Analysis, Insights and Forecast - by Receptor Binding
- 5.2.1. Strong Agonist
- 5.2.2. Mild to Moderate Agonist
- 5.3. Market Analysis, Insights and Forecast - by Application
- 5.3.1. Pain Management
- 5.3.1.1. Cancer Pain
- 5.3.1.2. Neuropathic Pain
- 5.3.1.3. Osteoarthritis Pain
- 5.3.1.4. Other Pain Managements
- 5.3.2. Cold and Cough
- 5.3.3. Diarrhoea
- 5.3.4. Other Applications
- 5.3.1. Pain Management
- 5.4. Market Analysis, Insights and Forecast - by Region
- 5.4.1. North America
- 5.4.2. Europe
- 5.4.3. Asia Pacific
- 5.4.4. Middle East and Africa
- 5.4.5. South America
- 5.1. Market Analysis, Insights and Forecast - by Product Type
- 6. North America Prescription Opioid Industry Analysis, Insights and Forecast, 2019-2031
- 6.1. Market Analysis, Insights and Forecast - by Product Type
- 6.1.1. Codeine
- 6.1.2. Fentanyl
- 6.1.3. Morphine
- 6.1.4. Meperidine
- 6.1.5. Methadone
- 6.1.6. Other Product Types
- 6.2. Market Analysis, Insights and Forecast - by Receptor Binding
- 6.2.1. Strong Agonist
- 6.2.2. Mild to Moderate Agonist
- 6.3. Market Analysis, Insights and Forecast - by Application
- 6.3.1. Pain Management
- 6.3.1.1. Cancer Pain
- 6.3.1.2. Neuropathic Pain
- 6.3.1.3. Osteoarthritis Pain
- 6.3.1.4. Other Pain Managements
- 6.3.2. Cold and Cough
- 6.3.3. Diarrhoea
- 6.3.4. Other Applications
- 6.3.1. Pain Management
- 6.1. Market Analysis, Insights and Forecast - by Product Type
- 7. Europe Prescription Opioid Industry Analysis, Insights and Forecast, 2019-2031
- 7.1. Market Analysis, Insights and Forecast - by Product Type
- 7.1.1. Codeine
- 7.1.2. Fentanyl
- 7.1.3. Morphine
- 7.1.4. Meperidine
- 7.1.5. Methadone
- 7.1.6. Other Product Types
- 7.2. Market Analysis, Insights and Forecast - by Receptor Binding
- 7.2.1. Strong Agonist
- 7.2.2. Mild to Moderate Agonist
- 7.3. Market Analysis, Insights and Forecast - by Application
- 7.3.1. Pain Management
- 7.3.1.1. Cancer Pain
- 7.3.1.2. Neuropathic Pain
- 7.3.1.3. Osteoarthritis Pain
- 7.3.1.4. Other Pain Managements
- 7.3.2. Cold and Cough
- 7.3.3. Diarrhoea
- 7.3.4. Other Applications
- 7.3.1. Pain Management
- 7.1. Market Analysis, Insights and Forecast - by Product Type
- 8. Asia Pacific Prescription Opioid Industry Analysis, Insights and Forecast, 2019-2031
- 8.1. Market Analysis, Insights and Forecast - by Product Type
- 8.1.1. Codeine
- 8.1.2. Fentanyl
- 8.1.3. Morphine
- 8.1.4. Meperidine
- 8.1.5. Methadone
- 8.1.6. Other Product Types
- 8.2. Market Analysis, Insights and Forecast - by Receptor Binding
- 8.2.1. Strong Agonist
- 8.2.2. Mild to Moderate Agonist
- 8.3. Market Analysis, Insights and Forecast - by Application
- 8.3.1. Pain Management
- 8.3.1.1. Cancer Pain
- 8.3.1.2. Neuropathic Pain
- 8.3.1.3. Osteoarthritis Pain
- 8.3.1.4. Other Pain Managements
- 8.3.2. Cold and Cough
- 8.3.3. Diarrhoea
- 8.3.4. Other Applications
- 8.3.1. Pain Management
- 8.1. Market Analysis, Insights and Forecast - by Product Type
- 9. Middle East and Africa Prescription Opioid Industry Analysis, Insights and Forecast, 2019-2031
- 9.1. Market Analysis, Insights and Forecast - by Product Type
- 9.1.1. Codeine
- 9.1.2. Fentanyl
- 9.1.3. Morphine
- 9.1.4. Meperidine
- 9.1.5. Methadone
- 9.1.6. Other Product Types
- 9.2. Market Analysis, Insights and Forecast - by Receptor Binding
- 9.2.1. Strong Agonist
- 9.2.2. Mild to Moderate Agonist
- 9.3. Market Analysis, Insights and Forecast - by Application
- 9.3.1. Pain Management
- 9.3.1.1. Cancer Pain
- 9.3.1.2. Neuropathic Pain
- 9.3.1.3. Osteoarthritis Pain
- 9.3.1.4. Other Pain Managements
- 9.3.2. Cold and Cough
- 9.3.3. Diarrhoea
- 9.3.4. Other Applications
- 9.3.1. Pain Management
- 9.1. Market Analysis, Insights and Forecast - by Product Type
- 10. South America Prescription Opioid Industry Analysis, Insights and Forecast, 2019-2031
- 10.1. Market Analysis, Insights and Forecast - by Product Type
- 10.1.1. Codeine
- 10.1.2. Fentanyl
- 10.1.3. Morphine
- 10.1.4. Meperidine
- 10.1.5. Methadone
- 10.1.6. Other Product Types
- 10.2. Market Analysis, Insights and Forecast - by Receptor Binding
- 10.2.1. Strong Agonist
- 10.2.2. Mild to Moderate Agonist
- 10.3. Market Analysis, Insights and Forecast - by Application
- 10.3.1. Pain Management
- 10.3.1.1. Cancer Pain
- 10.3.1.2. Neuropathic Pain
- 10.3.1.3. Osteoarthritis Pain
- 10.3.1.4. Other Pain Managements
- 10.3.2. Cold and Cough
- 10.3.3. Diarrhoea
- 10.3.4. Other Applications
- 10.3.1. Pain Management
- 10.1. Market Analysis, Insights and Forecast - by Product Type
- 11. North America Prescription Opioid Industry Analysis, Insights and Forecast, 2019-2031
- 11.1. Market Analysis, Insights and Forecast - By Country/Sub-region
- 11.1.1. undefined
- 12. Europe Prescription Opioid Industry Analysis, Insights and Forecast, 2019-2031
- 12.1. Market Analysis, Insights and Forecast - By Country/Sub-region
- 12.1.1. undefined
- 13. Asia Pacific Prescription Opioid Industry Analysis, Insights and Forecast, 2019-2031
- 13.1. Market Analysis, Insights and Forecast - By Country/Sub-region
- 13.1.1. undefined
- 14. Middle East and Africa Prescription Opioid Industry Analysis, Insights and Forecast, 2019-2031
- 14.1. Market Analysis, Insights and Forecast - By Country/Sub-region
- 14.1.1. undefined
- 15. South America Prescription Opioid Industry Analysis, Insights and Forecast, 2019-2031
- 15.1. Market Analysis, Insights and Forecast - By Country/Sub-region
- 15.1.1. undefined
- 16. Competitive Analysis
- 16.1. Global Market Share Analysis 2024
- 16.2. Company Profiles
- 16.2.1 Teva Pharmaceuticals Inc
- 16.2.1.1. Overview
- 16.2.1.2. Products
- 16.2.1.3. SWOT Analysis
- 16.2.1.4. Recent Developments
- 16.2.1.5. Financials (Based on Availability)
- 16.2.2 Mallinckrodt Pharmaceuticals LLC
- 16.2.2.1. Overview
- 16.2.2.2. Products
- 16.2.2.3. SWOT Analysis
- 16.2.2.4. Recent Developments
- 16.2.2.5. Financials (Based on Availability)
- 16.2.3 Purdue Pharmaceuticals L P
- 16.2.3.1. Overview
- 16.2.3.2. Products
- 16.2.3.3. SWOT Analysis
- 16.2.3.4. Recent Developments
- 16.2.3.5. Financials (Based on Availability)
- 16.2.4 AcelRx Pharmaceuticals Inc
- 16.2.4.1. Overview
- 16.2.4.2. Products
- 16.2.4.3. SWOT Analysis
- 16.2.4.4. Recent Developments
- 16.2.4.5. Financials (Based on Availability)
- 16.2.5 Zyla Life Sciences (Egalet Corporation)
- 16.2.5.1. Overview
- 16.2.5.2. Products
- 16.2.5.3. SWOT Analysis
- 16.2.5.4. Recent Developments
- 16.2.5.5. Financials (Based on Availability)
- 16.2.6 Alcaliber SA
- 16.2.6.1. Overview
- 16.2.6.2. Products
- 16.2.6.3. SWOT Analysis
- 16.2.6.4. Recent Developments
- 16.2.6.5. Financials (Based on Availability)
- 16.2.7 Hikma Pharmaceuticals PLC
- 16.2.7.1. Overview
- 16.2.7.2. Products
- 16.2.7.3. SWOT Analysis
- 16.2.7.4. Recent Developments
- 16.2.7.5. Financials (Based on Availability)
- 16.2.8 Johnson and Johnson
- 16.2.8.1. Overview
- 16.2.8.2. Products
- 16.2.8.3. SWOT Analysis
- 16.2.8.4. Recent Developments
- 16.2.8.5. Financials (Based on Availability)
- 16.2.9 Amneal Pharmaceuticals Inc
- 16.2.9.1. Overview
- 16.2.9.2. Products
- 16.2.9.3. SWOT Analysis
- 16.2.9.4. Recent Developments
- 16.2.9.5. Financials (Based on Availability)
- 16.2.10 Vertice Pharma LLC
- 16.2.10.1. Overview
- 16.2.10.2. Products
- 16.2.10.3. SWOT Analysis
- 16.2.10.4. Recent Developments
- 16.2.10.5. Financials (Based on Availability)
- 16.2.11 AbbVie Inc (Allergan PLC)
- 16.2.11.1. Overview
- 16.2.11.2. Products
- 16.2.11.3. SWOT Analysis
- 16.2.11.4. Recent Developments
- 16.2.11.5. Financials (Based on Availability)
- 16.2.12 Endo Pharmaceuticals Inc
- 16.2.12.1. Overview
- 16.2.12.2. Products
- 16.2.12.3. SWOT Analysis
- 16.2.12.4. Recent Developments
- 16.2.12.5. Financials (Based on Availability)
- 16.2.13 Sun Pharmaceutical Industries Ltd
- 16.2.13.1. Overview
- 16.2.13.2. Products
- 16.2.13.3. SWOT Analysis
- 16.2.13.4. Recent Developments
- 16.2.13.5. Financials (Based on Availability)
- 16.2.14 Pfizer Inc
- 16.2.14.1. Overview
- 16.2.14.2. Products
- 16.2.14.3. SWOT Analysis
- 16.2.14.4. Recent Developments
- 16.2.14.5. Financials (Based on Availability)
- 16.2.1 Teva Pharmaceuticals Inc
List of Figures
- Figure 1: Global Prescription Opioid Industry Revenue Breakdown (Million, %) by Region 2024 & 2032
- Figure 2: Global Prescription Opioid Industry Volume Breakdown (K Unit, %) by Region 2024 & 2032
- Figure 3: North America Prescription Opioid Industry Revenue (Million), by Country 2024 & 2032
- Figure 4: North America Prescription Opioid Industry Volume (K Unit), by Country 2024 & 2032
- Figure 5: North America Prescription Opioid Industry Revenue Share (%), by Country 2024 & 2032
- Figure 6: North America Prescription Opioid Industry Volume Share (%), by Country 2024 & 2032
- Figure 7: Europe Prescription Opioid Industry Revenue (Million), by Country 2024 & 2032
- Figure 8: Europe Prescription Opioid Industry Volume (K Unit), by Country 2024 & 2032
- Figure 9: Europe Prescription Opioid Industry Revenue Share (%), by Country 2024 & 2032
- Figure 10: Europe Prescription Opioid Industry Volume Share (%), by Country 2024 & 2032
- Figure 11: Asia Pacific Prescription Opioid Industry Revenue (Million), by Country 2024 & 2032
- Figure 12: Asia Pacific Prescription Opioid Industry Volume (K Unit), by Country 2024 & 2032
- Figure 13: Asia Pacific Prescription Opioid Industry Revenue Share (%), by Country 2024 & 2032
- Figure 14: Asia Pacific Prescription Opioid Industry Volume Share (%), by Country 2024 & 2032
- Figure 15: Middle East and Africa Prescription Opioid Industry Revenue (Million), by Country 2024 & 2032
- Figure 16: Middle East and Africa Prescription Opioid Industry Volume (K Unit), by Country 2024 & 2032
- Figure 17: Middle East and Africa Prescription Opioid Industry Revenue Share (%), by Country 2024 & 2032
- Figure 18: Middle East and Africa Prescription Opioid Industry Volume Share (%), by Country 2024 & 2032
- Figure 19: South America Prescription Opioid Industry Revenue (Million), by Country 2024 & 2032
- Figure 20: South America Prescription Opioid Industry Volume (K Unit), by Country 2024 & 2032
- Figure 21: South America Prescription Opioid Industry Revenue Share (%), by Country 2024 & 2032
- Figure 22: South America Prescription Opioid Industry Volume Share (%), by Country 2024 & 2032
- Figure 23: North America Prescription Opioid Industry Revenue (Million), by Product Type 2024 & 2032
- Figure 24: North America Prescription Opioid Industry Volume (K Unit), by Product Type 2024 & 2032
- Figure 25: North America Prescription Opioid Industry Revenue Share (%), by Product Type 2024 & 2032
- Figure 26: North America Prescription Opioid Industry Volume Share (%), by Product Type 2024 & 2032
- Figure 27: North America Prescription Opioid Industry Revenue (Million), by Receptor Binding 2024 & 2032
- Figure 28: North America Prescription Opioid Industry Volume (K Unit), by Receptor Binding 2024 & 2032
- Figure 29: North America Prescription Opioid Industry Revenue Share (%), by Receptor Binding 2024 & 2032
- Figure 30: North America Prescription Opioid Industry Volume Share (%), by Receptor Binding 2024 & 2032
- Figure 31: North America Prescription Opioid Industry Revenue (Million), by Application 2024 & 2032
- Figure 32: North America Prescription Opioid Industry Volume (K Unit), by Application 2024 & 2032
- Figure 33: North America Prescription Opioid Industry Revenue Share (%), by Application 2024 & 2032
- Figure 34: North America Prescription Opioid Industry Volume Share (%), by Application 2024 & 2032
- Figure 35: North America Prescription Opioid Industry Revenue (Million), by Country 2024 & 2032
- Figure 36: North America Prescription Opioid Industry Volume (K Unit), by Country 2024 & 2032
- Figure 37: North America Prescription Opioid Industry Revenue Share (%), by Country 2024 & 2032
- Figure 38: North America Prescription Opioid Industry Volume Share (%), by Country 2024 & 2032
- Figure 39: Europe Prescription Opioid Industry Revenue (Million), by Product Type 2024 & 2032
- Figure 40: Europe Prescription Opioid Industry Volume (K Unit), by Product Type 2024 & 2032
- Figure 41: Europe Prescription Opioid Industry Revenue Share (%), by Product Type 2024 & 2032
- Figure 42: Europe Prescription Opioid Industry Volume Share (%), by Product Type 2024 & 2032
- Figure 43: Europe Prescription Opioid Industry Revenue (Million), by Receptor Binding 2024 & 2032
- Figure 44: Europe Prescription Opioid Industry Volume (K Unit), by Receptor Binding 2024 & 2032
- Figure 45: Europe Prescription Opioid Industry Revenue Share (%), by Receptor Binding 2024 & 2032
- Figure 46: Europe Prescription Opioid Industry Volume Share (%), by Receptor Binding 2024 & 2032
- Figure 47: Europe Prescription Opioid Industry Revenue (Million), by Application 2024 & 2032
- Figure 48: Europe Prescription Opioid Industry Volume (K Unit), by Application 2024 & 2032
- Figure 49: Europe Prescription Opioid Industry Revenue Share (%), by Application 2024 & 2032
- Figure 50: Europe Prescription Opioid Industry Volume Share (%), by Application 2024 & 2032
- Figure 51: Europe Prescription Opioid Industry Revenue (Million), by Country 2024 & 2032
- Figure 52: Europe Prescription Opioid Industry Volume (K Unit), by Country 2024 & 2032
- Figure 53: Europe Prescription Opioid Industry Revenue Share (%), by Country 2024 & 2032
- Figure 54: Europe Prescription Opioid Industry Volume Share (%), by Country 2024 & 2032
- Figure 55: Asia Pacific Prescription Opioid Industry Revenue (Million), by Product Type 2024 & 2032
- Figure 56: Asia Pacific Prescription Opioid Industry Volume (K Unit), by Product Type 2024 & 2032
- Figure 57: Asia Pacific Prescription Opioid Industry Revenue Share (%), by Product Type 2024 & 2032
- Figure 58: Asia Pacific Prescription Opioid Industry Volume Share (%), by Product Type 2024 & 2032
- Figure 59: Asia Pacific Prescription Opioid Industry Revenue (Million), by Receptor Binding 2024 & 2032
- Figure 60: Asia Pacific Prescription Opioid Industry Volume (K Unit), by Receptor Binding 2024 & 2032
- Figure 61: Asia Pacific Prescription Opioid Industry Revenue Share (%), by Receptor Binding 2024 & 2032
- Figure 62: Asia Pacific Prescription Opioid Industry Volume Share (%), by Receptor Binding 2024 & 2032
- Figure 63: Asia Pacific Prescription Opioid Industry Revenue (Million), by Application 2024 & 2032
- Figure 64: Asia Pacific Prescription Opioid Industry Volume (K Unit), by Application 2024 & 2032
- Figure 65: Asia Pacific Prescription Opioid Industry Revenue Share (%), by Application 2024 & 2032
- Figure 66: Asia Pacific Prescription Opioid Industry Volume Share (%), by Application 2024 & 2032
- Figure 67: Asia Pacific Prescription Opioid Industry Revenue (Million), by Country 2024 & 2032
- Figure 68: Asia Pacific Prescription Opioid Industry Volume (K Unit), by Country 2024 & 2032
- Figure 69: Asia Pacific Prescription Opioid Industry Revenue Share (%), by Country 2024 & 2032
- Figure 70: Asia Pacific Prescription Opioid Industry Volume Share (%), by Country 2024 & 2032
- Figure 71: Middle East and Africa Prescription Opioid Industry Revenue (Million), by Product Type 2024 & 2032
- Figure 72: Middle East and Africa Prescription Opioid Industry Volume (K Unit), by Product Type 2024 & 2032
- Figure 73: Middle East and Africa Prescription Opioid Industry Revenue Share (%), by Product Type 2024 & 2032
- Figure 74: Middle East and Africa Prescription Opioid Industry Volume Share (%), by Product Type 2024 & 2032
- Figure 75: Middle East and Africa Prescription Opioid Industry Revenue (Million), by Receptor Binding 2024 & 2032
- Figure 76: Middle East and Africa Prescription Opioid Industry Volume (K Unit), by Receptor Binding 2024 & 2032
- Figure 77: Middle East and Africa Prescription Opioid Industry Revenue Share (%), by Receptor Binding 2024 & 2032
- Figure 78: Middle East and Africa Prescription Opioid Industry Volume Share (%), by Receptor Binding 2024 & 2032
- Figure 79: Middle East and Africa Prescription Opioid Industry Revenue (Million), by Application 2024 & 2032
- Figure 80: Middle East and Africa Prescription Opioid Industry Volume (K Unit), by Application 2024 & 2032
- Figure 81: Middle East and Africa Prescription Opioid Industry Revenue Share (%), by Application 2024 & 2032
- Figure 82: Middle East and Africa Prescription Opioid Industry Volume Share (%), by Application 2024 & 2032
- Figure 83: Middle East and Africa Prescription Opioid Industry Revenue (Million), by Country 2024 & 2032
- Figure 84: Middle East and Africa Prescription Opioid Industry Volume (K Unit), by Country 2024 & 2032
- Figure 85: Middle East and Africa Prescription Opioid Industry Revenue Share (%), by Country 2024 & 2032
- Figure 86: Middle East and Africa Prescription Opioid Industry Volume Share (%), by Country 2024 & 2032
- Figure 87: South America Prescription Opioid Industry Revenue (Million), by Product Type 2024 & 2032
- Figure 88: South America Prescription Opioid Industry Volume (K Unit), by Product Type 2024 & 2032
- Figure 89: South America Prescription Opioid Industry Revenue Share (%), by Product Type 2024 & 2032
- Figure 90: South America Prescription Opioid Industry Volume Share (%), by Product Type 2024 & 2032
- Figure 91: South America Prescription Opioid Industry Revenue (Million), by Receptor Binding 2024 & 2032
- Figure 92: South America Prescription Opioid Industry Volume (K Unit), by Receptor Binding 2024 & 2032
- Figure 93: South America Prescription Opioid Industry Revenue Share (%), by Receptor Binding 2024 & 2032
- Figure 94: South America Prescription Opioid Industry Volume Share (%), by Receptor Binding 2024 & 2032
- Figure 95: South America Prescription Opioid Industry Revenue (Million), by Application 2024 & 2032
- Figure 96: South America Prescription Opioid Industry Volume (K Unit), by Application 2024 & 2032
- Figure 97: South America Prescription Opioid Industry Revenue Share (%), by Application 2024 & 2032
- Figure 98: South America Prescription Opioid Industry Volume Share (%), by Application 2024 & 2032
- Figure 99: South America Prescription Opioid Industry Revenue (Million), by Country 2024 & 2032
- Figure 100: South America Prescription Opioid Industry Volume (K Unit), by Country 2024 & 2032
- Figure 101: South America Prescription Opioid Industry Revenue Share (%), by Country 2024 & 2032
- Figure 102: South America Prescription Opioid Industry Volume Share (%), by Country 2024 & 2032
List of Tables
- Table 1: Global Prescription Opioid Industry Revenue Million Forecast, by Region 2019 & 2032
- Table 2: Global Prescription Opioid Industry Volume K Unit Forecast, by Region 2019 & 2032
- Table 3: Global Prescription Opioid Industry Revenue Million Forecast, by Product Type 2019 & 2032
- Table 4: Global Prescription Opioid Industry Volume K Unit Forecast, by Product Type 2019 & 2032
- Table 5: Global Prescription Opioid Industry Revenue Million Forecast, by Receptor Binding 2019 & 2032
- Table 6: Global Prescription Opioid Industry Volume K Unit Forecast, by Receptor Binding 2019 & 2032
- Table 7: Global Prescription Opioid Industry Revenue Million Forecast, by Application 2019 & 2032
- Table 8: Global Prescription Opioid Industry Volume K Unit Forecast, by Application 2019 & 2032
- Table 9: Global Prescription Opioid Industry Revenue Million Forecast, by Region 2019 & 2032
- Table 10: Global Prescription Opioid Industry Volume K Unit Forecast, by Region 2019 & 2032
- Table 11: Global Prescription Opioid Industry Revenue Million Forecast, by Country 2019 & 2032
- Table 12: Global Prescription Opioid Industry Volume K Unit Forecast, by Country 2019 & 2032
- Table 13: Global Prescription Opioid Industry Revenue Million Forecast, by Country 2019 & 2032
- Table 14: Global Prescription Opioid Industry Volume K Unit Forecast, by Country 2019 & 2032
- Table 15: Global Prescription Opioid Industry Revenue Million Forecast, by Country 2019 & 2032
- Table 16: Global Prescription Opioid Industry Volume K Unit Forecast, by Country 2019 & 2032
- Table 17: Global Prescription Opioid Industry Revenue Million Forecast, by Country 2019 & 2032
- Table 18: Global Prescription Opioid Industry Volume K Unit Forecast, by Country 2019 & 2032
- Table 19: Global Prescription Opioid Industry Revenue Million Forecast, by Country 2019 & 2032
- Table 20: Global Prescription Opioid Industry Volume K Unit Forecast, by Country 2019 & 2032
- Table 21: Global Prescription Opioid Industry Revenue Million Forecast, by Product Type 2019 & 2032
- Table 22: Global Prescription Opioid Industry Volume K Unit Forecast, by Product Type 2019 & 2032
- Table 23: Global Prescription Opioid Industry Revenue Million Forecast, by Receptor Binding 2019 & 2032
- Table 24: Global Prescription Opioid Industry Volume K Unit Forecast, by Receptor Binding 2019 & 2032
- Table 25: Global Prescription Opioid Industry Revenue Million Forecast, by Application 2019 & 2032
- Table 26: Global Prescription Opioid Industry Volume K Unit Forecast, by Application 2019 & 2032
- Table 27: Global Prescription Opioid Industry Revenue Million Forecast, by Country 2019 & 2032
- Table 28: Global Prescription Opioid Industry Volume K Unit Forecast, by Country 2019 & 2032
- Table 29: United States Prescription Opioid Industry Revenue (Million) Forecast, by Application 2019 & 2032
- Table 30: United States Prescription Opioid Industry Volume (K Unit) Forecast, by Application 2019 & 2032
- Table 31: Canada Prescription Opioid Industry Revenue (Million) Forecast, by Application 2019 & 2032
- Table 32: Canada Prescription Opioid Industry Volume (K Unit) Forecast, by Application 2019 & 2032
- Table 33: Mexico Prescription Opioid Industry Revenue (Million) Forecast, by Application 2019 & 2032
- Table 34: Mexico Prescription Opioid Industry Volume (K Unit) Forecast, by Application 2019 & 2032
- Table 35: Global Prescription Opioid Industry Revenue Million Forecast, by Product Type 2019 & 2032
- Table 36: Global Prescription Opioid Industry Volume K Unit Forecast, by Product Type 2019 & 2032
- Table 37: Global Prescription Opioid Industry Revenue Million Forecast, by Receptor Binding 2019 & 2032
- Table 38: Global Prescription Opioid Industry Volume K Unit Forecast, by Receptor Binding 2019 & 2032
- Table 39: Global Prescription Opioid Industry Revenue Million Forecast, by Application 2019 & 2032
- Table 40: Global Prescription Opioid Industry Volume K Unit Forecast, by Application 2019 & 2032
- Table 41: Global Prescription Opioid Industry Revenue Million Forecast, by Country 2019 & 2032
- Table 42: Global Prescription Opioid Industry Volume K Unit Forecast, by Country 2019 & 2032
- Table 43: Germany Prescription Opioid Industry Revenue (Million) Forecast, by Application 2019 & 2032
- Table 44: Germany Prescription Opioid Industry Volume (K Unit) Forecast, by Application 2019 & 2032
- Table 45: United Kingdom Prescription Opioid Industry Revenue (Million) Forecast, by Application 2019 & 2032
- Table 46: United Kingdom Prescription Opioid Industry Volume (K Unit) Forecast, by Application 2019 & 2032
- Table 47: France Prescription Opioid Industry Revenue (Million) Forecast, by Application 2019 & 2032
- Table 48: France Prescription Opioid Industry Volume (K Unit) Forecast, by Application 2019 & 2032
- Table 49: Italy Prescription Opioid Industry Revenue (Million) Forecast, by Application 2019 & 2032
- Table 50: Italy Prescription Opioid Industry Volume (K Unit) Forecast, by Application 2019 & 2032
- Table 51: Spain Prescription Opioid Industry Revenue (Million) Forecast, by Application 2019 & 2032
- Table 52: Spain Prescription Opioid Industry Volume (K Unit) Forecast, by Application 2019 & 2032
- Table 53: Rest of Europe Prescription Opioid Industry Revenue (Million) Forecast, by Application 2019 & 2032
- Table 54: Rest of Europe Prescription Opioid Industry Volume (K Unit) Forecast, by Application 2019 & 2032
- Table 55: Global Prescription Opioid Industry Revenue Million Forecast, by Product Type 2019 & 2032
- Table 56: Global Prescription Opioid Industry Volume K Unit Forecast, by Product Type 2019 & 2032
- Table 57: Global Prescription Opioid Industry Revenue Million Forecast, by Receptor Binding 2019 & 2032
- Table 58: Global Prescription Opioid Industry Volume K Unit Forecast, by Receptor Binding 2019 & 2032
- Table 59: Global Prescription Opioid Industry Revenue Million Forecast, by Application 2019 & 2032
- Table 60: Global Prescription Opioid Industry Volume K Unit Forecast, by Application 2019 & 2032
- Table 61: Global Prescription Opioid Industry Revenue Million Forecast, by Country 2019 & 2032
- Table 62: Global Prescription Opioid Industry Volume K Unit Forecast, by Country 2019 & 2032
- Table 63: China Prescription Opioid Industry Revenue (Million) Forecast, by Application 2019 & 2032
- Table 64: China Prescription Opioid Industry Volume (K Unit) Forecast, by Application 2019 & 2032
- Table 65: Japan Prescription Opioid Industry Revenue (Million) Forecast, by Application 2019 & 2032
- Table 66: Japan Prescription Opioid Industry Volume (K Unit) Forecast, by Application 2019 & 2032
- Table 67: India Prescription Opioid Industry Revenue (Million) Forecast, by Application 2019 & 2032
- Table 68: India Prescription Opioid Industry Volume (K Unit) Forecast, by Application 2019 & 2032
- Table 69: Australia Prescription Opioid Industry Revenue (Million) Forecast, by Application 2019 & 2032
- Table 70: Australia Prescription Opioid Industry Volume (K Unit) Forecast, by Application 2019 & 2032
- Table 71: South Korea Prescription Opioid Industry Revenue (Million) Forecast, by Application 2019 & 2032
- Table 72: South Korea Prescription Opioid Industry Volume (K Unit) Forecast, by Application 2019 & 2032
- Table 73: Rest of Asia Pacific Prescription Opioid Industry Revenue (Million) Forecast, by Application 2019 & 2032
- Table 74: Rest of Asia Pacific Prescription Opioid Industry Volume (K Unit) Forecast, by Application 2019 & 2032
- Table 75: Global Prescription Opioid Industry Revenue Million Forecast, by Product Type 2019 & 2032
- Table 76: Global Prescription Opioid Industry Volume K Unit Forecast, by Product Type 2019 & 2032
- Table 77: Global Prescription Opioid Industry Revenue Million Forecast, by Receptor Binding 2019 & 2032
- Table 78: Global Prescription Opioid Industry Volume K Unit Forecast, by Receptor Binding 2019 & 2032
- Table 79: Global Prescription Opioid Industry Revenue Million Forecast, by Application 2019 & 2032
- Table 80: Global Prescription Opioid Industry Volume K Unit Forecast, by Application 2019 & 2032
- Table 81: Global Prescription Opioid Industry Revenue Million Forecast, by Country 2019 & 2032
- Table 82: Global Prescription Opioid Industry Volume K Unit Forecast, by Country 2019 & 2032
- Table 83: GCC Prescription Opioid Industry Revenue (Million) Forecast, by Application 2019 & 2032
- Table 84: GCC Prescription Opioid Industry Volume (K Unit) Forecast, by Application 2019 & 2032
- Table 85: South Africa Prescription Opioid Industry Revenue (Million) Forecast, by Application 2019 & 2032
- Table 86: South Africa Prescription Opioid Industry Volume (K Unit) Forecast, by Application 2019 & 2032
- Table 87: Rest of Middle East and Africa Prescription Opioid Industry Revenue (Million) Forecast, by Application 2019 & 2032
- Table 88: Rest of Middle East and Africa Prescription Opioid Industry Volume (K Unit) Forecast, by Application 2019 & 2032
- Table 89: Global Prescription Opioid Industry Revenue Million Forecast, by Product Type 2019 & 2032
- Table 90: Global Prescription Opioid Industry Volume K Unit Forecast, by Product Type 2019 & 2032
- Table 91: Global Prescription Opioid Industry Revenue Million Forecast, by Receptor Binding 2019 & 2032
- Table 92: Global Prescription Opioid Industry Volume K Unit Forecast, by Receptor Binding 2019 & 2032
- Table 93: Global Prescription Opioid Industry Revenue Million Forecast, by Application 2019 & 2032
- Table 94: Global Prescription Opioid Industry Volume K Unit Forecast, by Application 2019 & 2032
- Table 95: Global Prescription Opioid Industry Revenue Million Forecast, by Country 2019 & 2032
- Table 96: Global Prescription Opioid Industry Volume K Unit Forecast, by Country 2019 & 2032
- Table 97: Brazil Prescription Opioid Industry Revenue (Million) Forecast, by Application 2019 & 2032
- Table 98: Brazil Prescription Opioid Industry Volume (K Unit) Forecast, by Application 2019 & 2032
- Table 99: Argentina Prescription Opioid Industry Revenue (Million) Forecast, by Application 2019 & 2032
- Table 100: Argentina Prescription Opioid Industry Volume (K Unit) Forecast, by Application 2019 & 2032
- Table 101: Rest of South America Prescription Opioid Industry Revenue (Million) Forecast, by Application 2019 & 2032
- Table 102: Rest of South America Prescription Opioid Industry Volume (K Unit) Forecast, by Application 2019 & 2032
Frequently Asked Questions
1. What is the projected Compound Annual Growth Rate (CAGR) of the Prescription Opioid Industry?
The projected CAGR is approximately 3.75%.
2. Which companies are prominent players in the Prescription Opioid Industry?
Key companies in the market include Teva Pharmaceuticals Inc, Mallinckrodt Pharmaceuticals LLC, Purdue Pharmaceuticals L P, AcelRx Pharmaceuticals Inc, Zyla Life Sciences (Egalet Corporation), Alcaliber SA, Hikma Pharmaceuticals PLC, Johnson and Johnson, Amneal Pharmaceuticals Inc, Vertice Pharma LLC, AbbVie Inc (Allergan PLC), Endo Pharmaceuticals Inc, Sun Pharmaceutical Industries Ltd, Pfizer Inc.
3. What are the main segments of the Prescription Opioid Industry?
The market segments include Product Type, Receptor Binding, Application.
4. Can you provide details about the market size?
The market size is estimated to be USD 23.94 Million as of 2022.
5. What are some drivers contributing to market growth?
Rising Prevalence of Orthopedic Diseases and Chronic Pain; Inclination toward Extended Release Formulations from Immediate Release of Opioids; Rising Focus on Abuse-deterrent Formulation (ADF) by Generic Manufacturers.
6. What are the notable trends driving market growth?
Strong Agonists are Expected to Hold Significant Market Share in the Receptor Binding Segment.
7. Are there any restraints impacting market growth?
Advent and Legalization of Cannabis as an Alternative to Opioids; Prescription Drug Abuse.
8. Can you provide examples of recent developments in the market?
In January 2022, Trevena, Inc. announced that China's National Medical Products Administration (NMPA) has accepted the submission of a New Drug Application (NDA) for OLINVYK (oliceridine) injection, a novel IV analgesic that has been approved in the United States by the Food and Drug Administration (FDA) for use in adults for the management of acute pain severe enough to require an intravenous opioid analgesic
9. What pricing options are available for accessing the report?
Pricing options include single-user, multi-user, and enterprise licenses priced at USD 4750, USD 5250, and USD 8750 respectively.
10. Is the market size provided in terms of value or volume?
The market size is provided in terms of value, measured in Million and volume, measured in K Unit.
11. Are there any specific market keywords associated with the report?
Yes, the market keyword associated with the report is "Prescription Opioid Industry," which aids in identifying and referencing the specific market segment covered.
12. How do I determine which pricing option suits my needs best?
The pricing options vary based on user requirements and access needs. Individual users may opt for single-user licenses, while businesses requiring broader access may choose multi-user or enterprise licenses for cost-effective access to the report.
13. Are there any additional resources or data provided in the Prescription Opioid Industry report?
While the report offers comprehensive insights, it's advisable to review the specific contents or supplementary materials provided to ascertain if additional resources or data are available.
14. How can I stay updated on further developments or reports in the Prescription Opioid Industry?
To stay informed about further developments, trends, and reports in the Prescription Opioid Industry, consider subscribing to industry newsletters, following relevant companies and organizations, or regularly checking reputable industry news sources and publications.
Methodology
Step 1 - Identification of Relevant Samples Size from Population Database


Step 2 - Approaches for Defining Global Market Size (Value, Volume* & Price*)

Note*: In applicable scenarios
Step 3 - Data Sources
Primary Research
- Web Analytics
- Survey Reports
- Research Institute
- Latest Research Reports
- Opinion Leaders
Secondary Research
- Annual Reports
- White Paper
- Latest Press Release
- Industry Association
- Paid Database
- Investor Presentations

Step 4 - Data Triangulation
Involves using different sources of information in order to increase the validity of a study
These sources are likely to be stakeholders in a program - participants, other researchers, program staff, other community members, and so on.
Then we put all data in single framework & apply various statistical tools to find out the dynamic on the market.
During the analysis stage, feedback from the stakeholder groups would be compared to determine areas of agreement as well as areas of divergence
