

Key Insights
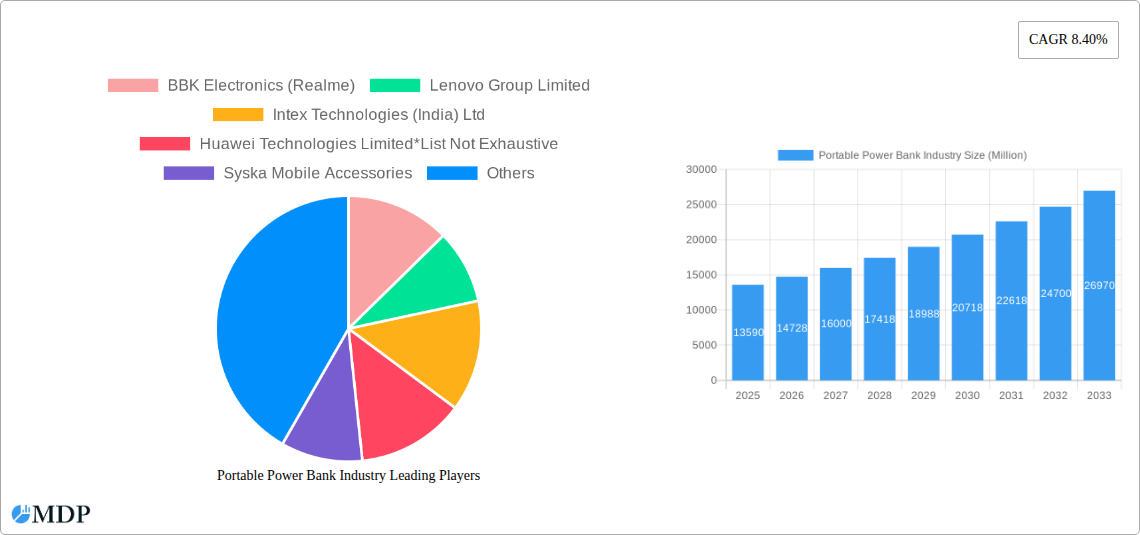
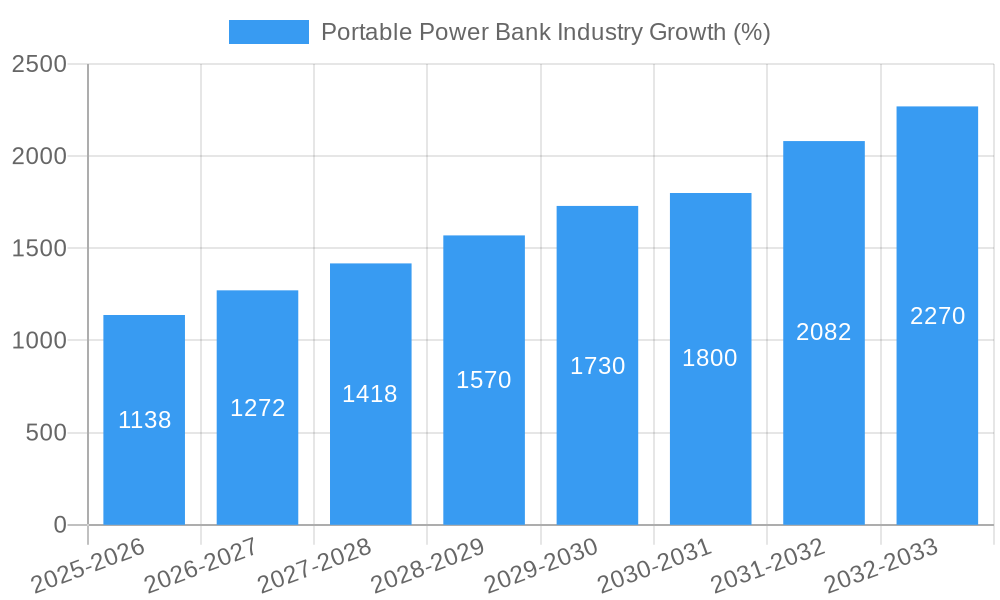
The portable power bank market, valued at $13.59 billion in 2025, is experiencing robust growth, projected to expand at a compound annual growth rate (CAGR) of 8.40% from 2025 to 2033. This growth is fueled by the increasing reliance on mobile devices, the rising popularity of outdoor activities requiring portable charging solutions, and the expanding adoption of wireless charging technology. Key market segments include power banks with capacities ranging from 500-5999mAh to over 13000mAh, catering to diverse user needs. Wired charging remains dominant, but wireless charging is gaining traction, driven by advancements in wireless charging technologies and increased consumer demand for convenient charging solutions. Smartphone and tablet applications continue to dominate, but growth is also observed in segments like cameras, laptops, and smart wearables. Major players like BBK Electronics (Realme), Lenovo, Xiaomi, and others are driving innovation and competition, leading to improvements in power bank technology, design, and affordability.
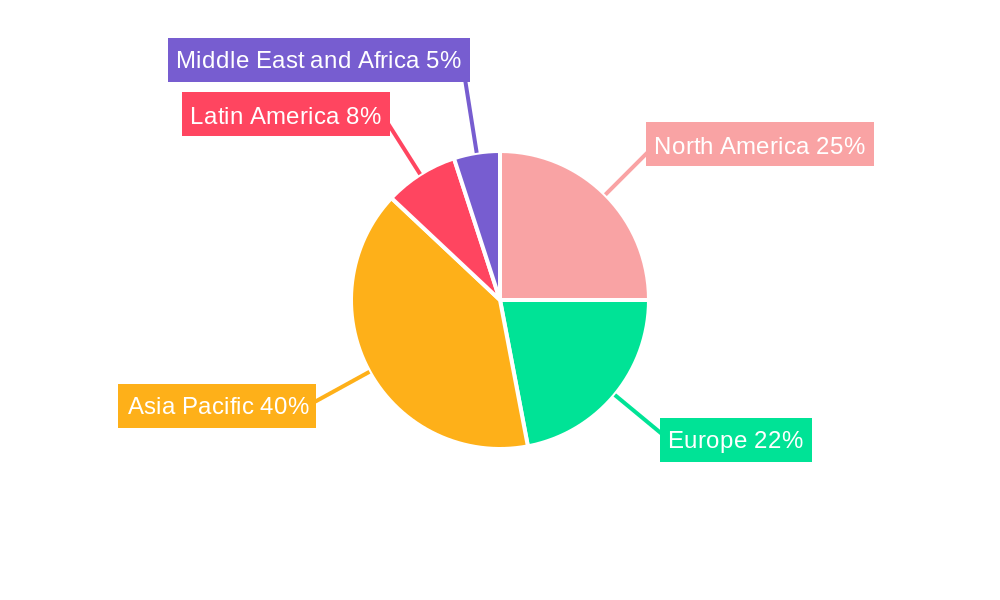
The market's growth is further influenced by geographical variations. While precise regional data is unavailable, the Asia-Pacific region, with its large and rapidly growing smartphone market, is expected to hold a significant share, followed by North America and Europe. However, expanding internet penetration and rising disposable incomes in emerging markets of Latin America and the Middle East and Africa are presenting substantial growth opportunities. Challenges include concerns around battery safety, environmental impact of battery production and disposal, and the constant pressure to develop faster-charging and higher-capacity power banks to keep pace with evolving mobile device technology. The industry is expected to see increased focus on sustainable manufacturing practices and innovative battery technologies to address these challenges and maintain sustainable growth.
Portable Power Bank Industry Report: 2019-2033
This comprehensive report provides an in-depth analysis of the global portable power bank industry, covering market dynamics, trends, leading players, and future outlook. With a study period spanning 2019-2033, a base year of 2025, and a forecast period of 2025-2033, this report is an essential resource for industry stakeholders, investors, and businesses seeking to understand this rapidly evolving market. The report analyzes a market projected to reach xx Million by 2033, offering valuable insights into growth opportunities and potential challenges.
Portable Power Bank Industry Market Dynamics & Concentration
The portable power bank market exhibits a moderately concentrated landscape, with several key players holding significant market share. Market concentration is influenced by factors including brand recognition, technological innovation, and economies of scale. The market share of the top 5 players is estimated at xx%, with the remaining share distributed among numerous smaller players. Innovation drivers include advancements in battery technology (e.g., higher energy density, faster charging), miniaturization, and integration of additional functionalities (e.g., wireless charging, power delivery). Regulatory frameworks, particularly concerning battery safety and environmental regulations, significantly impact the industry. Product substitutes, such as wall chargers and solar chargers, pose a degree of competitive pressure, while the growing adoption of fast-charging smartphones somewhat mitigates the demand for high-capacity power banks. End-user trends point towards a preference for slimmer, lighter, and more aesthetically pleasing designs with faster charging capabilities. M&A activity within the portable power bank industry has been relatively low in recent years, with an estimated xx M&A deals occurring between 2019 and 2024.
- Market Concentration: Top 5 players hold xx% market share (2024).
- Innovation Drivers: Higher energy density batteries, fast charging, wireless charging.
- Regulatory Impact: Safety and environmental regulations influence product design and manufacturing.
- M&A Activity: Approximately xx deals between 2019 and 2024.
Portable Power Bank Industry Industry Trends & Analysis
The portable power bank market is experiencing robust growth, driven by several key factors. The rising adoption of smartphones and other portable electronic devices, coupled with increasing consumer demand for convenient power solutions on the go, fuels market expansion. Technological advancements, such as the development of higher-capacity and faster-charging batteries, are further propelling growth. Consumer preferences are shifting towards more compact and stylish designs with advanced features like wireless charging capabilities. The competitive landscape is dynamic, with existing players continuously innovating and new entrants vying for market share. The industry is characterized by a competitive pricing strategy, impacting profitability. The CAGR for the portable power bank market is estimated at xx% during the forecast period (2025-2033). Market penetration is highest in developed regions, with emerging markets exhibiting significant growth potential.
Leading Markets & Segments in Portable Power Bank Industry
The Asia-Pacific region currently dominates the global portable power bank market, driven by robust economic growth, high smartphone penetration, and a large consumer base. China and India are key contributors to this regional dominance.
By Capacity Range:
- 10,000mAh - 13,000mAh: This segment currently holds the largest market share due to its balance of capacity and portability. Key drivers include the increasing power demands of modern smartphones and tablets.
- >13,000mAh: This segment is experiencing moderate growth, driven by users requiring longer power backup for laptops and other power-hungry devices.
By Charging Mode:
- Wired: This remains the dominant charging mode due to its efficiency and cost-effectiveness.
- Wireless: The wireless charging segment is witnessing substantial growth driven by consumer demand for convenience and ease of use.
By Application:
- Smartphones and Tablets: This segment remains the largest application segment for portable power banks due to the widespread adoption of these devices.
Portable Power Bank Industry Product Developments
Recent product innovations focus on increased power density, faster charging speeds, and integration of multiple charging ports. Wireless charging technology has gained traction, and manufacturers are incorporating features like power delivery (PD) for fast charging of various devices. The market is witnessing a trend towards more compact and aesthetically pleasing designs, appealing to a broader consumer base. These developments enhance user convenience and extend product lifecycles.
Key Drivers of Portable Power Bank Industry Growth
Several factors are driving growth in the portable power bank market. Firstly, the proliferation of smartphones and other portable electronic devices fuels the demand for convenient power solutions. Secondly, technological advancements leading to higher energy density batteries and faster charging technologies enhance product appeal. Thirdly, favorable economic conditions and rising disposable incomes in developing economies are expanding market reach.
Challenges in the Portable Power Bank Industry Market
The portable power bank industry faces challenges, including intense competition leading to price pressure and reduced profit margins. Supply chain disruptions, particularly concerning battery materials, can impact production and availability. Stringent safety and environmental regulations necessitate compliance costs and can limit design flexibility. Counterfeit products also pose a challenge, impacting brand reputation and market integrity.
Emerging Opportunities in Portable Power Bank Industry
The portable power bank market presents significant opportunities for growth. Advancements in battery technology, particularly solid-state batteries, promise higher energy density and improved safety. Strategic partnerships and collaborations among manufacturers and technology providers can fuel innovation and expand market reach. Expansion into new applications, such as powering drones and wearable devices, presents untapped potential.
Leading Players in the Portable Power Bank Industry Sector
- BBK Electronics (Realme)
- Lenovo Group Limited
- Intex Technologies (India) Ltd
- Huawei Technologies Limited
- Syska Mobile Accessories
- ADATA Technology Co Ltd
- Xiaomi Corporation
- Ambrane India Pvt Ltd
- Koninklijke Philips NV
- Panasonic Corporation
- Sony Corporation
Key Milestones in Portable Power Bank Industry Industry
- February 2024: BBK Group announces smartphone production partnership with Indian manufacturers Dixon Technologies and Karbonn Group, leveraging the Production-Linked Incentive (PLI) scheme. This signifies a shift towards local manufacturing and potential cost optimization within the industry's supply chain.
- January 2024: Xiaomi launches an ultra-thin power bank (10mm thickness, 5,000mAh capacity), highlighting a trend towards compact and aesthetically pleasing designs. This underscores the ongoing innovation within the sector, emphasizing consumer demand for slimmer and more portable power solutions.
Strategic Outlook for Portable Power Bank Industry Market
The portable power bank market is poised for continued growth, driven by technological advancements and expanding applications. Strategic opportunities lie in developing higher-capacity, faster-charging, and more versatile power banks. Focus on sustainability, using eco-friendly materials and improving battery lifecycle management, will be crucial for long-term success. Expansion into emerging markets and strategic partnerships will be key for capturing market share and driving revenue growth.
Portable Power Bank Industry Segmentation
-
1. Capacity Range
- 1.1. 500-5999mAh
- 1.2. 6000-9999mAh
- 1.3. 10,000mAh -13000mAh
- 1.4. > 13000mAh
-
2. Charging Mode
- 2.1. Wired
- 2.2. Wireless
-
3. Application
- 3.1. Smartphone and Tablets
- 3.2. Cameras
- 3.3. Laptops
- 3.4. Other Applications (Smart band, Wireless Headsets)
Portable Power Bank Industry Segmentation By Geography
- 1. North America
- 2. Europe
- 3. Asia Pacific
- 4. Latin America
- 5. Middle East and Africa
Portable Power Bank Industry REPORT HIGHLIGHTS
| Aspects | Details |
|---|---|
| Study Period | 2019-2033 |
| Base Year | 2024 |
| Estimated Year | 2025 |
| Forecast Period | 2025-2033 |
| Historical Period | 2019-2024 |
| Growth Rate | CAGR of 8.40% from 2019-2033 |
| Segmentation |
|
Table of Contents
- 1. Introduction
- 1.1. Research Scope
- 1.2. Market Segmentation
- 1.3. Research Methodology
- 1.4. Definitions and Assumptions
- 2. Executive Summary
- 2.1. Introduction
- 3. Market Dynamics
- 3.1. Introduction
- 3.2. Market Drivers
- 3.2.1. Rapidly Increasing Demand for Portable Devices; Increasing E-commerce Sales Across the World
- 3.3. Market Restrains
- 3.3.1. Launch of Poor Quality Power Banks
- 3.4. Market Trends
- 3.4.1. Wireless Charging is Expected to Drive the Market Growth
- 4. Market Factor Analysis
- 4.1. Porters Five Forces
- 4.2. Supply/Value Chain
- 4.3. PESTEL analysis
- 4.4. Market Entropy
- 4.5. Patent/Trademark Analysis
- 5. Global Portable Power Bank Industry Analysis, Insights and Forecast, 2019-2031
- 5.1. Market Analysis, Insights and Forecast - by Capacity Range
- 5.1.1. 500-5999mAh
- 5.1.2. 6000-9999mAh
- 5.1.3. 10,000mAh -13000mAh
- 5.1.4. > 13000mAh
- 5.2. Market Analysis, Insights and Forecast - by Charging Mode
- 5.2.1. Wired
- 5.2.2. Wireless
- 5.3. Market Analysis, Insights and Forecast - by Application
- 5.3.1. Smartphone and Tablets
- 5.3.2. Cameras
- 5.3.3. Laptops
- 5.3.4. Other Applications (Smart band, Wireless Headsets)
- 5.4. Market Analysis, Insights and Forecast - by Region
- 5.4.1. North America
- 5.4.2. Europe
- 5.4.3. Asia Pacific
- 5.4.4. Latin America
- 5.4.5. Middle East and Africa
- 5.1. Market Analysis, Insights and Forecast - by Capacity Range
- 6. North America Portable Power Bank Industry Analysis, Insights and Forecast, 2019-2031
- 6.1. Market Analysis, Insights and Forecast - by Capacity Range
- 6.1.1. 500-5999mAh
- 6.1.2. 6000-9999mAh
- 6.1.3. 10,000mAh -13000mAh
- 6.1.4. > 13000mAh
- 6.2. Market Analysis, Insights and Forecast - by Charging Mode
- 6.2.1. Wired
- 6.2.2. Wireless
- 6.3. Market Analysis, Insights and Forecast - by Application
- 6.3.1. Smartphone and Tablets
- 6.3.2. Cameras
- 6.3.3. Laptops
- 6.3.4. Other Applications (Smart band, Wireless Headsets)
- 6.1. Market Analysis, Insights and Forecast - by Capacity Range
- 7. Europe Portable Power Bank Industry Analysis, Insights and Forecast, 2019-2031
- 7.1. Market Analysis, Insights and Forecast - by Capacity Range
- 7.1.1. 500-5999mAh
- 7.1.2. 6000-9999mAh
- 7.1.3. 10,000mAh -13000mAh
- 7.1.4. > 13000mAh
- 7.2. Market Analysis, Insights and Forecast - by Charging Mode
- 7.2.1. Wired
- 7.2.2. Wireless
- 7.3. Market Analysis, Insights and Forecast - by Application
- 7.3.1. Smartphone and Tablets
- 7.3.2. Cameras
- 7.3.3. Laptops
- 7.3.4. Other Applications (Smart band, Wireless Headsets)
- 7.1. Market Analysis, Insights and Forecast - by Capacity Range
- 8. Asia Pacific Portable Power Bank Industry Analysis, Insights and Forecast, 2019-2031
- 8.1. Market Analysis, Insights and Forecast - by Capacity Range
- 8.1.1. 500-5999mAh
- 8.1.2. 6000-9999mAh
- 8.1.3. 10,000mAh -13000mAh
- 8.1.4. > 13000mAh
- 8.2. Market Analysis, Insights and Forecast - by Charging Mode
- 8.2.1. Wired
- 8.2.2. Wireless
- 8.3. Market Analysis, Insights and Forecast - by Application
- 8.3.1. Smartphone and Tablets
- 8.3.2. Cameras
- 8.3.3. Laptops
- 8.3.4. Other Applications (Smart band, Wireless Headsets)
- 8.1. Market Analysis, Insights and Forecast - by Capacity Range
- 9. Latin America Portable Power Bank Industry Analysis, Insights and Forecast, 2019-2031
- 9.1. Market Analysis, Insights and Forecast - by Capacity Range
- 9.1.1. 500-5999mAh
- 9.1.2. 6000-9999mAh
- 9.1.3. 10,000mAh -13000mAh
- 9.1.4. > 13000mAh
- 9.2. Market Analysis, Insights and Forecast - by Charging Mode
- 9.2.1. Wired
- 9.2.2. Wireless
- 9.3. Market Analysis, Insights and Forecast - by Application
- 9.3.1. Smartphone and Tablets
- 9.3.2. Cameras
- 9.3.3. Laptops
- 9.3.4. Other Applications (Smart band, Wireless Headsets)
- 9.1. Market Analysis, Insights and Forecast - by Capacity Range
- 10. Middle East and Africa Portable Power Bank Industry Analysis, Insights and Forecast, 2019-2031
- 10.1. Market Analysis, Insights and Forecast - by Capacity Range
- 10.1.1. 500-5999mAh
- 10.1.2. 6000-9999mAh
- 10.1.3. 10,000mAh -13000mAh
- 10.1.4. > 13000mAh
- 10.2. Market Analysis, Insights and Forecast - by Charging Mode
- 10.2.1. Wired
- 10.2.2. Wireless
- 10.3. Market Analysis, Insights and Forecast - by Application
- 10.3.1. Smartphone and Tablets
- 10.3.2. Cameras
- 10.3.3. Laptops
- 10.3.4. Other Applications (Smart band, Wireless Headsets)
- 10.1. Market Analysis, Insights and Forecast - by Capacity Range
- 11. North America Portable Power Bank Industry Analysis, Insights and Forecast, 2019-2031
- 11.1. Market Analysis, Insights and Forecast - By Country/Sub-region
- 11.1.1.
- 12. Europe Portable Power Bank Industry Analysis, Insights and Forecast, 2019-2031
- 12.1. Market Analysis, Insights and Forecast - By Country/Sub-region
- 12.1.1.
- 13. Asia Pacific Portable Power Bank Industry Analysis, Insights and Forecast, 2019-2031
- 13.1. Market Analysis, Insights and Forecast - By Country/Sub-region
- 13.1.1.
- 14. Latin America Portable Power Bank Industry Analysis, Insights and Forecast, 2019-2031
- 14.1. Market Analysis, Insights and Forecast - By Country/Sub-region
- 14.1.1.
- 15. Middle East and Africa Portable Power Bank Industry Analysis, Insights and Forecast, 2019-2031
- 15.1. Market Analysis, Insights and Forecast - By Country/Sub-region
- 15.1.1.
- 16. Competitive Analysis
- 16.1. Global Market Share Analysis 2024
- 16.2. Company Profiles
- 16.2.1 BBK Electronics (Realme)
- 16.2.1.1. Overview
- 16.2.1.2. Products
- 16.2.1.3. SWOT Analysis
- 16.2.1.4. Recent Developments
- 16.2.1.5. Financials (Based on Availability)
- 16.2.2 Lenovo Group Limited
- 16.2.2.1. Overview
- 16.2.2.2. Products
- 16.2.2.3. SWOT Analysis
- 16.2.2.4. Recent Developments
- 16.2.2.5. Financials (Based on Availability)
- 16.2.3 Intex Technologies (India) Ltd
- 16.2.3.1. Overview
- 16.2.3.2. Products
- 16.2.3.3. SWOT Analysis
- 16.2.3.4. Recent Developments
- 16.2.3.5. Financials (Based on Availability)
- 16.2.4 Huawei Technologies Limited*List Not Exhaustive
- 16.2.4.1. Overview
- 16.2.4.2. Products
- 16.2.4.3. SWOT Analysis
- 16.2.4.4. Recent Developments
- 16.2.4.5. Financials (Based on Availability)
- 16.2.5 Syska Mobile Accessories
- 16.2.5.1. Overview
- 16.2.5.2. Products
- 16.2.5.3. SWOT Analysis
- 16.2.5.4. Recent Developments
- 16.2.5.5. Financials (Based on Availability)
- 16.2.6 ADATA Technology Co Ltd
- 16.2.6.1. Overview
- 16.2.6.2. Products
- 16.2.6.3. SWOT Analysis
- 16.2.6.4. Recent Developments
- 16.2.6.5. Financials (Based on Availability)
- 16.2.7 Xiaomi Corporation
- 16.2.7.1. Overview
- 16.2.7.2. Products
- 16.2.7.3. SWOT Analysis
- 16.2.7.4. Recent Developments
- 16.2.7.5. Financials (Based on Availability)
- 16.2.8 Ambrane India Pvt Ltd
- 16.2.8.1. Overview
- 16.2.8.2. Products
- 16.2.8.3. SWOT Analysis
- 16.2.8.4. Recent Developments
- 16.2.8.5. Financials (Based on Availability)
- 16.2.9 Koninklijke Philips NV
- 16.2.9.1. Overview
- 16.2.9.2. Products
- 16.2.9.3. SWOT Analysis
- 16.2.9.4. Recent Developments
- 16.2.9.5. Financials (Based on Availability)
- 16.2.10 Panasonic Corporation
- 16.2.10.1. Overview
- 16.2.10.2. Products
- 16.2.10.3. SWOT Analysis
- 16.2.10.4. Recent Developments
- 16.2.10.5. Financials (Based on Availability)
- 16.2.11 Sony Corporation
- 16.2.11.1. Overview
- 16.2.11.2. Products
- 16.2.11.3. SWOT Analysis
- 16.2.11.4. Recent Developments
- 16.2.11.5. Financials (Based on Availability)
- 16.2.1 BBK Electronics (Realme)
List of Figures
- Figure 1: Global Portable Power Bank Industry Revenue Breakdown (Million, %) by Region 2024 & 2032
- Figure 2: North America Portable Power Bank Industry Revenue (Million), by Country 2024 & 2032
- Figure 3: North America Portable Power Bank Industry Revenue Share (%), by Country 2024 & 2032
- Figure 4: Europe Portable Power Bank Industry Revenue (Million), by Country 2024 & 2032
- Figure 5: Europe Portable Power Bank Industry Revenue Share (%), by Country 2024 & 2032
- Figure 6: Asia Pacific Portable Power Bank Industry Revenue (Million), by Country 2024 & 2032
- Figure 7: Asia Pacific Portable Power Bank Industry Revenue Share (%), by Country 2024 & 2032
- Figure 8: Latin America Portable Power Bank Industry Revenue (Million), by Country 2024 & 2032
- Figure 9: Latin America Portable Power Bank Industry Revenue Share (%), by Country 2024 & 2032
- Figure 10: Middle East and Africa Portable Power Bank Industry Revenue (Million), by Country 2024 & 2032
- Figure 11: Middle East and Africa Portable Power Bank Industry Revenue Share (%), by Country 2024 & 2032
- Figure 12: North America Portable Power Bank Industry Revenue (Million), by Capacity Range 2024 & 2032
- Figure 13: North America Portable Power Bank Industry Revenue Share (%), by Capacity Range 2024 & 2032
- Figure 14: North America Portable Power Bank Industry Revenue (Million), by Charging Mode 2024 & 2032
- Figure 15: North America Portable Power Bank Industry Revenue Share (%), by Charging Mode 2024 & 2032
- Figure 16: North America Portable Power Bank Industry Revenue (Million), by Application 2024 & 2032
- Figure 17: North America Portable Power Bank Industry Revenue Share (%), by Application 2024 & 2032
- Figure 18: North America Portable Power Bank Industry Revenue (Million), by Country 2024 & 2032
- Figure 19: North America Portable Power Bank Industry Revenue Share (%), by Country 2024 & 2032
- Figure 20: Europe Portable Power Bank Industry Revenue (Million), by Capacity Range 2024 & 2032
- Figure 21: Europe Portable Power Bank Industry Revenue Share (%), by Capacity Range 2024 & 2032
- Figure 22: Europe Portable Power Bank Industry Revenue (Million), by Charging Mode 2024 & 2032
- Figure 23: Europe Portable Power Bank Industry Revenue Share (%), by Charging Mode 2024 & 2032
- Figure 24: Europe Portable Power Bank Industry Revenue (Million), by Application 2024 & 2032
- Figure 25: Europe Portable Power Bank Industry Revenue Share (%), by Application 2024 & 2032
- Figure 26: Europe Portable Power Bank Industry Revenue (Million), by Country 2024 & 2032
- Figure 27: Europe Portable Power Bank Industry Revenue Share (%), by Country 2024 & 2032
- Figure 28: Asia Pacific Portable Power Bank Industry Revenue (Million), by Capacity Range 2024 & 2032
- Figure 29: Asia Pacific Portable Power Bank Industry Revenue Share (%), by Capacity Range 2024 & 2032
- Figure 30: Asia Pacific Portable Power Bank Industry Revenue (Million), by Charging Mode 2024 & 2032
- Figure 31: Asia Pacific Portable Power Bank Industry Revenue Share (%), by Charging Mode 2024 & 2032
- Figure 32: Asia Pacific Portable Power Bank Industry Revenue (Million), by Application 2024 & 2032
- Figure 33: Asia Pacific Portable Power Bank Industry Revenue Share (%), by Application 2024 & 2032
- Figure 34: Asia Pacific Portable Power Bank Industry Revenue (Million), by Country 2024 & 2032
- Figure 35: Asia Pacific Portable Power Bank Industry Revenue Share (%), by Country 2024 & 2032
- Figure 36: Latin America Portable Power Bank Industry Revenue (Million), by Capacity Range 2024 & 2032
- Figure 37: Latin America Portable Power Bank Industry Revenue Share (%), by Capacity Range 2024 & 2032
- Figure 38: Latin America Portable Power Bank Industry Revenue (Million), by Charging Mode 2024 & 2032
- Figure 39: Latin America Portable Power Bank Industry Revenue Share (%), by Charging Mode 2024 & 2032
- Figure 40: Latin America Portable Power Bank Industry Revenue (Million), by Application 2024 & 2032
- Figure 41: Latin America Portable Power Bank Industry Revenue Share (%), by Application 2024 & 2032
- Figure 42: Latin America Portable Power Bank Industry Revenue (Million), by Country 2024 & 2032
- Figure 43: Latin America Portable Power Bank Industry Revenue Share (%), by Country 2024 & 2032
- Figure 44: Middle East and Africa Portable Power Bank Industry Revenue (Million), by Capacity Range 2024 & 2032
- Figure 45: Middle East and Africa Portable Power Bank Industry Revenue Share (%), by Capacity Range 2024 & 2032
- Figure 46: Middle East and Africa Portable Power Bank Industry Revenue (Million), by Charging Mode 2024 & 2032
- Figure 47: Middle East and Africa Portable Power Bank Industry Revenue Share (%), by Charging Mode 2024 & 2032
- Figure 48: Middle East and Africa Portable Power Bank Industry Revenue (Million), by Application 2024 & 2032
- Figure 49: Middle East and Africa Portable Power Bank Industry Revenue Share (%), by Application 2024 & 2032
- Figure 50: Middle East and Africa Portable Power Bank Industry Revenue (Million), by Country 2024 & 2032
- Figure 51: Middle East and Africa Portable Power Bank Industry Revenue Share (%), by Country 2024 & 2032
List of Tables
- Table 1: Global Portable Power Bank Industry Revenue Million Forecast, by Region 2019 & 2032
- Table 2: Global Portable Power Bank Industry Revenue Million Forecast, by Capacity Range 2019 & 2032
- Table 3: Global Portable Power Bank Industry Revenue Million Forecast, by Charging Mode 2019 & 2032
- Table 4: Global Portable Power Bank Industry Revenue Million Forecast, by Application 2019 & 2032
- Table 5: Global Portable Power Bank Industry Revenue Million Forecast, by Region 2019 & 2032
- Table 6: Global Portable Power Bank Industry Revenue Million Forecast, by Country 2019 & 2032
- Table 7: Portable Power Bank Industry Revenue (Million) Forecast, by Application 2019 & 2032
- Table 8: Global Portable Power Bank Industry Revenue Million Forecast, by Country 2019 & 2032
- Table 9: Portable Power Bank Industry Revenue (Million) Forecast, by Application 2019 & 2032
- Table 10: Global Portable Power Bank Industry Revenue Million Forecast, by Country 2019 & 2032
- Table 11: Portable Power Bank Industry Revenue (Million) Forecast, by Application 2019 & 2032
- Table 12: Global Portable Power Bank Industry Revenue Million Forecast, by Country 2019 & 2032
- Table 13: Portable Power Bank Industry Revenue (Million) Forecast, by Application 2019 & 2032
- Table 14: Global Portable Power Bank Industry Revenue Million Forecast, by Country 2019 & 2032
- Table 15: Portable Power Bank Industry Revenue (Million) Forecast, by Application 2019 & 2032
- Table 16: Global Portable Power Bank Industry Revenue Million Forecast, by Capacity Range 2019 & 2032
- Table 17: Global Portable Power Bank Industry Revenue Million Forecast, by Charging Mode 2019 & 2032
- Table 18: Global Portable Power Bank Industry Revenue Million Forecast, by Application 2019 & 2032
- Table 19: Global Portable Power Bank Industry Revenue Million Forecast, by Country 2019 & 2032
- Table 20: Global Portable Power Bank Industry Revenue Million Forecast, by Capacity Range 2019 & 2032
- Table 21: Global Portable Power Bank Industry Revenue Million Forecast, by Charging Mode 2019 & 2032
- Table 22: Global Portable Power Bank Industry Revenue Million Forecast, by Application 2019 & 2032
- Table 23: Global Portable Power Bank Industry Revenue Million Forecast, by Country 2019 & 2032
- Table 24: Global Portable Power Bank Industry Revenue Million Forecast, by Capacity Range 2019 & 2032
- Table 25: Global Portable Power Bank Industry Revenue Million Forecast, by Charging Mode 2019 & 2032
- Table 26: Global Portable Power Bank Industry Revenue Million Forecast, by Application 2019 & 2032
- Table 27: Global Portable Power Bank Industry Revenue Million Forecast, by Country 2019 & 2032
- Table 28: Global Portable Power Bank Industry Revenue Million Forecast, by Capacity Range 2019 & 2032
- Table 29: Global Portable Power Bank Industry Revenue Million Forecast, by Charging Mode 2019 & 2032
- Table 30: Global Portable Power Bank Industry Revenue Million Forecast, by Application 2019 & 2032
- Table 31: Global Portable Power Bank Industry Revenue Million Forecast, by Country 2019 & 2032
- Table 32: Global Portable Power Bank Industry Revenue Million Forecast, by Capacity Range 2019 & 2032
- Table 33: Global Portable Power Bank Industry Revenue Million Forecast, by Charging Mode 2019 & 2032
- Table 34: Global Portable Power Bank Industry Revenue Million Forecast, by Application 2019 & 2032
- Table 35: Global Portable Power Bank Industry Revenue Million Forecast, by Country 2019 & 2032
Frequently Asked Questions
1. What is the projected Compound Annual Growth Rate (CAGR) of the Portable Power Bank Industry?
The projected CAGR is approximately 8.40%.
2. Which companies are prominent players in the Portable Power Bank Industry?
Key companies in the market include BBK Electronics (Realme), Lenovo Group Limited, Intex Technologies (India) Ltd, Huawei Technologies Limited*List Not Exhaustive, Syska Mobile Accessories, ADATA Technology Co Ltd, Xiaomi Corporation, Ambrane India Pvt Ltd, Koninklijke Philips NV, Panasonic Corporation, Sony Corporation.
3. What are the main segments of the Portable Power Bank Industry?
The market segments include Capacity Range, Charging Mode, Application.
4. Can you provide details about the market size?
The market size is estimated to be USD 13.59 Million as of 2022.
5. What are some drivers contributing to market growth?
Rapidly Increasing Demand for Portable Devices; Increasing E-commerce Sales Across the World.
6. What are the notable trends driving market growth?
Wireless Charging is Expected to Drive the Market Growth.
7. Are there any restraints impacting market growth?
Launch of Poor Quality Power Banks.
8. Can you provide examples of recent developments in the market?
Februray 2024 - BBK Group, has anoounced the production of its Oppo, Vivo and Realme smartphones in partnership with Indian manufacturers Dixon Technologies and Karbonn Group, said people with knowledge of the matter. This is partly owing to pressure from the government to get local partners and benefit from the production-linked incentive (PLI)
9. What pricing options are available for accessing the report?
Pricing options include single-user, multi-user, and enterprise licenses priced at USD 4750, USD 5250, and USD 8750 respectively.
10. Is the market size provided in terms of value or volume?
The market size is provided in terms of value, measured in Million.
11. Are there any specific market keywords associated with the report?
Yes, the market keyword associated with the report is "Portable Power Bank Industry," which aids in identifying and referencing the specific market segment covered.
12. How do I determine which pricing option suits my needs best?
The pricing options vary based on user requirements and access needs. Individual users may opt for single-user licenses, while businesses requiring broader access may choose multi-user or enterprise licenses for cost-effective access to the report.
13. Are there any additional resources or data provided in the Portable Power Bank Industry report?
While the report offers comprehensive insights, it's advisable to review the specific contents or supplementary materials provided to ascertain if additional resources or data are available.
14. How can I stay updated on further developments or reports in the Portable Power Bank Industry?
To stay informed about further developments, trends, and reports in the Portable Power Bank Industry, consider subscribing to industry newsletters, following relevant companies and organizations, or regularly checking reputable industry news sources and publications.
Methodology
Step 1 - Identification of Relevant Samples Size from Population Database


Step 2 - Approaches for Defining Global Market Size (Value, Volume* & Price*)

Note*: In applicable scenarios
Step 3 - Data Sources
Primary Research
- Web Analytics
- Survey Reports
- Research Institute
- Latest Research Reports
- Opinion Leaders
Secondary Research
- Annual Reports
- White Paper
- Latest Press Release
- Industry Association
- Paid Database
- Investor Presentations

Step 4 - Data Triangulation
Involves using different sources of information in order to increase the validity of a study
These sources are likely to be stakeholders in a program - participants, other researchers, program staff, other community members, and so on.
Then we put all data in single framework & apply various statistical tools to find out the dynamic on the market.
During the analysis stage, feedback from the stakeholder groups would be compared to determine areas of agreement as well as areas of divergence
