

Key Insights
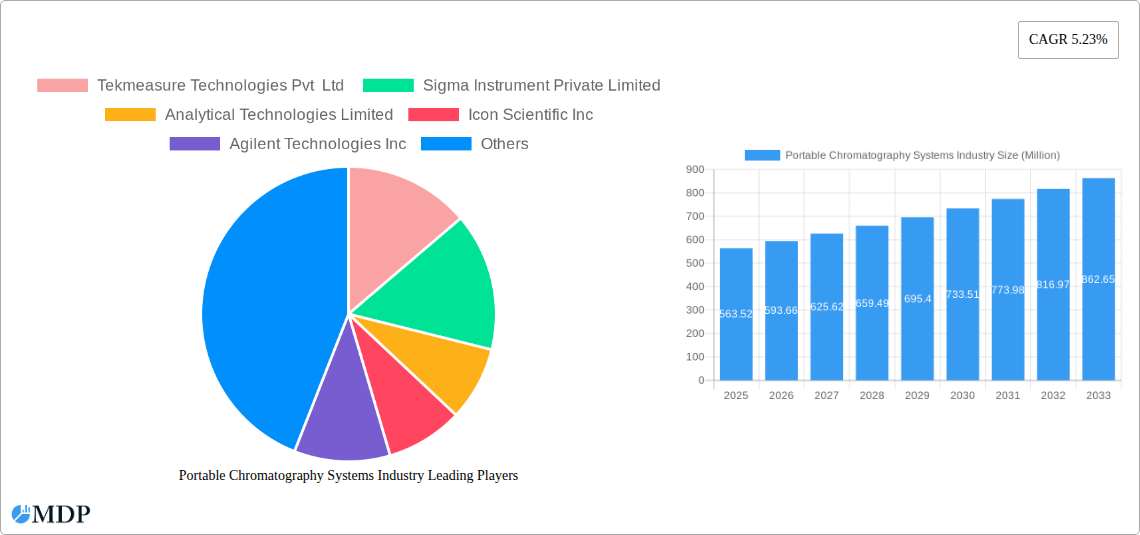
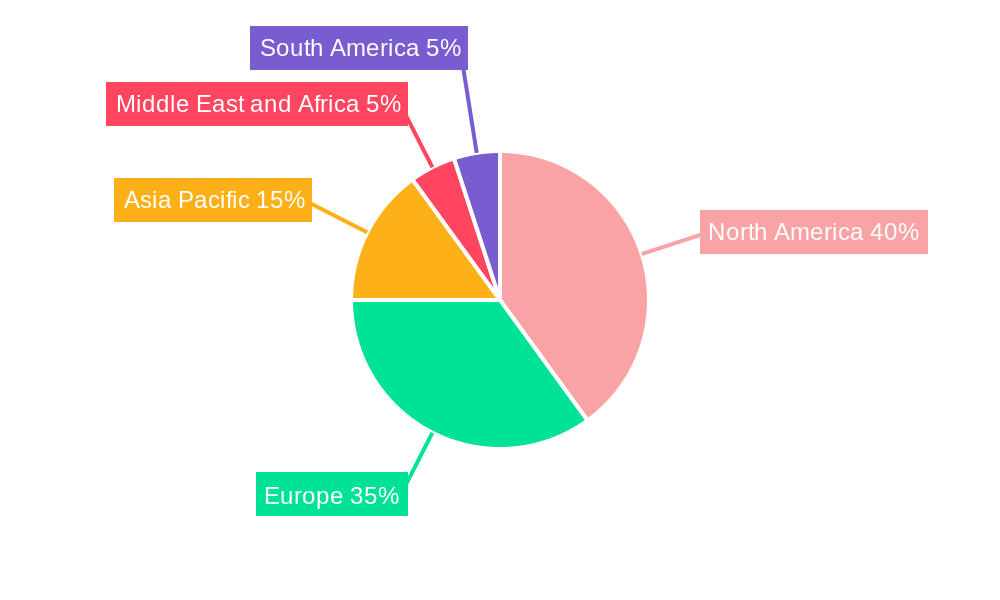
The portable chromatography systems market, valued at $563.52 million in 2025, is projected to experience robust growth, driven by increasing demand from biotechnology and pharmaceutical companies for on-site analysis, accelerating research activities in diverse fields, and the rising need for rapid, point-of-care diagnostics. The market's expansion is further fueled by technological advancements leading to smaller, more portable, and user-friendly systems, coupled with a growing preference for decentralized testing capabilities. This trend is particularly pronounced in remote locations and developing economies, where access to sophisticated laboratory infrastructure is limited. The segment encompassing portable gas chromatography systems currently dominates the market due to its widespread applications in environmental monitoring and process control. However, portable liquid chromatography systems are expected to witness significant growth fueled by advancements in miniaturization and the expanding use of these systems in clinical diagnostics and pharmaceutical quality control. The North American and European regions currently hold a significant share of the market, driven by robust research and development activities and a mature regulatory landscape. However, the Asia-Pacific region is anticipated to show the fastest growth rate due to rising healthcare expenditure, increasing investments in biotechnology, and expanding pharmaceutical manufacturing capabilities.
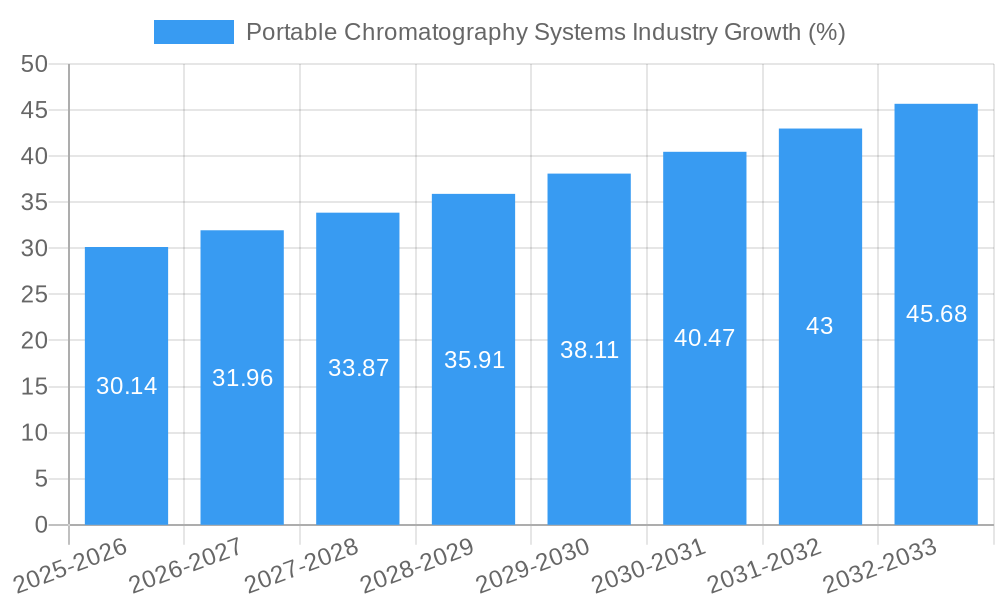
Despite the positive outlook, the market faces certain challenges. High initial investment costs associated with purchasing advanced portable chromatography systems can present a barrier to entry for smaller companies and research labs. Furthermore, regulatory hurdles and the need for skilled personnel to operate and maintain these systems could impede market growth in certain regions. Nevertheless, ongoing innovation in miniaturization, improved analytical capabilities, and the development of more cost-effective models are expected to mitigate these challenges in the coming years. Competition is intense, with established players like Agilent Technologies and PerkinElmer alongside smaller, specialized companies striving for market share through innovative products and strategic partnerships. The forecast period of 2025-2033 promises continued expansion, with a projected CAGR of 5.23%, driven by the ongoing convergence of technology and the growing demand for rapid, portable analytical solutions across various industries.
Portable Chromatography Systems Market: A Comprehensive Report (2019-2033)
This in-depth report provides a comprehensive analysis of the Portable Chromatography Systems market, offering invaluable insights for industry stakeholders, investors, and strategic decision-makers. From market dynamics and leading players to emerging opportunities and future growth projections, this report covers all key aspects of this rapidly evolving sector. The study period spans 2019-2033, with a base year of 2025 and a forecast period of 2025-2033. The global market size is projected to reach xx Million by 2033, exhibiting a robust CAGR of xx%.
Portable Chromatography Systems Industry Market Dynamics & Concentration
The Portable Chromatography Systems market is experiencing significant growth, driven by increasing demand from biotechnology and pharmaceutical companies, research laboratories, and other end-users. Market concentration is moderately high, with key players like Agilent Technologies Inc, PerkinElmer Inc, and INFICON holding significant market share, estimated at xx%, xx%, and xx% respectively, in 2025. Smaller players like Tekmeasure Technologies Pvt Ltd and Sigma Instrument Private Limited are focusing on niche applications to gain a foothold.
Innovation is a key driver, with continuous advancements in miniaturization, portability, and sensitivity of chromatography systems. Stringent regulatory frameworks, particularly in the pharmaceutical and healthcare sectors, influence product development and adoption. The market also faces competition from alternative analytical techniques.
Mergers and acquisitions (M&A) activity is moderate, with approximately xx M&A deals recorded between 2019 and 2024. These deals primarily focused on expanding product portfolios and geographical reach. End-user trends show a clear preference for portable systems offering faster analysis times, ease of use, and reduced operational costs.
- Market Concentration: Moderately high, with top 3 players holding xx% market share.
- Innovation Drivers: Miniaturization, improved sensitivity, ease of use.
- Regulatory Landscape: Stringent regulations, particularly in pharmaceuticals.
- M&A Activity: Approximately xx deals between 2019-2024.
- End-User Trends: Preference for faster analysis, user-friendliness, cost-effectiveness.
Portable Chromatography Systems Industry Industry Trends & Analysis
The Portable Chromatography Systems market is experiencing robust growth, fueled by several key factors. The increasing demand for on-site and rapid analysis in various applications, coupled with technological advancements leading to smaller, more efficient instruments, is a major driver. The CAGR during the forecast period (2025-2033) is estimated at xx%, indicating strong market expansion. Market penetration is currently at xx% and is projected to reach xx% by 2033. The rising adoption of portable gas chromatography (GC) systems in environmental monitoring and portable liquid chromatography (LC) systems in pharmaceutical quality control is further boosting market growth. Competitive dynamics are characterized by both established players and emerging companies, with a focus on product innovation and strategic partnerships to expand market reach. Consumer preferences are shifting towards systems offering better data management capabilities, increased durability, and enhanced portability.
Leading Markets & Segments in Portable Chromatography Systems Industry
The North American region dominates the global Portable Chromatography Systems market, driven by significant investments in research and development, a large pharmaceutical industry, and strong regulatory support. Within this region, the United States is the leading country.
- Dominant Region: North America
- Dominant Country: United States
- Key Drivers (North America): Strong R&D investments, large pharmaceutical sector, robust regulatory environment.
The Biotechnology and Pharmaceutical Companies segment holds the largest market share among end-users, owing to the critical need for rapid quality control testing. The Person Portable segment exhibits strong growth, propelled by demand for on-site analysis in diverse settings. The Portable Liquid Chromatography Systems segment dominates the type segment due to its widespread applications in various industries.
- Leading End-User Segment: Biotechnology and Pharmaceutical Companies
- Leading Portability Segment: Person Portable
- Leading Type Segment: Portable Liquid Chromatography Systems
- Key Drivers (Biotech/Pharma): Need for rapid quality control testing.
- Key Drivers (Person Portable): On-site analysis requirements in diverse fields.
- Key Drivers (Portable LC): Wide-ranging applications across various sectors.
Portable Chromatography Systems Industry Product Developments
Recent product innovations focus on improved sensitivity, miniaturization, and user-friendly interfaces. New applications are emerging in environmental monitoring, food safety, and forensic science. Competitive advantages are increasingly derived from superior data analysis capabilities, faster analysis times, and robust instrument design, enhancing the market fit of the systems. Technological trends indicate a shift towards advanced detection technologies and more sophisticated software integration to improve data analysis.
Key Drivers of Portable Chromatography Systems Industry Growth
Technological advancements, particularly in miniaturization and sensor technology, are key drivers of market expansion. Economic factors such as increasing research funding and government initiatives promoting scientific innovation further stimulate demand. Favorable regulatory policies and increasing awareness of environmental and health concerns are also positively influencing market growth.
Challenges in the Portable Chromatography Systems Industry Market
High initial investment costs for advanced systems represent a major barrier. Supply chain disruptions can impact the availability and cost of components. Intense competition among established players and emerging companies puts pressure on pricing and profit margins. These factors collectively exert significant influence over the overall market growth.
Emerging Opportunities in Portable Chromatography Systems Industry
Technological advancements, such as the integration of artificial intelligence and machine learning in data analysis, offer significant opportunities. Strategic partnerships between instrument manufacturers and software developers can enhance the functionality and market appeal of portable chromatography systems. Expansion into emerging markets and the development of customized solutions for niche applications are promising avenues for future growth.
Leading Players in the Portable Chromatography Systems Industry Sector
- Tekmeasure Technologies Pvt Ltd
- Sigma Instrument Private Limited
- Analytical Technologies Limited
- Icon Scientific Inc
- Agilent Technologies Inc
- PerkinElmer Inc
- INFICON
- Axcend
- FLIR Systems Inc
Key Milestones in Portable Chromatography Systems Industry Industry
- 2020: Launch of a new portable GC system by Agilent Technologies with enhanced sensitivity.
- 2021: Acquisition of a small chromatography company by PerkinElmer, expanding its product portfolio.
- 2022: Introduction of a user-friendly portable LC system by Icon Scientific.
- 2023: Significant increase in R&D funding for miniaturized chromatography systems.
- 2024: Several new partnerships formed for the development of integrated data analysis software.
Strategic Outlook for Portable Chromatography Systems Industry Market
The Portable Chromatography Systems market holds significant growth potential, driven by technological advancements, increasing demand from various industries, and favorable regulatory environments. Strategic opportunities exist in developing innovative products with enhanced capabilities, expanding into emerging markets, and forging strategic partnerships. Focusing on user-friendliness, data management, and cost-effectiveness will be crucial for future success in this dynamic sector.
Portable Chromatography Systems Industry Segmentation
-
1. Portability
- 1.1. Person Portable
- 1.2. Transportable
-
2. Type
- 2.1. Portable Gas Chromatography Systems
- 2.2. Portable Liquid Chromatography Systems
-
3. End-User
- 3.1. Biotechnology and Pharmaceutical Companies
- 3.2. Research Laboratories
- 3.3. Others
Portable Chromatography Systems Industry Segmentation By Geography
-
1. North America
- 1.1. United States
- 1.2. Canada
- 1.3. Mexico
-
2. Europe
- 2.1. Germany
- 2.2. United Kingdom
- 2.3. France
- 2.4. Italy
- 2.5. Spain
- 2.6. Rest of Europe
-
3. Asia Pacific
- 3.1. China
- 3.2. Japan
- 3.3. India
- 3.4. Australia
- 3.5. South Korea
- 3.6. Rest of Asia Pacific
-
4. Middle East and Africa
- 4.1. GCC
- 4.2. South Africa
- 4.3. Rest of Middle East and Africa
-
5. South America
- 5.1. Brazil
- 5.2. Argentina
- 5.3. Rest of South America
Portable Chromatography Systems Industry REPORT HIGHLIGHTS
| Aspects | Details |
|---|---|
| Study Period | 2019-2033 |
| Base Year | 2024 |
| Estimated Year | 2025 |
| Forecast Period | 2025-2033 |
| Historical Period | 2019-2024 |
| Growth Rate | CAGR of 5.23% from 2019-2033 |
| Segmentation |
|
Table of Contents
- 1. Introduction
- 1.1. Research Scope
- 1.2. Market Segmentation
- 1.3. Research Methodology
- 1.4. Definitions and Assumptions
- 2. Executive Summary
- 2.1. Introduction
- 3. Market Dynamics
- 3.1. Introduction
- 3.2. Market Drivers
- 3.2.1. ; Advancements in Device Technologies; Growing Applications of Portable Chromatography Systems
- 3.3. Market Restrains
- 3.3.1. ; High Cost of Portable Chromatography Techniques
- 3.4. Market Trends
- 3.4.1. Transportable Chromatography Systems to Grow at a Significant Rate
- 4. Market Factor Analysis
- 4.1. Porters Five Forces
- 4.2. Supply/Value Chain
- 4.3. PESTEL analysis
- 4.4. Market Entropy
- 4.5. Patent/Trademark Analysis
- 5. Global Portable Chromatography Systems Industry Analysis, Insights and Forecast, 2019-2031
- 5.1. Market Analysis, Insights and Forecast - by Portability
- 5.1.1. Person Portable
- 5.1.2. Transportable
- 5.2. Market Analysis, Insights and Forecast - by Type
- 5.2.1. Portable Gas Chromatography Systems
- 5.2.2. Portable Liquid Chromatography Systems
- 5.3. Market Analysis, Insights and Forecast - by End-User
- 5.3.1. Biotechnology and Pharmaceutical Companies
- 5.3.2. Research Laboratories
- 5.3.3. Others
- 5.4. Market Analysis, Insights and Forecast - by Region
- 5.4.1. North America
- 5.4.2. Europe
- 5.4.3. Asia Pacific
- 5.4.4. Middle East and Africa
- 5.4.5. South America
- 5.1. Market Analysis, Insights and Forecast - by Portability
- 6. North America Portable Chromatography Systems Industry Analysis, Insights and Forecast, 2019-2031
- 6.1. Market Analysis, Insights and Forecast - by Portability
- 6.1.1. Person Portable
- 6.1.2. Transportable
- 6.2. Market Analysis, Insights and Forecast - by Type
- 6.2.1. Portable Gas Chromatography Systems
- 6.2.2. Portable Liquid Chromatography Systems
- 6.3. Market Analysis, Insights and Forecast - by End-User
- 6.3.1. Biotechnology and Pharmaceutical Companies
- 6.3.2. Research Laboratories
- 6.3.3. Others
- 6.1. Market Analysis, Insights and Forecast - by Portability
- 7. Europe Portable Chromatography Systems Industry Analysis, Insights and Forecast, 2019-2031
- 7.1. Market Analysis, Insights and Forecast - by Portability
- 7.1.1. Person Portable
- 7.1.2. Transportable
- 7.2. Market Analysis, Insights and Forecast - by Type
- 7.2.1. Portable Gas Chromatography Systems
- 7.2.2. Portable Liquid Chromatography Systems
- 7.3. Market Analysis, Insights and Forecast - by End-User
- 7.3.1. Biotechnology and Pharmaceutical Companies
- 7.3.2. Research Laboratories
- 7.3.3. Others
- 7.1. Market Analysis, Insights and Forecast - by Portability
- 8. Asia Pacific Portable Chromatography Systems Industry Analysis, Insights and Forecast, 2019-2031
- 8.1. Market Analysis, Insights and Forecast - by Portability
- 8.1.1. Person Portable
- 8.1.2. Transportable
- 8.2. Market Analysis, Insights and Forecast - by Type
- 8.2.1. Portable Gas Chromatography Systems
- 8.2.2. Portable Liquid Chromatography Systems
- 8.3. Market Analysis, Insights and Forecast - by End-User
- 8.3.1. Biotechnology and Pharmaceutical Companies
- 8.3.2. Research Laboratories
- 8.3.3. Others
- 8.1. Market Analysis, Insights and Forecast - by Portability
- 9. Middle East and Africa Portable Chromatography Systems Industry Analysis, Insights and Forecast, 2019-2031
- 9.1. Market Analysis, Insights and Forecast - by Portability
- 9.1.1. Person Portable
- 9.1.2. Transportable
- 9.2. Market Analysis, Insights and Forecast - by Type
- 9.2.1. Portable Gas Chromatography Systems
- 9.2.2. Portable Liquid Chromatography Systems
- 9.3. Market Analysis, Insights and Forecast - by End-User
- 9.3.1. Biotechnology and Pharmaceutical Companies
- 9.3.2. Research Laboratories
- 9.3.3. Others
- 9.1. Market Analysis, Insights and Forecast - by Portability
- 10. South America Portable Chromatography Systems Industry Analysis, Insights and Forecast, 2019-2031
- 10.1. Market Analysis, Insights and Forecast - by Portability
- 10.1.1. Person Portable
- 10.1.2. Transportable
- 10.2. Market Analysis, Insights and Forecast - by Type
- 10.2.1. Portable Gas Chromatography Systems
- 10.2.2. Portable Liquid Chromatography Systems
- 10.3. Market Analysis, Insights and Forecast - by End-User
- 10.3.1. Biotechnology and Pharmaceutical Companies
- 10.3.2. Research Laboratories
- 10.3.3. Others
- 10.1. Market Analysis, Insights and Forecast - by Portability
- 11. North America Portable Chromatography Systems Industry Analysis, Insights and Forecast, 2019-2031
- 11.1. Market Analysis, Insights and Forecast - By Country/Sub-region
- 11.1.1 United States
- 11.1.2 Canada
- 11.1.3 Mexico
- 12. Europe Portable Chromatography Systems Industry Analysis, Insights and Forecast, 2019-2031
- 12.1. Market Analysis, Insights and Forecast - By Country/Sub-region
- 12.1.1 Germany
- 12.1.2 United Kingdom
- 12.1.3 France
- 12.1.4 Italy
- 12.1.5 Spain
- 12.1.6 Rest of Europe
- 13. Asia Pacific Portable Chromatography Systems Industry Analysis, Insights and Forecast, 2019-2031
- 13.1. Market Analysis, Insights and Forecast - By Country/Sub-region
- 13.1.1 China
- 13.1.2 Japan
- 13.1.3 India
- 13.1.4 Australia
- 13.1.5 South Korea
- 13.1.6 Rest of Asia Pacific
- 14. Middle East and Africa Portable Chromatography Systems Industry Analysis, Insights and Forecast, 2019-2031
- 14.1. Market Analysis, Insights and Forecast - By Country/Sub-region
- 14.1.1 GCC
- 14.1.2 South Africa
- 14.1.3 Rest of Middle East and Africa
- 15. South America Portable Chromatography Systems Industry Analysis, Insights and Forecast, 2019-2031
- 15.1. Market Analysis, Insights and Forecast - By Country/Sub-region
- 15.1.1 Brazil
- 15.1.2 Argentina
- 15.1.3 Rest of South America
- 16. Competitive Analysis
- 16.1. Global Market Share Analysis 2024
- 16.2. Company Profiles
- 16.2.1 Tekmeasure Technologies Pvt Ltd
- 16.2.1.1. Overview
- 16.2.1.2. Products
- 16.2.1.3. SWOT Analysis
- 16.2.1.4. Recent Developments
- 16.2.1.5. Financials (Based on Availability)
- 16.2.2 Sigma Instrument Private Limited
- 16.2.2.1. Overview
- 16.2.2.2. Products
- 16.2.2.3. SWOT Analysis
- 16.2.2.4. Recent Developments
- 16.2.2.5. Financials (Based on Availability)
- 16.2.3 Analytical Technologies Limited
- 16.2.3.1. Overview
- 16.2.3.2. Products
- 16.2.3.3. SWOT Analysis
- 16.2.3.4. Recent Developments
- 16.2.3.5. Financials (Based on Availability)
- 16.2.4 Icon Scientific Inc
- 16.2.4.1. Overview
- 16.2.4.2. Products
- 16.2.4.3. SWOT Analysis
- 16.2.4.4. Recent Developments
- 16.2.4.5. Financials (Based on Availability)
- 16.2.5 Agilent Technologies Inc
- 16.2.5.1. Overview
- 16.2.5.2. Products
- 16.2.5.3. SWOT Analysis
- 16.2.5.4. Recent Developments
- 16.2.5.5. Financials (Based on Availability)
- 16.2.6 PerkinElmer Inc
- 16.2.6.1. Overview
- 16.2.6.2. Products
- 16.2.6.3. SWOT Analysis
- 16.2.6.4. Recent Developments
- 16.2.6.5. Financials (Based on Availability)
- 16.2.7 INFICON
- 16.2.7.1. Overview
- 16.2.7.2. Products
- 16.2.7.3. SWOT Analysis
- 16.2.7.4. Recent Developments
- 16.2.7.5. Financials (Based on Availability)
- 16.2.8 Axcend
- 16.2.8.1. Overview
- 16.2.8.2. Products
- 16.2.8.3. SWOT Analysis
- 16.2.8.4. Recent Developments
- 16.2.8.5. Financials (Based on Availability)
- 16.2.9 FLIR Systems Inc
- 16.2.9.1. Overview
- 16.2.9.2. Products
- 16.2.9.3. SWOT Analysis
- 16.2.9.4. Recent Developments
- 16.2.9.5. Financials (Based on Availability)
- 16.2.1 Tekmeasure Technologies Pvt Ltd
List of Figures
- Figure 1: Global Portable Chromatography Systems Industry Revenue Breakdown (Million, %) by Region 2024 & 2032
- Figure 2: Global Portable Chromatography Systems Industry Volume Breakdown (K Unit, %) by Region 2024 & 2032
- Figure 3: North America Portable Chromatography Systems Industry Revenue (Million), by Country 2024 & 2032
- Figure 4: North America Portable Chromatography Systems Industry Volume (K Unit), by Country 2024 & 2032
- Figure 5: North America Portable Chromatography Systems Industry Revenue Share (%), by Country 2024 & 2032
- Figure 6: North America Portable Chromatography Systems Industry Volume Share (%), by Country 2024 & 2032
- Figure 7: Europe Portable Chromatography Systems Industry Revenue (Million), by Country 2024 & 2032
- Figure 8: Europe Portable Chromatography Systems Industry Volume (K Unit), by Country 2024 & 2032
- Figure 9: Europe Portable Chromatography Systems Industry Revenue Share (%), by Country 2024 & 2032
- Figure 10: Europe Portable Chromatography Systems Industry Volume Share (%), by Country 2024 & 2032
- Figure 11: Asia Pacific Portable Chromatography Systems Industry Revenue (Million), by Country 2024 & 2032
- Figure 12: Asia Pacific Portable Chromatography Systems Industry Volume (K Unit), by Country 2024 & 2032
- Figure 13: Asia Pacific Portable Chromatography Systems Industry Revenue Share (%), by Country 2024 & 2032
- Figure 14: Asia Pacific Portable Chromatography Systems Industry Volume Share (%), by Country 2024 & 2032
- Figure 15: Middle East and Africa Portable Chromatography Systems Industry Revenue (Million), by Country 2024 & 2032
- Figure 16: Middle East and Africa Portable Chromatography Systems Industry Volume (K Unit), by Country 2024 & 2032
- Figure 17: Middle East and Africa Portable Chromatography Systems Industry Revenue Share (%), by Country 2024 & 2032
- Figure 18: Middle East and Africa Portable Chromatography Systems Industry Volume Share (%), by Country 2024 & 2032
- Figure 19: South America Portable Chromatography Systems Industry Revenue (Million), by Country 2024 & 2032
- Figure 20: South America Portable Chromatography Systems Industry Volume (K Unit), by Country 2024 & 2032
- Figure 21: South America Portable Chromatography Systems Industry Revenue Share (%), by Country 2024 & 2032
- Figure 22: South America Portable Chromatography Systems Industry Volume Share (%), by Country 2024 & 2032
- Figure 23: North America Portable Chromatography Systems Industry Revenue (Million), by Portability 2024 & 2032
- Figure 24: North America Portable Chromatography Systems Industry Volume (K Unit), by Portability 2024 & 2032
- Figure 25: North America Portable Chromatography Systems Industry Revenue Share (%), by Portability 2024 & 2032
- Figure 26: North America Portable Chromatography Systems Industry Volume Share (%), by Portability 2024 & 2032
- Figure 27: North America Portable Chromatography Systems Industry Revenue (Million), by Type 2024 & 2032
- Figure 28: North America Portable Chromatography Systems Industry Volume (K Unit), by Type 2024 & 2032
- Figure 29: North America Portable Chromatography Systems Industry Revenue Share (%), by Type 2024 & 2032
- Figure 30: North America Portable Chromatography Systems Industry Volume Share (%), by Type 2024 & 2032
- Figure 31: North America Portable Chromatography Systems Industry Revenue (Million), by End-User 2024 & 2032
- Figure 32: North America Portable Chromatography Systems Industry Volume (K Unit), by End-User 2024 & 2032
- Figure 33: North America Portable Chromatography Systems Industry Revenue Share (%), by End-User 2024 & 2032
- Figure 34: North America Portable Chromatography Systems Industry Volume Share (%), by End-User 2024 & 2032
- Figure 35: North America Portable Chromatography Systems Industry Revenue (Million), by Country 2024 & 2032
- Figure 36: North America Portable Chromatography Systems Industry Volume (K Unit), by Country 2024 & 2032
- Figure 37: North America Portable Chromatography Systems Industry Revenue Share (%), by Country 2024 & 2032
- Figure 38: North America Portable Chromatography Systems Industry Volume Share (%), by Country 2024 & 2032
- Figure 39: Europe Portable Chromatography Systems Industry Revenue (Million), by Portability 2024 & 2032
- Figure 40: Europe Portable Chromatography Systems Industry Volume (K Unit), by Portability 2024 & 2032
- Figure 41: Europe Portable Chromatography Systems Industry Revenue Share (%), by Portability 2024 & 2032
- Figure 42: Europe Portable Chromatography Systems Industry Volume Share (%), by Portability 2024 & 2032
- Figure 43: Europe Portable Chromatography Systems Industry Revenue (Million), by Type 2024 & 2032
- Figure 44: Europe Portable Chromatography Systems Industry Volume (K Unit), by Type 2024 & 2032
- Figure 45: Europe Portable Chromatography Systems Industry Revenue Share (%), by Type 2024 & 2032
- Figure 46: Europe Portable Chromatography Systems Industry Volume Share (%), by Type 2024 & 2032
- Figure 47: Europe Portable Chromatography Systems Industry Revenue (Million), by End-User 2024 & 2032
- Figure 48: Europe Portable Chromatography Systems Industry Volume (K Unit), by End-User 2024 & 2032
- Figure 49: Europe Portable Chromatography Systems Industry Revenue Share (%), by End-User 2024 & 2032
- Figure 50: Europe Portable Chromatography Systems Industry Volume Share (%), by End-User 2024 & 2032
- Figure 51: Europe Portable Chromatography Systems Industry Revenue (Million), by Country 2024 & 2032
- Figure 52: Europe Portable Chromatography Systems Industry Volume (K Unit), by Country 2024 & 2032
- Figure 53: Europe Portable Chromatography Systems Industry Revenue Share (%), by Country 2024 & 2032
- Figure 54: Europe Portable Chromatography Systems Industry Volume Share (%), by Country 2024 & 2032
- Figure 55: Asia Pacific Portable Chromatography Systems Industry Revenue (Million), by Portability 2024 & 2032
- Figure 56: Asia Pacific Portable Chromatography Systems Industry Volume (K Unit), by Portability 2024 & 2032
- Figure 57: Asia Pacific Portable Chromatography Systems Industry Revenue Share (%), by Portability 2024 & 2032
- Figure 58: Asia Pacific Portable Chromatography Systems Industry Volume Share (%), by Portability 2024 & 2032
- Figure 59: Asia Pacific Portable Chromatography Systems Industry Revenue (Million), by Type 2024 & 2032
- Figure 60: Asia Pacific Portable Chromatography Systems Industry Volume (K Unit), by Type 2024 & 2032
- Figure 61: Asia Pacific Portable Chromatography Systems Industry Revenue Share (%), by Type 2024 & 2032
- Figure 62: Asia Pacific Portable Chromatography Systems Industry Volume Share (%), by Type 2024 & 2032
- Figure 63: Asia Pacific Portable Chromatography Systems Industry Revenue (Million), by End-User 2024 & 2032
- Figure 64: Asia Pacific Portable Chromatography Systems Industry Volume (K Unit), by End-User 2024 & 2032
- Figure 65: Asia Pacific Portable Chromatography Systems Industry Revenue Share (%), by End-User 2024 & 2032
- Figure 66: Asia Pacific Portable Chromatography Systems Industry Volume Share (%), by End-User 2024 & 2032
- Figure 67: Asia Pacific Portable Chromatography Systems Industry Revenue (Million), by Country 2024 & 2032
- Figure 68: Asia Pacific Portable Chromatography Systems Industry Volume (K Unit), by Country 2024 & 2032
- Figure 69: Asia Pacific Portable Chromatography Systems Industry Revenue Share (%), by Country 2024 & 2032
- Figure 70: Asia Pacific Portable Chromatography Systems Industry Volume Share (%), by Country 2024 & 2032
- Figure 71: Middle East and Africa Portable Chromatography Systems Industry Revenue (Million), by Portability 2024 & 2032
- Figure 72: Middle East and Africa Portable Chromatography Systems Industry Volume (K Unit), by Portability 2024 & 2032
- Figure 73: Middle East and Africa Portable Chromatography Systems Industry Revenue Share (%), by Portability 2024 & 2032
- Figure 74: Middle East and Africa Portable Chromatography Systems Industry Volume Share (%), by Portability 2024 & 2032
- Figure 75: Middle East and Africa Portable Chromatography Systems Industry Revenue (Million), by Type 2024 & 2032
- Figure 76: Middle East and Africa Portable Chromatography Systems Industry Volume (K Unit), by Type 2024 & 2032
- Figure 77: Middle East and Africa Portable Chromatography Systems Industry Revenue Share (%), by Type 2024 & 2032
- Figure 78: Middle East and Africa Portable Chromatography Systems Industry Volume Share (%), by Type 2024 & 2032
- Figure 79: Middle East and Africa Portable Chromatography Systems Industry Revenue (Million), by End-User 2024 & 2032
- Figure 80: Middle East and Africa Portable Chromatography Systems Industry Volume (K Unit), by End-User 2024 & 2032
- Figure 81: Middle East and Africa Portable Chromatography Systems Industry Revenue Share (%), by End-User 2024 & 2032
- Figure 82: Middle East and Africa Portable Chromatography Systems Industry Volume Share (%), by End-User 2024 & 2032
- Figure 83: Middle East and Africa Portable Chromatography Systems Industry Revenue (Million), by Country 2024 & 2032
- Figure 84: Middle East and Africa Portable Chromatography Systems Industry Volume (K Unit), by Country 2024 & 2032
- Figure 85: Middle East and Africa Portable Chromatography Systems Industry Revenue Share (%), by Country 2024 & 2032
- Figure 86: Middle East and Africa Portable Chromatography Systems Industry Volume Share (%), by Country 2024 & 2032
- Figure 87: South America Portable Chromatography Systems Industry Revenue (Million), by Portability 2024 & 2032
- Figure 88: South America Portable Chromatography Systems Industry Volume (K Unit), by Portability 2024 & 2032
- Figure 89: South America Portable Chromatography Systems Industry Revenue Share (%), by Portability 2024 & 2032
- Figure 90: South America Portable Chromatography Systems Industry Volume Share (%), by Portability 2024 & 2032
- Figure 91: South America Portable Chromatography Systems Industry Revenue (Million), by Type 2024 & 2032
- Figure 92: South America Portable Chromatography Systems Industry Volume (K Unit), by Type 2024 & 2032
- Figure 93: South America Portable Chromatography Systems Industry Revenue Share (%), by Type 2024 & 2032
- Figure 94: South America Portable Chromatography Systems Industry Volume Share (%), by Type 2024 & 2032
- Figure 95: South America Portable Chromatography Systems Industry Revenue (Million), by End-User 2024 & 2032
- Figure 96: South America Portable Chromatography Systems Industry Volume (K Unit), by End-User 2024 & 2032
- Figure 97: South America Portable Chromatography Systems Industry Revenue Share (%), by End-User 2024 & 2032
- Figure 98: South America Portable Chromatography Systems Industry Volume Share (%), by End-User 2024 & 2032
- Figure 99: South America Portable Chromatography Systems Industry Revenue (Million), by Country 2024 & 2032
- Figure 100: South America Portable Chromatography Systems Industry Volume (K Unit), by Country 2024 & 2032
- Figure 101: South America Portable Chromatography Systems Industry Revenue Share (%), by Country 2024 & 2032
- Figure 102: South America Portable Chromatography Systems Industry Volume Share (%), by Country 2024 & 2032
List of Tables
- Table 1: Global Portable Chromatography Systems Industry Revenue Million Forecast, by Region 2019 & 2032
- Table 2: Global Portable Chromatography Systems Industry Volume K Unit Forecast, by Region 2019 & 2032
- Table 3: Global Portable Chromatography Systems Industry Revenue Million Forecast, by Portability 2019 & 2032
- Table 4: Global Portable Chromatography Systems Industry Volume K Unit Forecast, by Portability 2019 & 2032
- Table 5: Global Portable Chromatography Systems Industry Revenue Million Forecast, by Type 2019 & 2032
- Table 6: Global Portable Chromatography Systems Industry Volume K Unit Forecast, by Type 2019 & 2032
- Table 7: Global Portable Chromatography Systems Industry Revenue Million Forecast, by End-User 2019 & 2032
- Table 8: Global Portable Chromatography Systems Industry Volume K Unit Forecast, by End-User 2019 & 2032
- Table 9: Global Portable Chromatography Systems Industry Revenue Million Forecast, by Region 2019 & 2032
- Table 10: Global Portable Chromatography Systems Industry Volume K Unit Forecast, by Region 2019 & 2032
- Table 11: Global Portable Chromatography Systems Industry Revenue Million Forecast, by Country 2019 & 2032
- Table 12: Global Portable Chromatography Systems Industry Volume K Unit Forecast, by Country 2019 & 2032
- Table 13: United States Portable Chromatography Systems Industry Revenue (Million) Forecast, by Application 2019 & 2032
- Table 14: United States Portable Chromatography Systems Industry Volume (K Unit) Forecast, by Application 2019 & 2032
- Table 15: Canada Portable Chromatography Systems Industry Revenue (Million) Forecast, by Application 2019 & 2032
- Table 16: Canada Portable Chromatography Systems Industry Volume (K Unit) Forecast, by Application 2019 & 2032
- Table 17: Mexico Portable Chromatography Systems Industry Revenue (Million) Forecast, by Application 2019 & 2032
- Table 18: Mexico Portable Chromatography Systems Industry Volume (K Unit) Forecast, by Application 2019 & 2032
- Table 19: Global Portable Chromatography Systems Industry Revenue Million Forecast, by Country 2019 & 2032
- Table 20: Global Portable Chromatography Systems Industry Volume K Unit Forecast, by Country 2019 & 2032
- Table 21: Germany Portable Chromatography Systems Industry Revenue (Million) Forecast, by Application 2019 & 2032
- Table 22: Germany Portable Chromatography Systems Industry Volume (K Unit) Forecast, by Application 2019 & 2032
- Table 23: United Kingdom Portable Chromatography Systems Industry Revenue (Million) Forecast, by Application 2019 & 2032
- Table 24: United Kingdom Portable Chromatography Systems Industry Volume (K Unit) Forecast, by Application 2019 & 2032
- Table 25: France Portable Chromatography Systems Industry Revenue (Million) Forecast, by Application 2019 & 2032
- Table 26: France Portable Chromatography Systems Industry Volume (K Unit) Forecast, by Application 2019 & 2032
- Table 27: Italy Portable Chromatography Systems Industry Revenue (Million) Forecast, by Application 2019 & 2032
- Table 28: Italy Portable Chromatography Systems Industry Volume (K Unit) Forecast, by Application 2019 & 2032
- Table 29: Spain Portable Chromatography Systems Industry Revenue (Million) Forecast, by Application 2019 & 2032
- Table 30: Spain Portable Chromatography Systems Industry Volume (K Unit) Forecast, by Application 2019 & 2032
- Table 31: Rest of Europe Portable Chromatography Systems Industry Revenue (Million) Forecast, by Application 2019 & 2032
- Table 32: Rest of Europe Portable Chromatography Systems Industry Volume (K Unit) Forecast, by Application 2019 & 2032
- Table 33: Global Portable Chromatography Systems Industry Revenue Million Forecast, by Country 2019 & 2032
- Table 34: Global Portable Chromatography Systems Industry Volume K Unit Forecast, by Country 2019 & 2032
- Table 35: China Portable Chromatography Systems Industry Revenue (Million) Forecast, by Application 2019 & 2032
- Table 36: China Portable Chromatography Systems Industry Volume (K Unit) Forecast, by Application 2019 & 2032
- Table 37: Japan Portable Chromatography Systems Industry Revenue (Million) Forecast, by Application 2019 & 2032
- Table 38: Japan Portable Chromatography Systems Industry Volume (K Unit) Forecast, by Application 2019 & 2032
- Table 39: India Portable Chromatography Systems Industry Revenue (Million) Forecast, by Application 2019 & 2032
- Table 40: India Portable Chromatography Systems Industry Volume (K Unit) Forecast, by Application 2019 & 2032
- Table 41: Australia Portable Chromatography Systems Industry Revenue (Million) Forecast, by Application 2019 & 2032
- Table 42: Australia Portable Chromatography Systems Industry Volume (K Unit) Forecast, by Application 2019 & 2032
- Table 43: South Korea Portable Chromatography Systems Industry Revenue (Million) Forecast, by Application 2019 & 2032
- Table 44: South Korea Portable Chromatography Systems Industry Volume (K Unit) Forecast, by Application 2019 & 2032
- Table 45: Rest of Asia Pacific Portable Chromatography Systems Industry Revenue (Million) Forecast, by Application 2019 & 2032
- Table 46: Rest of Asia Pacific Portable Chromatography Systems Industry Volume (K Unit) Forecast, by Application 2019 & 2032
- Table 47: Global Portable Chromatography Systems Industry Revenue Million Forecast, by Country 2019 & 2032
- Table 48: Global Portable Chromatography Systems Industry Volume K Unit Forecast, by Country 2019 & 2032
- Table 49: GCC Portable Chromatography Systems Industry Revenue (Million) Forecast, by Application 2019 & 2032
- Table 50: GCC Portable Chromatography Systems Industry Volume (K Unit) Forecast, by Application 2019 & 2032
- Table 51: South Africa Portable Chromatography Systems Industry Revenue (Million) Forecast, by Application 2019 & 2032
- Table 52: South Africa Portable Chromatography Systems Industry Volume (K Unit) Forecast, by Application 2019 & 2032
- Table 53: Rest of Middle East and Africa Portable Chromatography Systems Industry Revenue (Million) Forecast, by Application 2019 & 2032
- Table 54: Rest of Middle East and Africa Portable Chromatography Systems Industry Volume (K Unit) Forecast, by Application 2019 & 2032
- Table 55: Global Portable Chromatography Systems Industry Revenue Million Forecast, by Country 2019 & 2032
- Table 56: Global Portable Chromatography Systems Industry Volume K Unit Forecast, by Country 2019 & 2032
- Table 57: Brazil Portable Chromatography Systems Industry Revenue (Million) Forecast, by Application 2019 & 2032
- Table 58: Brazil Portable Chromatography Systems Industry Volume (K Unit) Forecast, by Application 2019 & 2032
- Table 59: Argentina Portable Chromatography Systems Industry Revenue (Million) Forecast, by Application 2019 & 2032
- Table 60: Argentina Portable Chromatography Systems Industry Volume (K Unit) Forecast, by Application 2019 & 2032
- Table 61: Rest of South America Portable Chromatography Systems Industry Revenue (Million) Forecast, by Application 2019 & 2032
- Table 62: Rest of South America Portable Chromatography Systems Industry Volume (K Unit) Forecast, by Application 2019 & 2032
- Table 63: Global Portable Chromatography Systems Industry Revenue Million Forecast, by Portability 2019 & 2032
- Table 64: Global Portable Chromatography Systems Industry Volume K Unit Forecast, by Portability 2019 & 2032
- Table 65: Global Portable Chromatography Systems Industry Revenue Million Forecast, by Type 2019 & 2032
- Table 66: Global Portable Chromatography Systems Industry Volume K Unit Forecast, by Type 2019 & 2032
- Table 67: Global Portable Chromatography Systems Industry Revenue Million Forecast, by End-User 2019 & 2032
- Table 68: Global Portable Chromatography Systems Industry Volume K Unit Forecast, by End-User 2019 & 2032
- Table 69: Global Portable Chromatography Systems Industry Revenue Million Forecast, by Country 2019 & 2032
- Table 70: Global Portable Chromatography Systems Industry Volume K Unit Forecast, by Country 2019 & 2032
- Table 71: United States Portable Chromatography Systems Industry Revenue (Million) Forecast, by Application 2019 & 2032
- Table 72: United States Portable Chromatography Systems Industry Volume (K Unit) Forecast, by Application 2019 & 2032
- Table 73: Canada Portable Chromatography Systems Industry Revenue (Million) Forecast, by Application 2019 & 2032
- Table 74: Canada Portable Chromatography Systems Industry Volume (K Unit) Forecast, by Application 2019 & 2032
- Table 75: Mexico Portable Chromatography Systems Industry Revenue (Million) Forecast, by Application 2019 & 2032
- Table 76: Mexico Portable Chromatography Systems Industry Volume (K Unit) Forecast, by Application 2019 & 2032
- Table 77: Global Portable Chromatography Systems Industry Revenue Million Forecast, by Portability 2019 & 2032
- Table 78: Global Portable Chromatography Systems Industry Volume K Unit Forecast, by Portability 2019 & 2032
- Table 79: Global Portable Chromatography Systems Industry Revenue Million Forecast, by Type 2019 & 2032
- Table 80: Global Portable Chromatography Systems Industry Volume K Unit Forecast, by Type 2019 & 2032
- Table 81: Global Portable Chromatography Systems Industry Revenue Million Forecast, by End-User 2019 & 2032
- Table 82: Global Portable Chromatography Systems Industry Volume K Unit Forecast, by End-User 2019 & 2032
- Table 83: Global Portable Chromatography Systems Industry Revenue Million Forecast, by Country 2019 & 2032
- Table 84: Global Portable Chromatography Systems Industry Volume K Unit Forecast, by Country 2019 & 2032
- Table 85: Germany Portable Chromatography Systems Industry Revenue (Million) Forecast, by Application 2019 & 2032
- Table 86: Germany Portable Chromatography Systems Industry Volume (K Unit) Forecast, by Application 2019 & 2032
- Table 87: United Kingdom Portable Chromatography Systems Industry Revenue (Million) Forecast, by Application 2019 & 2032
- Table 88: United Kingdom Portable Chromatography Systems Industry Volume (K Unit) Forecast, by Application 2019 & 2032
- Table 89: France Portable Chromatography Systems Industry Revenue (Million) Forecast, by Application 2019 & 2032
- Table 90: France Portable Chromatography Systems Industry Volume (K Unit) Forecast, by Application 2019 & 2032
- Table 91: Italy Portable Chromatography Systems Industry Revenue (Million) Forecast, by Application 2019 & 2032
- Table 92: Italy Portable Chromatography Systems Industry Volume (K Unit) Forecast, by Application 2019 & 2032
- Table 93: Spain Portable Chromatography Systems Industry Revenue (Million) Forecast, by Application 2019 & 2032
- Table 94: Spain Portable Chromatography Systems Industry Volume (K Unit) Forecast, by Application 2019 & 2032
- Table 95: Rest of Europe Portable Chromatography Systems Industry Revenue (Million) Forecast, by Application 2019 & 2032
- Table 96: Rest of Europe Portable Chromatography Systems Industry Volume (K Unit) Forecast, by Application 2019 & 2032
- Table 97: Global Portable Chromatography Systems Industry Revenue Million Forecast, by Portability 2019 & 2032
- Table 98: Global Portable Chromatography Systems Industry Volume K Unit Forecast, by Portability 2019 & 2032
- Table 99: Global Portable Chromatography Systems Industry Revenue Million Forecast, by Type 2019 & 2032
- Table 100: Global Portable Chromatography Systems Industry Volume K Unit Forecast, by Type 2019 & 2032
- Table 101: Global Portable Chromatography Systems Industry Revenue Million Forecast, by End-User 2019 & 2032
- Table 102: Global Portable Chromatography Systems Industry Volume K Unit Forecast, by End-User 2019 & 2032
- Table 103: Global Portable Chromatography Systems Industry Revenue Million Forecast, by Country 2019 & 2032
- Table 104: Global Portable Chromatography Systems Industry Volume K Unit Forecast, by Country 2019 & 2032
- Table 105: China Portable Chromatography Systems Industry Revenue (Million) Forecast, by Application 2019 & 2032
- Table 106: China Portable Chromatography Systems Industry Volume (K Unit) Forecast, by Application 2019 & 2032
- Table 107: Japan Portable Chromatography Systems Industry Revenue (Million) Forecast, by Application 2019 & 2032
- Table 108: Japan Portable Chromatography Systems Industry Volume (K Unit) Forecast, by Application 2019 & 2032
- Table 109: India Portable Chromatography Systems Industry Revenue (Million) Forecast, by Application 2019 & 2032
- Table 110: India Portable Chromatography Systems Industry Volume (K Unit) Forecast, by Application 2019 & 2032
- Table 111: Australia Portable Chromatography Systems Industry Revenue (Million) Forecast, by Application 2019 & 2032
- Table 112: Australia Portable Chromatography Systems Industry Volume (K Unit) Forecast, by Application 2019 & 2032
- Table 113: South Korea Portable Chromatography Systems Industry Revenue (Million) Forecast, by Application 2019 & 2032
- Table 114: South Korea Portable Chromatography Systems Industry Volume (K Unit) Forecast, by Application 2019 & 2032
- Table 115: Rest of Asia Pacific Portable Chromatography Systems Industry Revenue (Million) Forecast, by Application 2019 & 2032
- Table 116: Rest of Asia Pacific Portable Chromatography Systems Industry Volume (K Unit) Forecast, by Application 2019 & 2032
- Table 117: Global Portable Chromatography Systems Industry Revenue Million Forecast, by Portability 2019 & 2032
- Table 118: Global Portable Chromatography Systems Industry Volume K Unit Forecast, by Portability 2019 & 2032
- Table 119: Global Portable Chromatography Systems Industry Revenue Million Forecast, by Type 2019 & 2032
- Table 120: Global Portable Chromatography Systems Industry Volume K Unit Forecast, by Type 2019 & 2032
- Table 121: Global Portable Chromatography Systems Industry Revenue Million Forecast, by End-User 2019 & 2032
- Table 122: Global Portable Chromatography Systems Industry Volume K Unit Forecast, by End-User 2019 & 2032
- Table 123: Global Portable Chromatography Systems Industry Revenue Million Forecast, by Country 2019 & 2032
- Table 124: Global Portable Chromatography Systems Industry Volume K Unit Forecast, by Country 2019 & 2032
- Table 125: GCC Portable Chromatography Systems Industry Revenue (Million) Forecast, by Application 2019 & 2032
- Table 126: GCC Portable Chromatography Systems Industry Volume (K Unit) Forecast, by Application 2019 & 2032
- Table 127: South Africa Portable Chromatography Systems Industry Revenue (Million) Forecast, by Application 2019 & 2032
- Table 128: South Africa Portable Chromatography Systems Industry Volume (K Unit) Forecast, by Application 2019 & 2032
- Table 129: Rest of Middle East and Africa Portable Chromatography Systems Industry Revenue (Million) Forecast, by Application 2019 & 2032
- Table 130: Rest of Middle East and Africa Portable Chromatography Systems Industry Volume (K Unit) Forecast, by Application 2019 & 2032
- Table 131: Global Portable Chromatography Systems Industry Revenue Million Forecast, by Portability 2019 & 2032
- Table 132: Global Portable Chromatography Systems Industry Volume K Unit Forecast, by Portability 2019 & 2032
- Table 133: Global Portable Chromatography Systems Industry Revenue Million Forecast, by Type 2019 & 2032
- Table 134: Global Portable Chromatography Systems Industry Volume K Unit Forecast, by Type 2019 & 2032
- Table 135: Global Portable Chromatography Systems Industry Revenue Million Forecast, by End-User 2019 & 2032
- Table 136: Global Portable Chromatography Systems Industry Volume K Unit Forecast, by End-User 2019 & 2032
- Table 137: Global Portable Chromatography Systems Industry Revenue Million Forecast, by Country 2019 & 2032
- Table 138: Global Portable Chromatography Systems Industry Volume K Unit Forecast, by Country 2019 & 2032
- Table 139: Brazil Portable Chromatography Systems Industry Revenue (Million) Forecast, by Application 2019 & 2032
- Table 140: Brazil Portable Chromatography Systems Industry Volume (K Unit) Forecast, by Application 2019 & 2032
- Table 141: Argentina Portable Chromatography Systems Industry Revenue (Million) Forecast, by Application 2019 & 2032
- Table 142: Argentina Portable Chromatography Systems Industry Volume (K Unit) Forecast, by Application 2019 & 2032
- Table 143: Rest of South America Portable Chromatography Systems Industry Revenue (Million) Forecast, by Application 2019 & 2032
- Table 144: Rest of South America Portable Chromatography Systems Industry Volume (K Unit) Forecast, by Application 2019 & 2032
Frequently Asked Questions
1. What is the projected Compound Annual Growth Rate (CAGR) of the Portable Chromatography Systems Industry?
The projected CAGR is approximately 5.23%.
2. Which companies are prominent players in the Portable Chromatography Systems Industry?
Key companies in the market include Tekmeasure Technologies Pvt Ltd , Sigma Instrument Private Limited, Analytical Technologies Limited, Icon Scientific Inc, Agilent Technologies Inc, PerkinElmer Inc, INFICON, Axcend, FLIR Systems Inc.
3. What are the main segments of the Portable Chromatography Systems Industry?
The market segments include Portability, Type, End-User.
4. Can you provide details about the market size?
The market size is estimated to be USD 563.52 Million as of 2022.
5. What are some drivers contributing to market growth?
; Advancements in Device Technologies; Growing Applications of Portable Chromatography Systems.
6. What are the notable trends driving market growth?
Transportable Chromatography Systems to Grow at a Significant Rate.
7. Are there any restraints impacting market growth?
; High Cost of Portable Chromatography Techniques.
8. Can you provide examples of recent developments in the market?
N/A
9. What pricing options are available for accessing the report?
Pricing options include single-user, multi-user, and enterprise licenses priced at USD 4750, USD 5250, and USD 8750 respectively.
10. Is the market size provided in terms of value or volume?
The market size is provided in terms of value, measured in Million and volume, measured in K Unit.
11. Are there any specific market keywords associated with the report?
Yes, the market keyword associated with the report is "Portable Chromatography Systems Industry," which aids in identifying and referencing the specific market segment covered.
12. How do I determine which pricing option suits my needs best?
The pricing options vary based on user requirements and access needs. Individual users may opt for single-user licenses, while businesses requiring broader access may choose multi-user or enterprise licenses for cost-effective access to the report.
13. Are there any additional resources or data provided in the Portable Chromatography Systems Industry report?
While the report offers comprehensive insights, it's advisable to review the specific contents or supplementary materials provided to ascertain if additional resources or data are available.
14. How can I stay updated on further developments or reports in the Portable Chromatography Systems Industry?
To stay informed about further developments, trends, and reports in the Portable Chromatography Systems Industry, consider subscribing to industry newsletters, following relevant companies and organizations, or regularly checking reputable industry news sources and publications.
Methodology
Step 1 - Identification of Relevant Samples Size from Population Database


Step 2 - Approaches for Defining Global Market Size (Value, Volume* & Price*)

Note*: In applicable scenarios
Step 3 - Data Sources
Primary Research
- Web Analytics
- Survey Reports
- Research Institute
- Latest Research Reports
- Opinion Leaders
Secondary Research
- Annual Reports
- White Paper
- Latest Press Release
- Industry Association
- Paid Database
- Investor Presentations

Step 4 - Data Triangulation
Involves using different sources of information in order to increase the validity of a study
These sources are likely to be stakeholders in a program - participants, other researchers, program staff, other community members, and so on.
Then we put all data in single framework & apply various statistical tools to find out the dynamic on the market.
During the analysis stage, feedback from the stakeholder groups would be compared to determine areas of agreement as well as areas of divergence
