

Key Insights
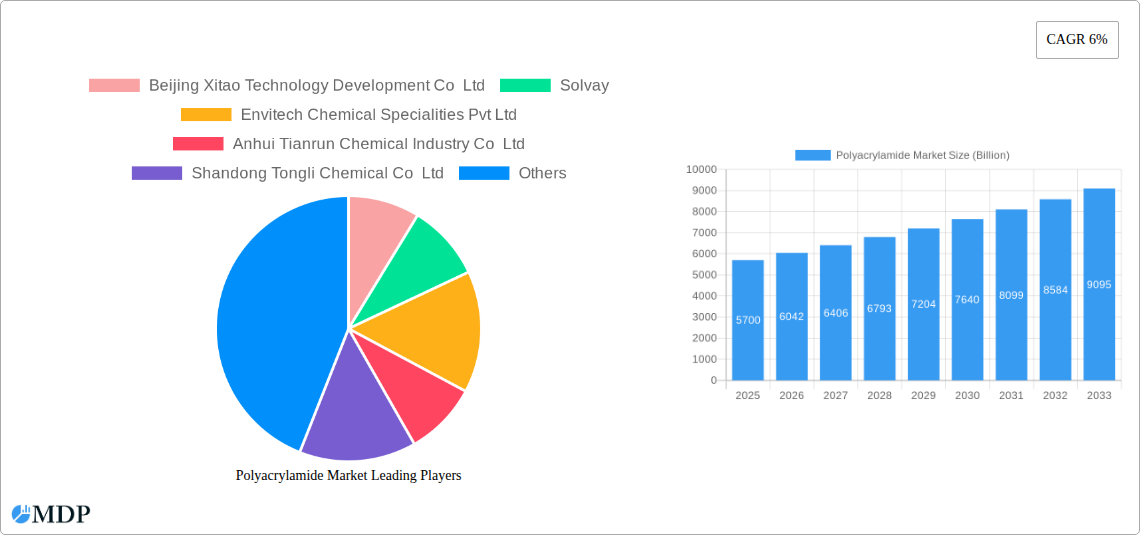
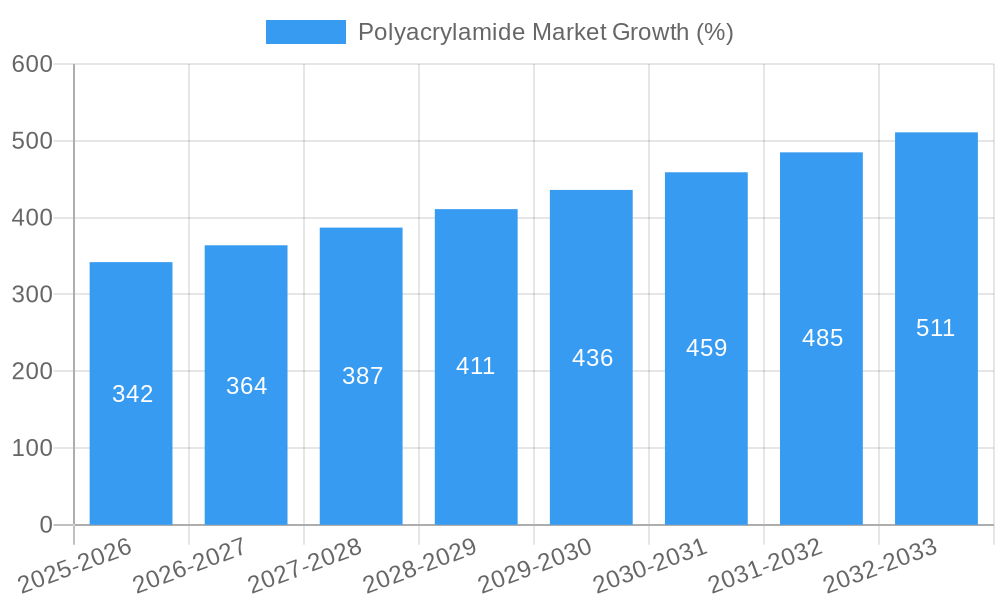
The global polyacrylamide market, valued at $5.7 billion in 2025, is projected to experience robust growth, driven by a compound annual growth rate (CAGR) of 6% from 2025 to 2033. This expansion is fueled by increasing demand across various sectors, primarily driven by its efficacy in water treatment, enhanced oil recovery, and the pulp and paper industry. The rising global population and the consequent surge in water consumption are key factors boosting the demand for water treatment chemicals like polyacrylamide, which is highly effective in clarifying and purifying water. Simultaneously, the ongoing exploration and extraction of oil and gas resources are further stimulating the market, as polyacrylamide plays a crucial role in enhancing oil recovery techniques. The increasing focus on sustainable practices within the pulp and paper industry, promoting efficient resource utilization and reduced environmental impact, also contributes to the market's growth. Different product forms such as powder, liquid, and emulsion/dispersions cater to various applications with varying viscosities and application requirements. Within the segments, cationic polyacrylamide dominates due to its broad range of applications, followed by anionic and non-ionic variants.
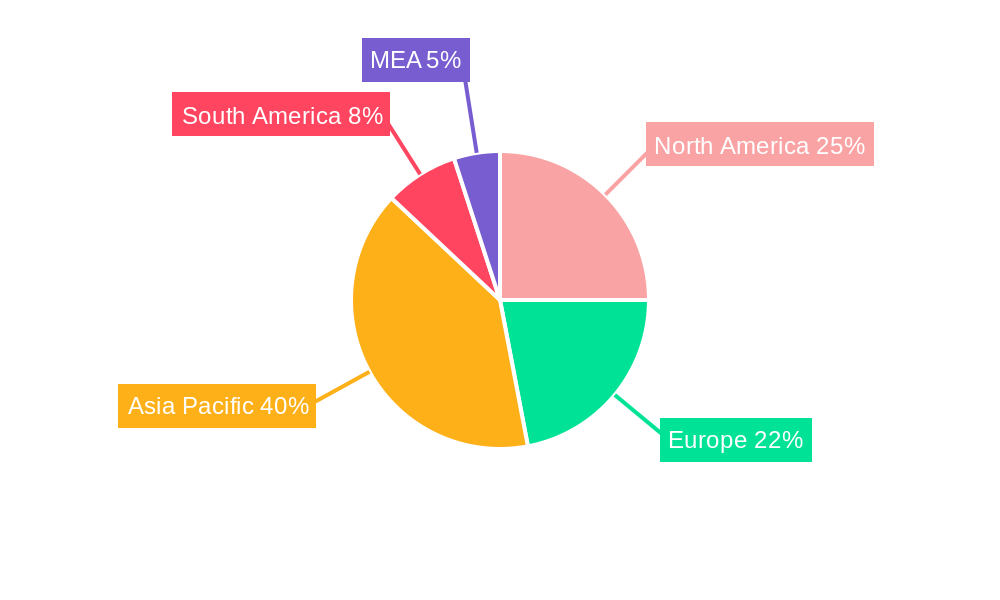
Growth is expected to be geographically diverse, with regions like Asia-Pacific (particularly China and India) exhibiting significant growth potential due to rapid industrialization and infrastructure development. North America and Europe are expected to maintain stable growth, driven by ongoing improvements in water management and oil recovery technologies. However, potential restraints include fluctuating raw material prices, stringent environmental regulations concerning chemical usage, and the emergence of alternative technologies. Key players in the market, including BASF SE, Solvay, and Kemira, are focusing on innovation, strategic partnerships, and geographical expansion to maintain their market share and capitalize on emerging opportunities. The market is anticipated to witness increasing demand for biodegradable and environmentally friendly polyacrylamide alternatives in the coming years, driven by growing environmental concerns and stricter regulatory frameworks. This will require manufacturers to adapt and innovate their product offerings to maintain a competitive edge.
Polyacrylamide Market: A Comprehensive Report (2019-2033)
This comprehensive report provides an in-depth analysis of the global polyacrylamide market, projecting a market valuation exceeding XX Billion by 2033. It covers market dynamics, industry trends, leading segments, key players, and future opportunities, offering invaluable insights for stakeholders across the value chain. The study period spans 2019-2033, with 2025 serving as the base and estimated year. This report is essential for businesses seeking to navigate the complexities of this dynamic market and capitalize on emerging growth avenues.
Polyacrylamide Market Market Dynamics & Concentration
The global polyacrylamide market is characterized by a moderately concentrated landscape, with several major players holding significant market share. Market concentration is influenced by factors such as economies of scale, technological advancements, and strategic mergers and acquisitions (M&A). Innovation, particularly in sustainable and high-performance polyacrylamide variants, is a key driver. Regulatory frameworks, varying by region, play a significant role in shaping market dynamics, influencing production standards and environmental regulations. The availability of substitute materials, such as other flocculants, presents a competitive challenge. End-user trends, particularly the growing demand for water treatment and enhanced oil recovery solutions, significantly impact market growth.
- Market Concentration: The top 5 players hold approximately xx% of the global market share (2024).
- M&A Activity: A total of xx M&A deals were recorded between 2019 and 2024 in the polyacrylamide industry, primarily focused on expanding production capacity and securing raw material supplies.
- Innovation Drivers: Focus on bio-based polyacrylamide and improved performance characteristics (e.g., higher flocculation efficiency, reduced dosage requirements).
- Regulatory Landscape: Stringent environmental regulations in developed markets drive demand for eco-friendly polyacrylamide solutions.
Polyacrylamide Market Industry Trends & Analysis
The polyacrylamide market is experiencing robust growth, driven by several factors. The CAGR for the forecast period (2025-2033) is estimated at xx%. Market penetration in emerging economies remains significant, with considerable potential for expansion. Technological disruptions, such as the development of novel polymerization techniques and the integration of smart sensors in water treatment plants, are revolutionizing the industry. Consumer preferences are increasingly shifting towards sustainable and eco-friendly solutions. Intense competition among established players and new entrants is driving innovation and price optimization.
Leading Markets & Segments in Polyacrylamide Market
The water treatment segment dominates the polyacrylamide market, driven by the increasing demand for clean water in both developed and developing countries. Geographically, Asia-Pacific is the leading region due to rapid industrialization and expanding infrastructure projects. Within product types, Anionic polyacrylamide holds the largest market share, owing to its widespread use in water treatment applications.
- Dominant Region: Asia-Pacific
- Dominant Segment (By Application): Water Treatment
- Dominant Segment (By Product): Anionic Polyacrylamide
- Key Drivers (Asia-Pacific): Rapid urbanization, industrial expansion, and increasing government investments in water infrastructure.
- Key Drivers (Water Treatment): Growing concerns over water scarcity and stringent environmental regulations.
The powder form of polyacrylamide dominates the market due to ease of handling and transportation. Enhanced Oil Recovery (EOR) is a fast-growing application segment, propelled by the rising global demand for oil and gas.
Polyacrylamide Market Product Developments
Recent advancements focus on developing bio-based polyacrylamide using renewable feedstocks to meet the growing demand for sustainable solutions. Innovations are focused on enhancing flocculation efficiency, improving solubility, and reducing environmental impact. The development of customized polyacrylamide formulations for specific applications further contributes to market growth, catering to the unique needs of different industries.
Key Drivers of Polyacrylamide Market Growth
Several factors fuel the market's growth. Technological advancements in polymerization techniques are leading to superior product quality and cost efficiency. The global rise in urbanization and industrialization boosts the demand for effective water treatment solutions. Stringent environmental regulations mandate the adoption of eco-friendly polyacrylamide solutions. The increasing need for efficient oil recovery further contributes to the market's expansion.
Challenges in the Polyacrylamide Market Market
The polyacrylamide market faces several challenges. Fluctuations in raw material prices can impact profitability. Stringent environmental regulations necessitate continuous investment in research and development for sustainable solutions. Intense competition among established players and new entrants pressures profit margins. Supply chain disruptions and logistical complexities can affect timely product delivery.
Emerging Opportunities in Polyacrylamide Market
The market presents exciting long-term opportunities. Technological breakthroughs in bio-based polyacrylamide are set to revolutionize the industry. Strategic partnerships and collaborations are paving the way for innovative product development and market expansion. Increased investments in research and development will continue to improve polyacrylamide's performance and sustainability characteristics.
Leading Players in the Polyacrylamide Market Sector
- Solvay
- Ashland
- BASF SE
- Kemira
- Solenis
- Beijing Xitao Technology Development Co Ltd
- Envitech Chemical Specialities Pvt Ltd
- Anhui Tianrun Chemical Industry Co Ltd
- Shandong Tongli Chemical Co Ltd
- Yixing Cleanwater Chemicals Co Ltd
- Liaocheng Yongxing Environmental Protection Science&Technology Co Ltd
- Qingdao Oubo Chemical Co Ltd
- AnHui JuCheng Fine Chemicals Co Ltd
- Beijing Hengju Chemical Group Corporation
- CHINAFLOC
- SNF Group
Key Milestones in Polyacrylamide Market Industry
- January 2022: Solenis acquired SCL GmbH, enhancing its cationic polyacrylamide production capabilities.
- February 2022: Kemira launched full-scale production of its bio-based polyacrylamide, strengthening its commitment to sustainable solutions.
Strategic Outlook for Polyacrylamide Market Market
The polyacrylamide market exhibits significant growth potential, driven by technological innovations, expanding applications, and the growing awareness of environmental sustainability. Strategic investments in research and development, coupled with strategic partnerships and mergers and acquisitions, will be crucial for companies to maintain a competitive edge and capitalize on emerging market opportunities. The focus on sustainable solutions and enhanced performance characteristics will continue to shape the industry's future.
Polyacrylamide Market Segmentation
-
1. Physical Form
- 1.1. Powder
- 1.2. Liquid
- 1.3. Emulsion/Dispersions
-
2. Application
- 2.1. Enhanced Oil Recovery
- 2.2. Flocculants for Water Treatment
- 2.3. Soil Conditioner
- 2.4. Binders and Stabilizers in Cosmetics
- 2.5. Other Applications
-
3. End-user Industry
- 3.1. Water Treatment
- 3.2. Oil and Gas
- 3.3. Pulp and Paper
- 3.4. Mining
- 3.5. Other End-user Industries
Polyacrylamide Market Segmentation By Geography
-
1. Asia Pacific
- 1.1. China
- 1.2. India
- 1.3. Japan
- 1.4. South Korea
- 1.5. Rest of Asia Pacific
-
2. North America
- 2.1. United States
- 2.2. Canada
- 2.3. Mexico
-
3. Europe
- 3.1. Germany
- 3.2. United Kingdom
- 3.3. France
- 3.4. Russia
- 3.5. Netherlands
- 3.6. Rest of Europe
-
4. South America
- 4.1. Brazil
- 4.2. Argentina
- 4.3. Rest of South America
-
5. Middle East and Africa
- 5.1. Saudi Arabia
- 5.2. South Africa
- 5.3. Rest of Middle East and Africa
Polyacrylamide Market REPORT HIGHLIGHTS
| Aspects | Details |
|---|---|
| Study Period | 2019-2033 |
| Base Year | 2024 |
| Estimated Year | 2025 |
| Forecast Period | 2025-2033 |
| Historical Period | 2019-2024 |
| Growth Rate | CAGR of 6% from 2019-2033 |
| Segmentation |
|
Table of Contents
- 1. Introduction
- 1.1. Research Scope
- 1.2. Market Segmentation
- 1.3. Research Methodology
- 1.4. Definitions and Assumptions
- 2. Executive Summary
- 2.1. Introduction
- 3. Market Dynamics
- 3.1. Introduction
- 3.2. Market Drivers
- 3.2.1. Growing Utilization in the Oil and Gas Industry for Enhanced Oil Recovery; Increasing Demand for Polyacrylamide as a Flocculant in Water Treatment Industry
- 3.3. Market Restrains
- 3.3.1. Health Concerns Caused by Exposure to Acrylamide Monomer
- 3.4. Market Trends
- 3.4.1. Water Treatment Industry to Dominate the Market
- 4. Market Factor Analysis
- 4.1. Porters Five Forces
- 4.2. Supply/Value Chain
- 4.3. PESTEL analysis
- 4.4. Market Entropy
- 4.5. Patent/Trademark Analysis
- 5. Global Polyacrylamide Market Analysis, Insights and Forecast, 2019-2031
- 5.1. Market Analysis, Insights and Forecast - by Physical Form
- 5.1.1. Powder
- 5.1.2. Liquid
- 5.1.3. Emulsion/Dispersions
- 5.2. Market Analysis, Insights and Forecast - by Application
- 5.2.1. Enhanced Oil Recovery
- 5.2.2. Flocculants for Water Treatment
- 5.2.3. Soil Conditioner
- 5.2.4. Binders and Stabilizers in Cosmetics
- 5.2.5. Other Applications
- 5.3. Market Analysis, Insights and Forecast - by End-user Industry
- 5.3.1. Water Treatment
- 5.3.2. Oil and Gas
- 5.3.3. Pulp and Paper
- 5.3.4. Mining
- 5.3.5. Other End-user Industries
- 5.4. Market Analysis, Insights and Forecast - by Region
- 5.4.1. Asia Pacific
- 5.4.2. North America
- 5.4.3. Europe
- 5.4.4. South America
- 5.4.5. Middle East and Africa
- 5.1. Market Analysis, Insights and Forecast - by Physical Form
- 6. Asia Pacific Polyacrylamide Market Analysis, Insights and Forecast, 2019-2031
- 6.1. Market Analysis, Insights and Forecast - by Physical Form
- 6.1.1. Powder
- 6.1.2. Liquid
- 6.1.3. Emulsion/Dispersions
- 6.2. Market Analysis, Insights and Forecast - by Application
- 6.2.1. Enhanced Oil Recovery
- 6.2.2. Flocculants for Water Treatment
- 6.2.3. Soil Conditioner
- 6.2.4. Binders and Stabilizers in Cosmetics
- 6.2.5. Other Applications
- 6.3. Market Analysis, Insights and Forecast - by End-user Industry
- 6.3.1. Water Treatment
- 6.3.2. Oil and Gas
- 6.3.3. Pulp and Paper
- 6.3.4. Mining
- 6.3.5. Other End-user Industries
- 6.1. Market Analysis, Insights and Forecast - by Physical Form
- 7. North America Polyacrylamide Market Analysis, Insights and Forecast, 2019-2031
- 7.1. Market Analysis, Insights and Forecast - by Physical Form
- 7.1.1. Powder
- 7.1.2. Liquid
- 7.1.3. Emulsion/Dispersions
- 7.2. Market Analysis, Insights and Forecast - by Application
- 7.2.1. Enhanced Oil Recovery
- 7.2.2. Flocculants for Water Treatment
- 7.2.3. Soil Conditioner
- 7.2.4. Binders and Stabilizers in Cosmetics
- 7.2.5. Other Applications
- 7.3. Market Analysis, Insights and Forecast - by End-user Industry
- 7.3.1. Water Treatment
- 7.3.2. Oil and Gas
- 7.3.3. Pulp and Paper
- 7.3.4. Mining
- 7.3.5. Other End-user Industries
- 7.1. Market Analysis, Insights and Forecast - by Physical Form
- 8. Europe Polyacrylamide Market Analysis, Insights and Forecast, 2019-2031
- 8.1. Market Analysis, Insights and Forecast - by Physical Form
- 8.1.1. Powder
- 8.1.2. Liquid
- 8.1.3. Emulsion/Dispersions
- 8.2. Market Analysis, Insights and Forecast - by Application
- 8.2.1. Enhanced Oil Recovery
- 8.2.2. Flocculants for Water Treatment
- 8.2.3. Soil Conditioner
- 8.2.4. Binders and Stabilizers in Cosmetics
- 8.2.5. Other Applications
- 8.3. Market Analysis, Insights and Forecast - by End-user Industry
- 8.3.1. Water Treatment
- 8.3.2. Oil and Gas
- 8.3.3. Pulp and Paper
- 8.3.4. Mining
- 8.3.5. Other End-user Industries
- 8.1. Market Analysis, Insights and Forecast - by Physical Form
- 9. South America Polyacrylamide Market Analysis, Insights and Forecast, 2019-2031
- 9.1. Market Analysis, Insights and Forecast - by Physical Form
- 9.1.1. Powder
- 9.1.2. Liquid
- 9.1.3. Emulsion/Dispersions
- 9.2. Market Analysis, Insights and Forecast - by Application
- 9.2.1. Enhanced Oil Recovery
- 9.2.2. Flocculants for Water Treatment
- 9.2.3. Soil Conditioner
- 9.2.4. Binders and Stabilizers in Cosmetics
- 9.2.5. Other Applications
- 9.3. Market Analysis, Insights and Forecast - by End-user Industry
- 9.3.1. Water Treatment
- 9.3.2. Oil and Gas
- 9.3.3. Pulp and Paper
- 9.3.4. Mining
- 9.3.5. Other End-user Industries
- 9.1. Market Analysis, Insights and Forecast - by Physical Form
- 10. Middle East and Africa Polyacrylamide Market Analysis, Insights and Forecast, 2019-2031
- 10.1. Market Analysis, Insights and Forecast - by Physical Form
- 10.1.1. Powder
- 10.1.2. Liquid
- 10.1.3. Emulsion/Dispersions
- 10.2. Market Analysis, Insights and Forecast - by Application
- 10.2.1. Enhanced Oil Recovery
- 10.2.2. Flocculants for Water Treatment
- 10.2.3. Soil Conditioner
- 10.2.4. Binders and Stabilizers in Cosmetics
- 10.2.5. Other Applications
- 10.3. Market Analysis, Insights and Forecast - by End-user Industry
- 10.3.1. Water Treatment
- 10.3.2. Oil and Gas
- 10.3.3. Pulp and Paper
- 10.3.4. Mining
- 10.3.5. Other End-user Industries
- 10.1. Market Analysis, Insights and Forecast - by Physical Form
- 11. North America Polyacrylamide Market Analysis, Insights and Forecast, 2019-2031
- 11.1. Market Analysis, Insights and Forecast - By Country/Sub-region
- 11.1.1 United States
- 11.1.2 Canada
- 11.1.3 Mexico
- 12. Europe Polyacrylamide Market Analysis, Insights and Forecast, 2019-2031
- 12.1. Market Analysis, Insights and Forecast - By Country/Sub-region
- 12.1.1 Germany
- 12.1.2 France
- 12.1.3 Italy
- 12.1.4 United Kingdom
- 12.1.5 Netherlands
- 12.1.6 Rest of Europe
- 13. Asia Pacific Polyacrylamide Market Analysis, Insights and Forecast, 2019-2031
- 13.1. Market Analysis, Insights and Forecast - By Country/Sub-region
- 13.1.1 China
- 13.1.2 Japan
- 13.1.3 India
- 13.1.4 South Korea
- 13.1.5 Taiwan
- 13.1.6 Australia
- 13.1.7 Rest of Asia-Pacific
- 14. South America Polyacrylamide Market Analysis, Insights and Forecast, 2019-2031
- 14.1. Market Analysis, Insights and Forecast - By Country/Sub-region
- 14.1.1 Brazil
- 14.1.2 Argentina
- 14.1.3 Rest of South America
- 15. MEA Polyacrylamide Market Analysis, Insights and Forecast, 2019-2031
- 15.1. Market Analysis, Insights and Forecast - By Country/Sub-region
- 15.1.1 Middle East
- 15.1.2 Africa
- 16. Competitive Analysis
- 16.1. Global Market Share Analysis 2024
- 16.2. Company Profiles
- 16.2.1 Beijing Xitao Technology Development Co Ltd
- 16.2.1.1. Overview
- 16.2.1.2. Products
- 16.2.1.3. SWOT Analysis
- 16.2.1.4. Recent Developments
- 16.2.1.5. Financials (Based on Availability)
- 16.2.2 Solvay
- 16.2.2.1. Overview
- 16.2.2.2. Products
- 16.2.2.3. SWOT Analysis
- 16.2.2.4. Recent Developments
- 16.2.2.5. Financials (Based on Availability)
- 16.2.3 Envitech Chemical Specialities Pvt Ltd
- 16.2.3.1. Overview
- 16.2.3.2. Products
- 16.2.3.3. SWOT Analysis
- 16.2.3.4. Recent Developments
- 16.2.3.5. Financials (Based on Availability)
- 16.2.4 Anhui Tianrun Chemical Industry Co Ltd
- 16.2.4.1. Overview
- 16.2.4.2. Products
- 16.2.4.3. SWOT Analysis
- 16.2.4.4. Recent Developments
- 16.2.4.5. Financials (Based on Availability)
- 16.2.5 Shandong Tongli Chemical Co Ltd
- 16.2.5.1. Overview
- 16.2.5.2. Products
- 16.2.5.3. SWOT Analysis
- 16.2.5.4. Recent Developments
- 16.2.5.5. Financials (Based on Availability)
- 16.2.6 Yixing Cleanwater Chemicals Co Ltd
- 16.2.6.1. Overview
- 16.2.6.2. Products
- 16.2.6.3. SWOT Analysis
- 16.2.6.4. Recent Developments
- 16.2.6.5. Financials (Based on Availability)
- 16.2.7 Ashland
- 16.2.7.1. Overview
- 16.2.7.2. Products
- 16.2.7.3. SWOT Analysis
- 16.2.7.4. Recent Developments
- 16.2.7.5. Financials (Based on Availability)
- 16.2.8 Liaocheng Yongxing Environmental Protection Science&Technology Co Ltd
- 16.2.8.1. Overview
- 16.2.8.2. Products
- 16.2.8.3. SWOT Analysis
- 16.2.8.4. Recent Developments
- 16.2.8.5. Financials (Based on Availability)
- 16.2.9 BASF SE
- 16.2.9.1. Overview
- 16.2.9.2. Products
- 16.2.9.3. SWOT Analysis
- 16.2.9.4. Recent Developments
- 16.2.9.5. Financials (Based on Availability)
- 16.2.10 Qingdao Oubo Chemical Co Ltd
- 16.2.10.1. Overview
- 16.2.10.2. Products
- 16.2.10.3. SWOT Analysis
- 16.2.10.4. Recent Developments
- 16.2.10.5. Financials (Based on Availability)
- 16.2.11 AnHui JuCheng Fine Chemicals Co Ltd
- 16.2.11.1. Overview
- 16.2.11.2. Products
- 16.2.11.3. SWOT Analysis
- 16.2.11.4. Recent Developments
- 16.2.11.5. Financials (Based on Availability)
- 16.2.12 Kemira
- 16.2.12.1. Overview
- 16.2.12.2. Products
- 16.2.12.3. SWOT Analysis
- 16.2.12.4. Recent Developments
- 16.2.12.5. Financials (Based on Availability)
- 16.2.13 Solenis
- 16.2.13.1. Overview
- 16.2.13.2. Products
- 16.2.13.3. SWOT Analysis
- 16.2.13.4. Recent Developments
- 16.2.13.5. Financials (Based on Availability)
- 16.2.14 Beijing Hengju Chemical Group Corporation
- 16.2.14.1. Overview
- 16.2.14.2. Products
- 16.2.14.3. SWOT Analysis
- 16.2.14.4. Recent Developments
- 16.2.14.5. Financials (Based on Availability)
- 16.2.15 CHINAFLOC
- 16.2.15.1. Overview
- 16.2.15.2. Products
- 16.2.15.3. SWOT Analysis
- 16.2.15.4. Recent Developments
- 16.2.15.5. Financials (Based on Availability)
- 16.2.16 SNF Group
- 16.2.16.1. Overview
- 16.2.16.2. Products
- 16.2.16.3. SWOT Analysis
- 16.2.16.4. Recent Developments
- 16.2.16.5. Financials (Based on Availability)
- 16.2.1 Beijing Xitao Technology Development Co Ltd
List of Figures
- Figure 1: Global Polyacrylamide Market Revenue Breakdown (Billion, %) by Region 2024 & 2032
- Figure 2: Global Polyacrylamide Market Volume Breakdown (K Tons, %) by Region 2024 & 2032
- Figure 3: North America Polyacrylamide Market Revenue (Billion), by Country 2024 & 2032
- Figure 4: North America Polyacrylamide Market Volume (K Tons), by Country 2024 & 2032
- Figure 5: North America Polyacrylamide Market Revenue Share (%), by Country 2024 & 2032
- Figure 6: North America Polyacrylamide Market Volume Share (%), by Country 2024 & 2032
- Figure 7: Europe Polyacrylamide Market Revenue (Billion), by Country 2024 & 2032
- Figure 8: Europe Polyacrylamide Market Volume (K Tons), by Country 2024 & 2032
- Figure 9: Europe Polyacrylamide Market Revenue Share (%), by Country 2024 & 2032
- Figure 10: Europe Polyacrylamide Market Volume Share (%), by Country 2024 & 2032
- Figure 11: Asia Pacific Polyacrylamide Market Revenue (Billion), by Country 2024 & 2032
- Figure 12: Asia Pacific Polyacrylamide Market Volume (K Tons), by Country 2024 & 2032
- Figure 13: Asia Pacific Polyacrylamide Market Revenue Share (%), by Country 2024 & 2032
- Figure 14: Asia Pacific Polyacrylamide Market Volume Share (%), by Country 2024 & 2032
- Figure 15: South America Polyacrylamide Market Revenue (Billion), by Country 2024 & 2032
- Figure 16: South America Polyacrylamide Market Volume (K Tons), by Country 2024 & 2032
- Figure 17: South America Polyacrylamide Market Revenue Share (%), by Country 2024 & 2032
- Figure 18: South America Polyacrylamide Market Volume Share (%), by Country 2024 & 2032
- Figure 19: MEA Polyacrylamide Market Revenue (Billion), by Country 2024 & 2032
- Figure 20: MEA Polyacrylamide Market Volume (K Tons), by Country 2024 & 2032
- Figure 21: MEA Polyacrylamide Market Revenue Share (%), by Country 2024 & 2032
- Figure 22: MEA Polyacrylamide Market Volume Share (%), by Country 2024 & 2032
- Figure 23: Asia Pacific Polyacrylamide Market Revenue (Billion), by Physical Form 2024 & 2032
- Figure 24: Asia Pacific Polyacrylamide Market Volume (K Tons), by Physical Form 2024 & 2032
- Figure 25: Asia Pacific Polyacrylamide Market Revenue Share (%), by Physical Form 2024 & 2032
- Figure 26: Asia Pacific Polyacrylamide Market Volume Share (%), by Physical Form 2024 & 2032
- Figure 27: Asia Pacific Polyacrylamide Market Revenue (Billion), by Application 2024 & 2032
- Figure 28: Asia Pacific Polyacrylamide Market Volume (K Tons), by Application 2024 & 2032
- Figure 29: Asia Pacific Polyacrylamide Market Revenue Share (%), by Application 2024 & 2032
- Figure 30: Asia Pacific Polyacrylamide Market Volume Share (%), by Application 2024 & 2032
- Figure 31: Asia Pacific Polyacrylamide Market Revenue (Billion), by End-user Industry 2024 & 2032
- Figure 32: Asia Pacific Polyacrylamide Market Volume (K Tons), by End-user Industry 2024 & 2032
- Figure 33: Asia Pacific Polyacrylamide Market Revenue Share (%), by End-user Industry 2024 & 2032
- Figure 34: Asia Pacific Polyacrylamide Market Volume Share (%), by End-user Industry 2024 & 2032
- Figure 35: Asia Pacific Polyacrylamide Market Revenue (Billion), by Country 2024 & 2032
- Figure 36: Asia Pacific Polyacrylamide Market Volume (K Tons), by Country 2024 & 2032
- Figure 37: Asia Pacific Polyacrylamide Market Revenue Share (%), by Country 2024 & 2032
- Figure 38: Asia Pacific Polyacrylamide Market Volume Share (%), by Country 2024 & 2032
- Figure 39: North America Polyacrylamide Market Revenue (Billion), by Physical Form 2024 & 2032
- Figure 40: North America Polyacrylamide Market Volume (K Tons), by Physical Form 2024 & 2032
- Figure 41: North America Polyacrylamide Market Revenue Share (%), by Physical Form 2024 & 2032
- Figure 42: North America Polyacrylamide Market Volume Share (%), by Physical Form 2024 & 2032
- Figure 43: North America Polyacrylamide Market Revenue (Billion), by Application 2024 & 2032
- Figure 44: North America Polyacrylamide Market Volume (K Tons), by Application 2024 & 2032
- Figure 45: North America Polyacrylamide Market Revenue Share (%), by Application 2024 & 2032
- Figure 46: North America Polyacrylamide Market Volume Share (%), by Application 2024 & 2032
- Figure 47: North America Polyacrylamide Market Revenue (Billion), by End-user Industry 2024 & 2032
- Figure 48: North America Polyacrylamide Market Volume (K Tons), by End-user Industry 2024 & 2032
- Figure 49: North America Polyacrylamide Market Revenue Share (%), by End-user Industry 2024 & 2032
- Figure 50: North America Polyacrylamide Market Volume Share (%), by End-user Industry 2024 & 2032
- Figure 51: North America Polyacrylamide Market Revenue (Billion), by Country 2024 & 2032
- Figure 52: North America Polyacrylamide Market Volume (K Tons), by Country 2024 & 2032
- Figure 53: North America Polyacrylamide Market Revenue Share (%), by Country 2024 & 2032
- Figure 54: North America Polyacrylamide Market Volume Share (%), by Country 2024 & 2032
- Figure 55: Europe Polyacrylamide Market Revenue (Billion), by Physical Form 2024 & 2032
- Figure 56: Europe Polyacrylamide Market Volume (K Tons), by Physical Form 2024 & 2032
- Figure 57: Europe Polyacrylamide Market Revenue Share (%), by Physical Form 2024 & 2032
- Figure 58: Europe Polyacrylamide Market Volume Share (%), by Physical Form 2024 & 2032
- Figure 59: Europe Polyacrylamide Market Revenue (Billion), by Application 2024 & 2032
- Figure 60: Europe Polyacrylamide Market Volume (K Tons), by Application 2024 & 2032
- Figure 61: Europe Polyacrylamide Market Revenue Share (%), by Application 2024 & 2032
- Figure 62: Europe Polyacrylamide Market Volume Share (%), by Application 2024 & 2032
- Figure 63: Europe Polyacrylamide Market Revenue (Billion), by End-user Industry 2024 & 2032
- Figure 64: Europe Polyacrylamide Market Volume (K Tons), by End-user Industry 2024 & 2032
- Figure 65: Europe Polyacrylamide Market Revenue Share (%), by End-user Industry 2024 & 2032
- Figure 66: Europe Polyacrylamide Market Volume Share (%), by End-user Industry 2024 & 2032
- Figure 67: Europe Polyacrylamide Market Revenue (Billion), by Country 2024 & 2032
- Figure 68: Europe Polyacrylamide Market Volume (K Tons), by Country 2024 & 2032
- Figure 69: Europe Polyacrylamide Market Revenue Share (%), by Country 2024 & 2032
- Figure 70: Europe Polyacrylamide Market Volume Share (%), by Country 2024 & 2032
- Figure 71: South America Polyacrylamide Market Revenue (Billion), by Physical Form 2024 & 2032
- Figure 72: South America Polyacrylamide Market Volume (K Tons), by Physical Form 2024 & 2032
- Figure 73: South America Polyacrylamide Market Revenue Share (%), by Physical Form 2024 & 2032
- Figure 74: South America Polyacrylamide Market Volume Share (%), by Physical Form 2024 & 2032
- Figure 75: South America Polyacrylamide Market Revenue (Billion), by Application 2024 & 2032
- Figure 76: South America Polyacrylamide Market Volume (K Tons), by Application 2024 & 2032
- Figure 77: South America Polyacrylamide Market Revenue Share (%), by Application 2024 & 2032
- Figure 78: South America Polyacrylamide Market Volume Share (%), by Application 2024 & 2032
- Figure 79: South America Polyacrylamide Market Revenue (Billion), by End-user Industry 2024 & 2032
- Figure 80: South America Polyacrylamide Market Volume (K Tons), by End-user Industry 2024 & 2032
- Figure 81: South America Polyacrylamide Market Revenue Share (%), by End-user Industry 2024 & 2032
- Figure 82: South America Polyacrylamide Market Volume Share (%), by End-user Industry 2024 & 2032
- Figure 83: South America Polyacrylamide Market Revenue (Billion), by Country 2024 & 2032
- Figure 84: South America Polyacrylamide Market Volume (K Tons), by Country 2024 & 2032
- Figure 85: South America Polyacrylamide Market Revenue Share (%), by Country 2024 & 2032
- Figure 86: South America Polyacrylamide Market Volume Share (%), by Country 2024 & 2032
- Figure 87: Middle East and Africa Polyacrylamide Market Revenue (Billion), by Physical Form 2024 & 2032
- Figure 88: Middle East and Africa Polyacrylamide Market Volume (K Tons), by Physical Form 2024 & 2032
- Figure 89: Middle East and Africa Polyacrylamide Market Revenue Share (%), by Physical Form 2024 & 2032
- Figure 90: Middle East and Africa Polyacrylamide Market Volume Share (%), by Physical Form 2024 & 2032
- Figure 91: Middle East and Africa Polyacrylamide Market Revenue (Billion), by Application 2024 & 2032
- Figure 92: Middle East and Africa Polyacrylamide Market Volume (K Tons), by Application 2024 & 2032
- Figure 93: Middle East and Africa Polyacrylamide Market Revenue Share (%), by Application 2024 & 2032
- Figure 94: Middle East and Africa Polyacrylamide Market Volume Share (%), by Application 2024 & 2032
- Figure 95: Middle East and Africa Polyacrylamide Market Revenue (Billion), by End-user Industry 2024 & 2032
- Figure 96: Middle East and Africa Polyacrylamide Market Volume (K Tons), by End-user Industry 2024 & 2032
- Figure 97: Middle East and Africa Polyacrylamide Market Revenue Share (%), by End-user Industry 2024 & 2032
- Figure 98: Middle East and Africa Polyacrylamide Market Volume Share (%), by End-user Industry 2024 & 2032
- Figure 99: Middle East and Africa Polyacrylamide Market Revenue (Billion), by Country 2024 & 2032
- Figure 100: Middle East and Africa Polyacrylamide Market Volume (K Tons), by Country 2024 & 2032
- Figure 101: Middle East and Africa Polyacrylamide Market Revenue Share (%), by Country 2024 & 2032
- Figure 102: Middle East and Africa Polyacrylamide Market Volume Share (%), by Country 2024 & 2032
List of Tables
- Table 1: Global Polyacrylamide Market Revenue Billion Forecast, by Region 2019 & 2032
- Table 2: Global Polyacrylamide Market Volume K Tons Forecast, by Region 2019 & 2032
- Table 3: Global Polyacrylamide Market Revenue Billion Forecast, by Physical Form 2019 & 2032
- Table 4: Global Polyacrylamide Market Volume K Tons Forecast, by Physical Form 2019 & 2032
- Table 5: Global Polyacrylamide Market Revenue Billion Forecast, by Application 2019 & 2032
- Table 6: Global Polyacrylamide Market Volume K Tons Forecast, by Application 2019 & 2032
- Table 7: Global Polyacrylamide Market Revenue Billion Forecast, by End-user Industry 2019 & 2032
- Table 8: Global Polyacrylamide Market Volume K Tons Forecast, by End-user Industry 2019 & 2032
- Table 9: Global Polyacrylamide Market Revenue Billion Forecast, by Region 2019 & 2032
- Table 10: Global Polyacrylamide Market Volume K Tons Forecast, by Region 2019 & 2032
- Table 11: Global Polyacrylamide Market Revenue Billion Forecast, by Country 2019 & 2032
- Table 12: Global Polyacrylamide Market Volume K Tons Forecast, by Country 2019 & 2032
- Table 13: United States Polyacrylamide Market Revenue (Billion) Forecast, by Application 2019 & 2032
- Table 14: United States Polyacrylamide Market Volume (K Tons) Forecast, by Application 2019 & 2032
- Table 15: Canada Polyacrylamide Market Revenue (Billion) Forecast, by Application 2019 & 2032
- Table 16: Canada Polyacrylamide Market Volume (K Tons) Forecast, by Application 2019 & 2032
- Table 17: Mexico Polyacrylamide Market Revenue (Billion) Forecast, by Application 2019 & 2032
- Table 18: Mexico Polyacrylamide Market Volume (K Tons) Forecast, by Application 2019 & 2032
- Table 19: Global Polyacrylamide Market Revenue Billion Forecast, by Country 2019 & 2032
- Table 20: Global Polyacrylamide Market Volume K Tons Forecast, by Country 2019 & 2032
- Table 21: Germany Polyacrylamide Market Revenue (Billion) Forecast, by Application 2019 & 2032
- Table 22: Germany Polyacrylamide Market Volume (K Tons) Forecast, by Application 2019 & 2032
- Table 23: France Polyacrylamide Market Revenue (Billion) Forecast, by Application 2019 & 2032
- Table 24: France Polyacrylamide Market Volume (K Tons) Forecast, by Application 2019 & 2032
- Table 25: Italy Polyacrylamide Market Revenue (Billion) Forecast, by Application 2019 & 2032
- Table 26: Italy Polyacrylamide Market Volume (K Tons) Forecast, by Application 2019 & 2032
- Table 27: United Kingdom Polyacrylamide Market Revenue (Billion) Forecast, by Application 2019 & 2032
- Table 28: United Kingdom Polyacrylamide Market Volume (K Tons) Forecast, by Application 2019 & 2032
- Table 29: Netherlands Polyacrylamide Market Revenue (Billion) Forecast, by Application 2019 & 2032
- Table 30: Netherlands Polyacrylamide Market Volume (K Tons) Forecast, by Application 2019 & 2032
- Table 31: Rest of Europe Polyacrylamide Market Revenue (Billion) Forecast, by Application 2019 & 2032
- Table 32: Rest of Europe Polyacrylamide Market Volume (K Tons) Forecast, by Application 2019 & 2032
- Table 33: Global Polyacrylamide Market Revenue Billion Forecast, by Country 2019 & 2032
- Table 34: Global Polyacrylamide Market Volume K Tons Forecast, by Country 2019 & 2032
- Table 35: China Polyacrylamide Market Revenue (Billion) Forecast, by Application 2019 & 2032
- Table 36: China Polyacrylamide Market Volume (K Tons) Forecast, by Application 2019 & 2032
- Table 37: Japan Polyacrylamide Market Revenue (Billion) Forecast, by Application 2019 & 2032
- Table 38: Japan Polyacrylamide Market Volume (K Tons) Forecast, by Application 2019 & 2032
- Table 39: India Polyacrylamide Market Revenue (Billion) Forecast, by Application 2019 & 2032
- Table 40: India Polyacrylamide Market Volume (K Tons) Forecast, by Application 2019 & 2032
- Table 41: South Korea Polyacrylamide Market Revenue (Billion) Forecast, by Application 2019 & 2032
- Table 42: South Korea Polyacrylamide Market Volume (K Tons) Forecast, by Application 2019 & 2032
- Table 43: Taiwan Polyacrylamide Market Revenue (Billion) Forecast, by Application 2019 & 2032
- Table 44: Taiwan Polyacrylamide Market Volume (K Tons) Forecast, by Application 2019 & 2032
- Table 45: Australia Polyacrylamide Market Revenue (Billion) Forecast, by Application 2019 & 2032
- Table 46: Australia Polyacrylamide Market Volume (K Tons) Forecast, by Application 2019 & 2032
- Table 47: Rest of Asia-Pacific Polyacrylamide Market Revenue (Billion) Forecast, by Application 2019 & 2032
- Table 48: Rest of Asia-Pacific Polyacrylamide Market Volume (K Tons) Forecast, by Application 2019 & 2032
- Table 49: Global Polyacrylamide Market Revenue Billion Forecast, by Country 2019 & 2032
- Table 50: Global Polyacrylamide Market Volume K Tons Forecast, by Country 2019 & 2032
- Table 51: Brazil Polyacrylamide Market Revenue (Billion) Forecast, by Application 2019 & 2032
- Table 52: Brazil Polyacrylamide Market Volume (K Tons) Forecast, by Application 2019 & 2032
- Table 53: Argentina Polyacrylamide Market Revenue (Billion) Forecast, by Application 2019 & 2032
- Table 54: Argentina Polyacrylamide Market Volume (K Tons) Forecast, by Application 2019 & 2032
- Table 55: Rest of South America Polyacrylamide Market Revenue (Billion) Forecast, by Application 2019 & 2032
- Table 56: Rest of South America Polyacrylamide Market Volume (K Tons) Forecast, by Application 2019 & 2032
- Table 57: Global Polyacrylamide Market Revenue Billion Forecast, by Country 2019 & 2032
- Table 58: Global Polyacrylamide Market Volume K Tons Forecast, by Country 2019 & 2032
- Table 59: Middle East Polyacrylamide Market Revenue (Billion) Forecast, by Application 2019 & 2032
- Table 60: Middle East Polyacrylamide Market Volume (K Tons) Forecast, by Application 2019 & 2032
- Table 61: Africa Polyacrylamide Market Revenue (Billion) Forecast, by Application 2019 & 2032
- Table 62: Africa Polyacrylamide Market Volume (K Tons) Forecast, by Application 2019 & 2032
- Table 63: Global Polyacrylamide Market Revenue Billion Forecast, by Physical Form 2019 & 2032
- Table 64: Global Polyacrylamide Market Volume K Tons Forecast, by Physical Form 2019 & 2032
- Table 65: Global Polyacrylamide Market Revenue Billion Forecast, by Application 2019 & 2032
- Table 66: Global Polyacrylamide Market Volume K Tons Forecast, by Application 2019 & 2032
- Table 67: Global Polyacrylamide Market Revenue Billion Forecast, by End-user Industry 2019 & 2032
- Table 68: Global Polyacrylamide Market Volume K Tons Forecast, by End-user Industry 2019 & 2032
- Table 69: Global Polyacrylamide Market Revenue Billion Forecast, by Country 2019 & 2032
- Table 70: Global Polyacrylamide Market Volume K Tons Forecast, by Country 2019 & 2032
- Table 71: China Polyacrylamide Market Revenue (Billion) Forecast, by Application 2019 & 2032
- Table 72: China Polyacrylamide Market Volume (K Tons) Forecast, by Application 2019 & 2032
- Table 73: India Polyacrylamide Market Revenue (Billion) Forecast, by Application 2019 & 2032
- Table 74: India Polyacrylamide Market Volume (K Tons) Forecast, by Application 2019 & 2032
- Table 75: Japan Polyacrylamide Market Revenue (Billion) Forecast, by Application 2019 & 2032
- Table 76: Japan Polyacrylamide Market Volume (K Tons) Forecast, by Application 2019 & 2032
- Table 77: South Korea Polyacrylamide Market Revenue (Billion) Forecast, by Application 2019 & 2032
- Table 78: South Korea Polyacrylamide Market Volume (K Tons) Forecast, by Application 2019 & 2032
- Table 79: Rest of Asia Pacific Polyacrylamide Market Revenue (Billion) Forecast, by Application 2019 & 2032
- Table 80: Rest of Asia Pacific Polyacrylamide Market Volume (K Tons) Forecast, by Application 2019 & 2032
- Table 81: Global Polyacrylamide Market Revenue Billion Forecast, by Physical Form 2019 & 2032
- Table 82: Global Polyacrylamide Market Volume K Tons Forecast, by Physical Form 2019 & 2032
- Table 83: Global Polyacrylamide Market Revenue Billion Forecast, by Application 2019 & 2032
- Table 84: Global Polyacrylamide Market Volume K Tons Forecast, by Application 2019 & 2032
- Table 85: Global Polyacrylamide Market Revenue Billion Forecast, by End-user Industry 2019 & 2032
- Table 86: Global Polyacrylamide Market Volume K Tons Forecast, by End-user Industry 2019 & 2032
- Table 87: Global Polyacrylamide Market Revenue Billion Forecast, by Country 2019 & 2032
- Table 88: Global Polyacrylamide Market Volume K Tons Forecast, by Country 2019 & 2032
- Table 89: United States Polyacrylamide Market Revenue (Billion) Forecast, by Application 2019 & 2032
- Table 90: United States Polyacrylamide Market Volume (K Tons) Forecast, by Application 2019 & 2032
- Table 91: Canada Polyacrylamide Market Revenue (Billion) Forecast, by Application 2019 & 2032
- Table 92: Canada Polyacrylamide Market Volume (K Tons) Forecast, by Application 2019 & 2032
- Table 93: Mexico Polyacrylamide Market Revenue (Billion) Forecast, by Application 2019 & 2032
- Table 94: Mexico Polyacrylamide Market Volume (K Tons) Forecast, by Application 2019 & 2032
- Table 95: Global Polyacrylamide Market Revenue Billion Forecast, by Physical Form 2019 & 2032
- Table 96: Global Polyacrylamide Market Volume K Tons Forecast, by Physical Form 2019 & 2032
- Table 97: Global Polyacrylamide Market Revenue Billion Forecast, by Application 2019 & 2032
- Table 98: Global Polyacrylamide Market Volume K Tons Forecast, by Application 2019 & 2032
- Table 99: Global Polyacrylamide Market Revenue Billion Forecast, by End-user Industry 2019 & 2032
- Table 100: Global Polyacrylamide Market Volume K Tons Forecast, by End-user Industry 2019 & 2032
- Table 101: Global Polyacrylamide Market Revenue Billion Forecast, by Country 2019 & 2032
- Table 102: Global Polyacrylamide Market Volume K Tons Forecast, by Country 2019 & 2032
- Table 103: Germany Polyacrylamide Market Revenue (Billion) Forecast, by Application 2019 & 2032
- Table 104: Germany Polyacrylamide Market Volume (K Tons) Forecast, by Application 2019 & 2032
- Table 105: United Kingdom Polyacrylamide Market Revenue (Billion) Forecast, by Application 2019 & 2032
- Table 106: United Kingdom Polyacrylamide Market Volume (K Tons) Forecast, by Application 2019 & 2032
- Table 107: France Polyacrylamide Market Revenue (Billion) Forecast, by Application 2019 & 2032
- Table 108: France Polyacrylamide Market Volume (K Tons) Forecast, by Application 2019 & 2032
- Table 109: Russia Polyacrylamide Market Revenue (Billion) Forecast, by Application 2019 & 2032
- Table 110: Russia Polyacrylamide Market Volume (K Tons) Forecast, by Application 2019 & 2032
- Table 111: Netherlands Polyacrylamide Market Revenue (Billion) Forecast, by Application 2019 & 2032
- Table 112: Netherlands Polyacrylamide Market Volume (K Tons) Forecast, by Application 2019 & 2032
- Table 113: Rest of Europe Polyacrylamide Market Revenue (Billion) Forecast, by Application 2019 & 2032
- Table 114: Rest of Europe Polyacrylamide Market Volume (K Tons) Forecast, by Application 2019 & 2032
- Table 115: Global Polyacrylamide Market Revenue Billion Forecast, by Physical Form 2019 & 2032
- Table 116: Global Polyacrylamide Market Volume K Tons Forecast, by Physical Form 2019 & 2032
- Table 117: Global Polyacrylamide Market Revenue Billion Forecast, by Application 2019 & 2032
- Table 118: Global Polyacrylamide Market Volume K Tons Forecast, by Application 2019 & 2032
- Table 119: Global Polyacrylamide Market Revenue Billion Forecast, by End-user Industry 2019 & 2032
- Table 120: Global Polyacrylamide Market Volume K Tons Forecast, by End-user Industry 2019 & 2032
- Table 121: Global Polyacrylamide Market Revenue Billion Forecast, by Country 2019 & 2032
- Table 122: Global Polyacrylamide Market Volume K Tons Forecast, by Country 2019 & 2032
- Table 123: Brazil Polyacrylamide Market Revenue (Billion) Forecast, by Application 2019 & 2032
- Table 124: Brazil Polyacrylamide Market Volume (K Tons) Forecast, by Application 2019 & 2032
- Table 125: Argentina Polyacrylamide Market Revenue (Billion) Forecast, by Application 2019 & 2032
- Table 126: Argentina Polyacrylamide Market Volume (K Tons) Forecast, by Application 2019 & 2032
- Table 127: Rest of South America Polyacrylamide Market Revenue (Billion) Forecast, by Application 2019 & 2032
- Table 128: Rest of South America Polyacrylamide Market Volume (K Tons) Forecast, by Application 2019 & 2032
- Table 129: Global Polyacrylamide Market Revenue Billion Forecast, by Physical Form 2019 & 2032
- Table 130: Global Polyacrylamide Market Volume K Tons Forecast, by Physical Form 2019 & 2032
- Table 131: Global Polyacrylamide Market Revenue Billion Forecast, by Application 2019 & 2032
- Table 132: Global Polyacrylamide Market Volume K Tons Forecast, by Application 2019 & 2032
- Table 133: Global Polyacrylamide Market Revenue Billion Forecast, by End-user Industry 2019 & 2032
- Table 134: Global Polyacrylamide Market Volume K Tons Forecast, by End-user Industry 2019 & 2032
- Table 135: Global Polyacrylamide Market Revenue Billion Forecast, by Country 2019 & 2032
- Table 136: Global Polyacrylamide Market Volume K Tons Forecast, by Country 2019 & 2032
- Table 137: Saudi Arabia Polyacrylamide Market Revenue (Billion) Forecast, by Application 2019 & 2032
- Table 138: Saudi Arabia Polyacrylamide Market Volume (K Tons) Forecast, by Application 2019 & 2032
- Table 139: South Africa Polyacrylamide Market Revenue (Billion) Forecast, by Application 2019 & 2032
- Table 140: South Africa Polyacrylamide Market Volume (K Tons) Forecast, by Application 2019 & 2032
- Table 141: Rest of Middle East and Africa Polyacrylamide Market Revenue (Billion) Forecast, by Application 2019 & 2032
- Table 142: Rest of Middle East and Africa Polyacrylamide Market Volume (K Tons) Forecast, by Application 2019 & 2032
Frequently Asked Questions
1. What is the projected Compound Annual Growth Rate (CAGR) of the Polyacrylamide Market?
The projected CAGR is approximately 6%.
2. Which companies are prominent players in the Polyacrylamide Market?
Key companies in the market include Beijing Xitao Technology Development Co Ltd, Solvay, Envitech Chemical Specialities Pvt Ltd, Anhui Tianrun Chemical Industry Co Ltd, Shandong Tongli Chemical Co Ltd, Yixing Cleanwater Chemicals Co Ltd, Ashland, Liaocheng Yongxing Environmental Protection Science&Technology Co Ltd, BASF SE, Qingdao Oubo Chemical Co Ltd, AnHui JuCheng Fine Chemicals Co Ltd, Kemira, Solenis, Beijing Hengju Chemical Group Corporation, CHINAFLOC, SNF Group.
3. What are the main segments of the Polyacrylamide Market?
The market segments include Physical Form, Application, End-user Industry.
4. Can you provide details about the market size?
The market size is estimated to be USD 5.7 Billion as of 2022.
5. What are some drivers contributing to market growth?
Growing Utilization in the Oil and Gas Industry for Enhanced Oil Recovery; Increasing Demand for Polyacrylamide as a Flocculant in Water Treatment Industry.
6. What are the notable trends driving market growth?
Water Treatment Industry to Dominate the Market.
7. Are there any restraints impacting market growth?
Health Concerns Caused by Exposure to Acrylamide Monomer.
8. Can you provide examples of recent developments in the market?
February 2022: Kemira announced the initiation of full-scale production of its newly developed polymer-based (polyacrylamide) on biobased feedstock. With this production, Kemira further strengthened its position as the provider of sustainable chemistry solutions for water-intensive industries.
9. What pricing options are available for accessing the report?
Pricing options include single-user, multi-user, and enterprise licenses priced at USD 4750, USD 5250, and USD 8750 respectively.
10. Is the market size provided in terms of value or volume?
The market size is provided in terms of value, measured in Billion and volume, measured in K Tons.
11. Are there any specific market keywords associated with the report?
Yes, the market keyword associated with the report is "Polyacrylamide Market," which aids in identifying and referencing the specific market segment covered.
12. How do I determine which pricing option suits my needs best?
The pricing options vary based on user requirements and access needs. Individual users may opt for single-user licenses, while businesses requiring broader access may choose multi-user or enterprise licenses for cost-effective access to the report.
13. Are there any additional resources or data provided in the Polyacrylamide Market report?
While the report offers comprehensive insights, it's advisable to review the specific contents or supplementary materials provided to ascertain if additional resources or data are available.
14. How can I stay updated on further developments or reports in the Polyacrylamide Market?
To stay informed about further developments, trends, and reports in the Polyacrylamide Market, consider subscribing to industry newsletters, following relevant companies and organizations, or regularly checking reputable industry news sources and publications.
Methodology
Step 1 - Identification of Relevant Samples Size from Population Database


Step 2 - Approaches for Defining Global Market Size (Value, Volume* & Price*)

Note*: In applicable scenarios
Step 3 - Data Sources
Primary Research
- Web Analytics
- Survey Reports
- Research Institute
- Latest Research Reports
- Opinion Leaders
Secondary Research
- Annual Reports
- White Paper
- Latest Press Release
- Industry Association
- Paid Database
- Investor Presentations

Step 4 - Data Triangulation
Involves using different sources of information in order to increase the validity of a study
These sources are likely to be stakeholders in a program - participants, other researchers, program staff, other community members, and so on.
Then we put all data in single framework & apply various statistical tools to find out the dynamic on the market.
During the analysis stage, feedback from the stakeholder groups would be compared to determine areas of agreement as well as areas of divergence
