

Key Insights
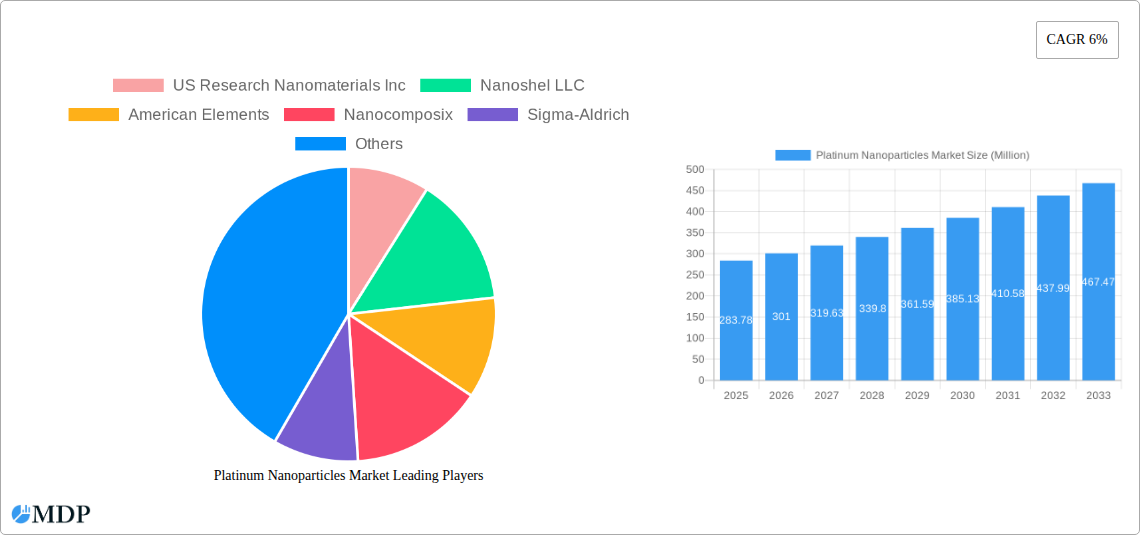
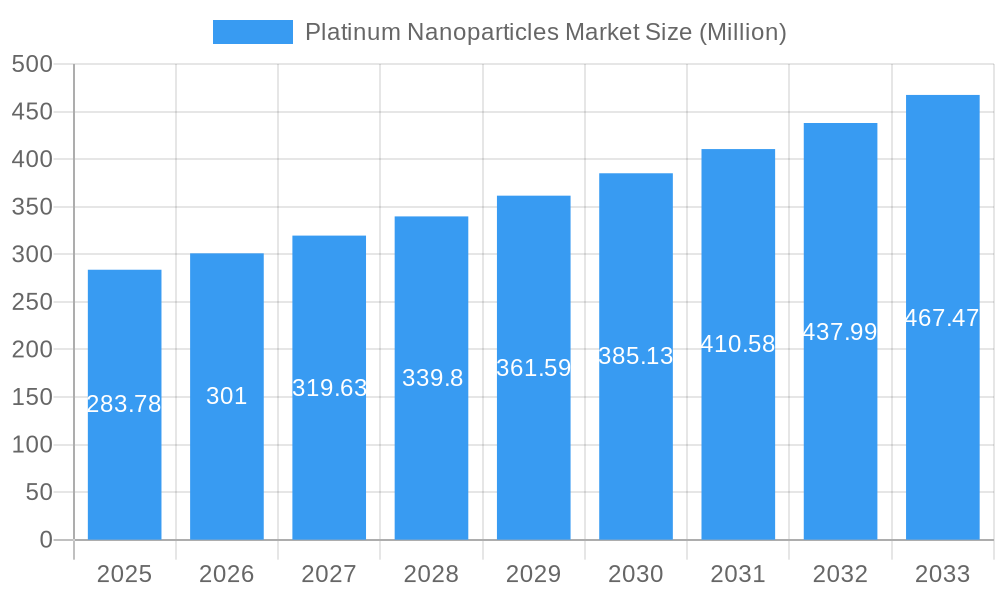
The Platinum Nanoparticles market, valued at $283.78 million in 2025, is projected to experience robust growth, driven by its increasing applications across diverse sectors. The 6% CAGR indicates a significant expansion over the forecast period (2025-2033). Key drivers include the escalating demand for platinum nanoparticles in catalysis, particularly in the automotive industry for emission control systems and in the chemical industry for various reactions. The growing healthcare sector, leveraging the unique properties of platinum nanoparticles for drug delivery and diagnostics, further fuels market expansion. Emerging trends such as the development of novel synthesis techniques for improved particle size control and enhanced functionalities are also contributing to market growth. However, challenges like high production costs and potential toxicity concerns could act as restraints. Market segmentation reveals strong demand across various product shapes (spherical, cubic, square, and others) and end-user industries (automotive, healthcare, chemical, and others). North America currently holds a significant market share due to robust R&D investments and a strong presence of key players. However, the Asia-Pacific region, driven by rapid industrialization and increasing adoption in developing economies, is poised for significant growth in the coming years. The competitive landscape comprises both established chemical companies and specialized nanomaterials producers, leading to innovation and expanding product offerings.
Platinum Nanoparticles Market Market Size (In Million)
The diverse applications of platinum nanoparticles, coupled with ongoing research and development, suggest a promising outlook for market expansion. The automotive industry's continued reliance on emission control catalysts will remain a cornerstone of demand. Furthermore, the exploration of platinum nanoparticles in innovative areas like targeted drug delivery and advanced materials science presents significant growth opportunities. While challenges exist, strategic investments in efficient and sustainable production methods, along with thorough safety assessments, will be crucial for realizing the full potential of this burgeoning market. The ongoing expansion of the healthcare and chemical sectors, along with government initiatives promoting nanotechnology development, are expected to contribute substantially to market growth throughout the forecast period.
Platinum Nanoparticles Market Company Market Share
Platinum Nanoparticles Market: A Comprehensive Analysis (2019-2033)
This comprehensive report provides an in-depth analysis of the Platinum Nanoparticles Market, offering invaluable insights for stakeholders seeking to navigate this dynamic sector. The report covers the period from 2019 to 2033, with a focus on the 2025-2033 forecast period and a detailed analysis of 2025 as the base year. Market size is presented in Millions.
Keywords: Platinum Nanoparticles, Market Analysis, Market Size, Market Forecast, Spherical Platinum Nanoparticles, Cube Platinum Nanoparticles, Automotive Applications, Healthcare Applications, Nanotechnology, US Research Nanomaterials Inc, Nanoshel LLC, American Elements, Nanocomposix, Sigma-Aldrich, Market Growth, Industry Trends
Platinum Nanoparticles Market Dynamics & Concentration
The Platinum Nanoparticles market is characterized by moderate concentration, with several key players holding significant market share. The market is driven by ongoing innovation in nanotechnology, particularly in applications demanding high catalytic activity and biocompatibility. Stringent regulatory frameworks governing the production and use of nanoparticles influence market dynamics. Product substitutes, while existing, often lack the unique properties of platinum nanoparticles, thus limiting their widespread adoption. End-user trends are strongly influenced by technological advancements and regulatory compliance in key industries such as automotive and healthcare. M&A activities in the past 5 years have been moderate, with approximately xx deals recorded, indicating a consolidating market. Major players like Sigma-Aldrich and Tanaka Holdings Co Ltd hold significant market shares estimated around xx% and xx% respectively, while other companies contribute to the remaining xx%.
Platinum Nanoparticles Market Industry Trends & Analysis
The Platinum Nanoparticles market is experiencing robust growth, with a projected CAGR of xx% during the forecast period (2025-2033). This growth is fueled by increasing demand from the automotive and healthcare sectors. Technological advancements in synthesis techniques are improving the quality and reducing the cost of platinum nanoparticles, further stimulating market expansion. The market penetration of platinum nanoparticles in various applications is gradually increasing, driven by their superior performance compared to traditional materials. Consumer preferences are shifting towards products incorporating nanotechnology, boosting the demand for these advanced materials. The competitive landscape is dynamic, with established players and emerging companies vying for market share through product differentiation, technological advancements and strategic partnerships.
Leading Markets & Segments in Platinum Nanoparticles Market
The North American region currently holds a dominant position in the Platinum Nanoparticles market, driven by strong research and development activities and substantial investments in nanotechnology. Within the product segments, spherical platinum nanoparticles command the largest market share due to their ease of synthesis and versatile applications. In terms of end-user industries, the healthcare sector shows significant growth potential, with applications in drug delivery, diagnostics, and medical imaging driving demand.
- Key Drivers in North America:
- Robust funding for nanotechnology research.
- Strong presence of major players.
- Stringent environmental regulations promoting cleaner technologies.
- Key Drivers in Healthcare Sector:
- Growing demand for advanced diagnostics and therapeutics.
- Increasing prevalence of chronic diseases.
- Investments in nanomedicine research and development.
The Automotive sector is another significant end-user segment with applications in catalytic converters driving substantial growth. While the European and Asian markets are growing rapidly, North America maintains the leading position due to the reasons mentioned above.
Platinum Nanoparticles Market Product Developments
Recent innovations have focused on enhancing the size control, shape manipulation and surface functionalization of platinum nanoparticles to improve their performance in various applications. This includes developing novel synthesis methods for achieving uniform size and shape, enabling enhanced catalytic activity, improved biocompatibility and controlled drug release for targeted therapies. The incorporation of these nanoparticles into new composites and formulations is also ongoing, resulting in superior materials with increased efficiency and application-specific advantages in various sectors. These advancements are driving the adoption of platinum nanoparticles across diverse industries.
Key Drivers of Platinum Nanoparticles Market Growth
Several factors fuel the growth of the Platinum Nanoparticles market:
- Technological advancements: Improved synthesis methods, surface modification techniques, and characterization tools are constantly enhancing the quality and performance of these nanoparticles.
- Economic factors: Rising disposable incomes in developing countries and increased investment in research and development are contributing to market expansion.
- Regulatory support: Government initiatives promoting nanotechnology research and development are fostering market growth. For instance, funding programs and tax incentives are encouraging investments in this sector.
Challenges in the Platinum Nanoparticles Market
The Platinum Nanoparticles market faces several challenges:
- Regulatory hurdles: Strict regulations surrounding the production and use of nanoparticles can impede market growth, increasing costs and complexity.
- Supply chain issues: The supply chain for platinum, a precious metal, can be vulnerable to disruptions, affecting the cost and availability of nanoparticles.
- Competitive pressures: The market is becoming increasingly competitive, with both established players and new entrants vying for market share. This is leading to price pressure and the need for continuous innovation.
Emerging Opportunities in Platinum Nanoparticles Market
Significant opportunities exist for long-term growth:
The development of novel applications, especially in targeted drug delivery systems and next-generation catalytic converters, promises substantial market expansion. Strategic partnerships between nanotechnology companies and established players in end-user industries are opening new avenues for market penetration. Furthermore, expansion into emerging markets with growing demand for advanced materials will be a significant growth driver.
Leading Players in the Platinum Nanoparticles Market Sector
- US Research Nanomaterials Inc
- Nanoshel LLC
- American Elements
- Nanocomposix
- Sigma-Aldrich
- NanoBio Chemicals India Pvt Ltd
- TANAKA HOLDINGS Co Ltd
- Nanostructured & Amorphous Materials Inc
- Metrohm India Limited
- HiQ-Nano s r l
- Strem Chemicals Inc
- PlasmaChem GmbH
- Meliorum Technologies Inc
- Particular GMBH
- NANOCHEMAZONE
Key Milestones in Platinum Nanoparticles Market Industry
- 2020: Significant advancements in the synthesis of highly uniform platinum nanoparticles are announced, improving their catalytic efficiency.
- 2021: A major player launches a new line of functionalized platinum nanoparticles for targeted drug delivery applications.
- 2022: A strategic partnership between a nanotechnology firm and an automotive manufacturer leads to the development of improved catalytic converters.
- 2023: New regulatory guidelines are introduced impacting the production and use of platinum nanoparticles, prompting companies to adapt their processes.
- 2024: Several M&A activities consolidate the market further.
Strategic Outlook for Platinum Nanoparticles Market
The Platinum Nanoparticles market shows immense potential for growth, driven by ongoing technological advancements, increasing demand from key industries, and supportive regulatory environments. Strategic opportunities exist for companies to focus on developing innovative applications, strengthening supply chains, and forging strategic partnerships to expand their market reach. Focusing on sustainable and cost-effective production methods will be vital for long-term success. The market is poised for significant expansion, making it an attractive investment opportunity for stakeholders.
Platinum Nanoparticles Market Segmentation
-
1. Product
- 1.1. Spherical
- 1.2. Cube
- 1.3. Square
- 1.4. Others
-
2. End-user Industry
- 2.1. Automotive
- 2.2. Health Care
- 2.3. Chemical
- 2.4. Others
Platinum Nanoparticles Market Segmentation By Geography
-
1. Asia Pacific
- 1.1. China
- 1.2. India
- 1.3. Japan
- 1.4. South Korea
- 1.5. Rest of Asia Pacific
-
2. North America
- 2.1. United States
- 2.2. Canada
- 2.3. Mexico
-
3. Europe
- 3.1. Germany
- 3.2. United Kingdom
- 3.3. France
- 3.4. Italy
- 3.5. Rest of Europe
-
4. South America
- 4.1. Brazil
- 4.2. Argentina
- 4.3. Rest of South America
-
5. Middle East and Africa
- 5.1. Saudi Arabia
- 5.2. South Africa
- 5.3. Rest of Middle East and Africa
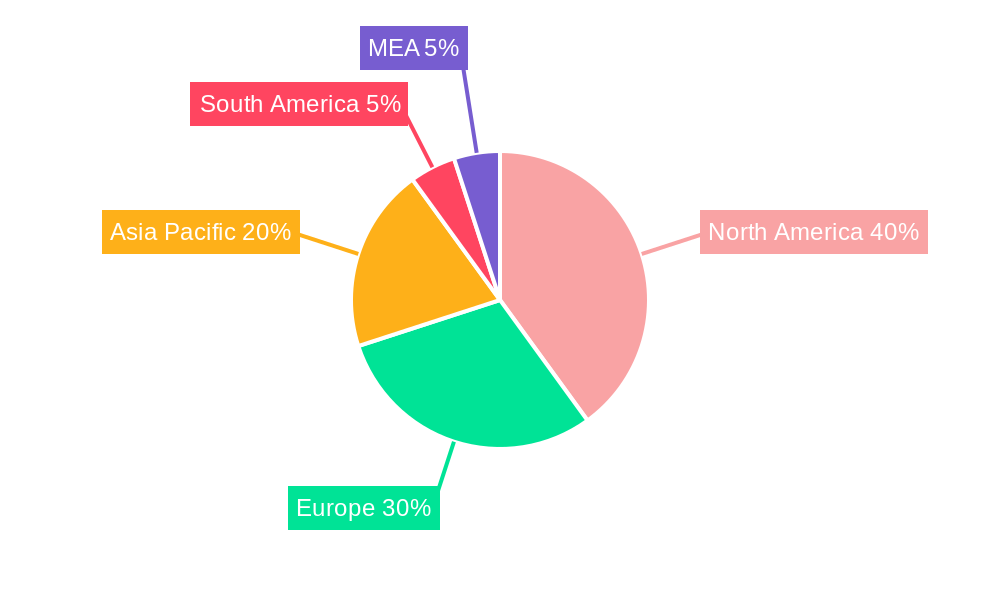
Platinum Nanoparticles Market Regional Market Share
Geographic Coverage of Platinum Nanoparticles Market
Platinum Nanoparticles Market REPORT HIGHLIGHTS
| Aspects | Details |
|---|---|
| Study Period | 2020-2034 |
| Base Year | 2025 |
| Estimated Year | 2026 |
| Forecast Period | 2026-2034 |
| Historical Period | 2020-2025 |
| Growth Rate | CAGR of 6% from 2020-2034 |
| Segmentation |
|
Table of Contents
- 1. Introduction
- 1.1. Research Scope
- 1.2. Market Segmentation
- 1.3. Research Objective
- 1.4. Definitions and Assumptions
- 2. Executive Summary
- 2.1. Market Snapshot
- 3. Market Dynamics
- 3.1. Market Drivers
- 3.2. Market Restrains
- 3.3. Market Trends
- 3.4. Market Opportunities
- 4. Market Factor Analysis
- 4.1. Porters Five Forces
- 4.1.1. Bargaining Power of Suppliers
- 4.1.2. Bargaining Power of Buyers
- 4.1.3. Threat of New Entrants
- 4.1.4. Threat of Substitutes
- 4.1.5. Competitive Rivalry
- 4.2. PESTEL analysis
- 4.3. BCG Analysis
- 4.3.1. Stars (High Growth, High Market Share)
- 4.3.2. Cash Cows (Low Growth, High Market Share)
- 4.3.3. Question Mark (High Growth, Low Market Share)
- 4.3.4. Dogs (Low Growth, Low Market Share)
- 4.4. Ansoff Matrix Analysis
- 4.5. Supply Chain Analysis
- 4.6. Regulatory Landscape
- 4.7. Current Market Potential and Opportunity Assessment (TAM–SAM–SOM Framework)
- 4.8. MDP Analyst Note
- 4.1. Porters Five Forces
- 5. Market Analysis, Insights and Forecast 2021-2033
- 5.1. Market Analysis, Insights and Forecast - by Product
- 5.1.1. Spherical
- 5.1.2. Cube
- 5.1.3. Square
- 5.1.4. Others
- 5.2. Market Analysis, Insights and Forecast - by End-user Industry
- 5.2.1. Automotive
- 5.2.2. Health Care
- 5.2.3. Chemical
- 5.2.4. Others
- 5.3. Market Analysis, Insights and Forecast - by Region
- 5.3.1. Asia Pacific
- 5.3.2. North America
- 5.3.3. Europe
- 5.3.4. South America
- 5.3.5. Middle East and Africa
- 5.1. Market Analysis, Insights and Forecast - by Product
- 6. Global Platinum Nanoparticles Market Analysis, Insights and Forecast, 2021-2033
- 6.1. Market Analysis, Insights and Forecast - by Product
- 6.1.1. Spherical
- 6.1.2. Cube
- 6.1.3. Square
- 6.1.4. Others
- 6.2. Market Analysis, Insights and Forecast - by End-user Industry
- 6.2.1. Automotive
- 6.2.2. Health Care
- 6.2.3. Chemical
- 6.2.4. Others
- 6.1. Market Analysis, Insights and Forecast - by Product
- 7. Asia Pacific Platinum Nanoparticles Market Analysis, Insights and Forecast, 2020-2032
- 7.1. Market Analysis, Insights and Forecast - by Product
- 7.1.1. Spherical
- 7.1.2. Cube
- 7.1.3. Square
- 7.1.4. Others
- 7.2. Market Analysis, Insights and Forecast - by End-user Industry
- 7.2.1. Automotive
- 7.2.2. Health Care
- 7.2.3. Chemical
- 7.2.4. Others
- 7.1. Market Analysis, Insights and Forecast - by Product
- 8. North America Platinum Nanoparticles Market Analysis, Insights and Forecast, 2020-2032
- 8.1. Market Analysis, Insights and Forecast - by Product
- 8.1.1. Spherical
- 8.1.2. Cube
- 8.1.3. Square
- 8.1.4. Others
- 8.2. Market Analysis, Insights and Forecast - by End-user Industry
- 8.2.1. Automotive
- 8.2.2. Health Care
- 8.2.3. Chemical
- 8.2.4. Others
- 8.1. Market Analysis, Insights and Forecast - by Product
- 9. Europe Platinum Nanoparticles Market Analysis, Insights and Forecast, 2020-2032
- 9.1. Market Analysis, Insights and Forecast - by Product
- 9.1.1. Spherical
- 9.1.2. Cube
- 9.1.3. Square
- 9.1.4. Others
- 9.2. Market Analysis, Insights and Forecast - by End-user Industry
- 9.2.1. Automotive
- 9.2.2. Health Care
- 9.2.3. Chemical
- 9.2.4. Others
- 9.1. Market Analysis, Insights and Forecast - by Product
- 10. South America Platinum Nanoparticles Market Analysis, Insights and Forecast, 2020-2032
- 10.1. Market Analysis, Insights and Forecast - by Product
- 10.1.1. Spherical
- 10.1.2. Cube
- 10.1.3. Square
- 10.1.4. Others
- 10.2. Market Analysis, Insights and Forecast - by End-user Industry
- 10.2.1. Automotive
- 10.2.2. Health Care
- 10.2.3. Chemical
- 10.2.4. Others
- 10.1. Market Analysis, Insights and Forecast - by Product
- 11. Middle East and Africa Platinum Nanoparticles Market Analysis, Insights and Forecast, 2020-2032
- 11.1. Market Analysis, Insights and Forecast - by Product
- 11.1.1. Spherical
- 11.1.2. Cube
- 11.1.3. Square
- 11.1.4. Others
- 11.2. Market Analysis, Insights and Forecast - by End-user Industry
- 11.2.1. Automotive
- 11.2.2. Health Care
- 11.2.3. Chemical
- 11.2.4. Others
- 11.1. Market Analysis, Insights and Forecast - by Product
- 12. Competitive Analysis
- 12.1. Company Profiles
- 12.1.1 US Research Nanomaterials Inc
- 12.1.1.1. Company Overview
- 12.1.1.2. Products
- 12.1.1.3. Company Financials
- 12.1.1.4. SWOT Analysis
- 12.1.2 Nanoshel LLC
- 12.1.2.1. Company Overview
- 12.1.2.2. Products
- 12.1.2.3. Company Financials
- 12.1.2.4. SWOT Analysis
- 12.1.3 American Elements
- 12.1.3.1. Company Overview
- 12.1.3.2. Products
- 12.1.3.3. Company Financials
- 12.1.3.4. SWOT Analysis
- 12.1.4 Nanocomposix
- 12.1.4.1. Company Overview
- 12.1.4.2. Products
- 12.1.4.3. Company Financials
- 12.1.4.4. SWOT Analysis
- 12.1.5 Sigma-Aldrich
- 12.1.5.1. Company Overview
- 12.1.5.2. Products
- 12.1.5.3. Company Financials
- 12.1.5.4. SWOT Analysis
- 12.1.6 NanoBio Chemicals India Pvt Ltd
- 12.1.6.1. Company Overview
- 12.1.6.2. Products
- 12.1.6.3. Company Financials
- 12.1.6.4. SWOT Analysis
- 12.1.7 TANAKA HOLDINGS Co Ltd
- 12.1.7.1. Company Overview
- 12.1.7.2. Products
- 12.1.7.3. Company Financials
- 12.1.7.4. SWOT Analysis
- 12.1.8 Nanostructured & Amorphous Materials Inc
- 12.1.8.1. Company Overview
- 12.1.8.2. Products
- 12.1.8.3. Company Financials
- 12.1.8.4. SWOT Analysis
- 12.1.9 Metrohm India Limited
- 12.1.9.1. Company Overview
- 12.1.9.2. Products
- 12.1.9.3. Company Financials
- 12.1.9.4. SWOT Analysis
- 12.1.10 HiQ-Nano s r l
- 12.1.10.1. Company Overview
- 12.1.10.2. Products
- 12.1.10.3. Company Financials
- 12.1.10.4. SWOT Analysis
- 12.1.11 Strem Chemicals Inc
- 12.1.11.1. Company Overview
- 12.1.11.2. Products
- 12.1.11.3. Company Financials
- 12.1.11.4. SWOT Analysis
- 12.1.12 PlasmaChem GmbH
- 12.1.12.1. Company Overview
- 12.1.12.2. Products
- 12.1.12.3. Company Financials
- 12.1.12.4. SWOT Analysis
- 12.1.13 Meliorum Technologies Inc
- 12.1.13.1. Company Overview
- 12.1.13.2. Products
- 12.1.13.3. Company Financials
- 12.1.13.4. SWOT Analysis
- 12.1.14 Particular GMBH
- 12.1.14.1. Company Overview
- 12.1.14.2. Products
- 12.1.14.3. Company Financials
- 12.1.14.4. SWOT Analysis
- 12.1.15 NANOCHEMAZONE
- 12.1.15.1. Company Overview
- 12.1.15.2. Products
- 12.1.15.3. Company Financials
- 12.1.15.4. SWOT Analysis
- 12.1.1 US Research Nanomaterials Inc
- 12.2. Market Entropy
- 12.2.1 Company's Key Areas Served
- 12.2.2 Recent Developments
- 12.3. Company Market Share Analysis 2025
- 12.3.1 Top 5 Companies Market Share Analysis
- 12.3.2 Top 3 Companies Market Share Analysis
- 12.4. List of Potential Customers
- 13. Research Methodology
List of Figures
- Figure 1: Global Platinum Nanoparticles Market Revenue Breakdown (Million, %) by Region 2025 & 2033
- Figure 2: Global Platinum Nanoparticles Market Volume Breakdown (K Tons, %) by Region 2025 & 2033
- Figure 3: Asia Pacific Platinum Nanoparticles Market Revenue (Million), by Product 2025 & 2033
- Figure 4: Asia Pacific Platinum Nanoparticles Market Volume (K Tons), by Product 2025 & 2033
- Figure 5: Asia Pacific Platinum Nanoparticles Market Revenue Share (%), by Product 2025 & 2033
- Figure 6: Asia Pacific Platinum Nanoparticles Market Volume Share (%), by Product 2025 & 2033
- Figure 7: Asia Pacific Platinum Nanoparticles Market Revenue (Million), by End-user Industry 2025 & 2033
- Figure 8: Asia Pacific Platinum Nanoparticles Market Volume (K Tons), by End-user Industry 2025 & 2033
- Figure 9: Asia Pacific Platinum Nanoparticles Market Revenue Share (%), by End-user Industry 2025 & 2033
- Figure 10: Asia Pacific Platinum Nanoparticles Market Volume Share (%), by End-user Industry 2025 & 2033
- Figure 11: Asia Pacific Platinum Nanoparticles Market Revenue (Million), by Country 2025 & 2033
- Figure 12: Asia Pacific Platinum Nanoparticles Market Volume (K Tons), by Country 2025 & 2033
- Figure 13: Asia Pacific Platinum Nanoparticles Market Revenue Share (%), by Country 2025 & 2033
- Figure 14: Asia Pacific Platinum Nanoparticles Market Volume Share (%), by Country 2025 & 2033
- Figure 15: North America Platinum Nanoparticles Market Revenue (Million), by Product 2025 & 2033
- Figure 16: North America Platinum Nanoparticles Market Volume (K Tons), by Product 2025 & 2033
- Figure 17: North America Platinum Nanoparticles Market Revenue Share (%), by Product 2025 & 2033
- Figure 18: North America Platinum Nanoparticles Market Volume Share (%), by Product 2025 & 2033
- Figure 19: North America Platinum Nanoparticles Market Revenue (Million), by End-user Industry 2025 & 2033
- Figure 20: North America Platinum Nanoparticles Market Volume (K Tons), by End-user Industry 2025 & 2033
- Figure 21: North America Platinum Nanoparticles Market Revenue Share (%), by End-user Industry 2025 & 2033
- Figure 22: North America Platinum Nanoparticles Market Volume Share (%), by End-user Industry 2025 & 2033
- Figure 23: North America Platinum Nanoparticles Market Revenue (Million), by Country 2025 & 2033
- Figure 24: North America Platinum Nanoparticles Market Volume (K Tons), by Country 2025 & 2033
- Figure 25: North America Platinum Nanoparticles Market Revenue Share (%), by Country 2025 & 2033
- Figure 26: North America Platinum Nanoparticles Market Volume Share (%), by Country 2025 & 2033
- Figure 27: Europe Platinum Nanoparticles Market Revenue (Million), by Product 2025 & 2033
- Figure 28: Europe Platinum Nanoparticles Market Volume (K Tons), by Product 2025 & 2033
- Figure 29: Europe Platinum Nanoparticles Market Revenue Share (%), by Product 2025 & 2033
- Figure 30: Europe Platinum Nanoparticles Market Volume Share (%), by Product 2025 & 2033
- Figure 31: Europe Platinum Nanoparticles Market Revenue (Million), by End-user Industry 2025 & 2033
- Figure 32: Europe Platinum Nanoparticles Market Volume (K Tons), by End-user Industry 2025 & 2033
- Figure 33: Europe Platinum Nanoparticles Market Revenue Share (%), by End-user Industry 2025 & 2033
- Figure 34: Europe Platinum Nanoparticles Market Volume Share (%), by End-user Industry 2025 & 2033
- Figure 35: Europe Platinum Nanoparticles Market Revenue (Million), by Country 2025 & 2033
- Figure 36: Europe Platinum Nanoparticles Market Volume (K Tons), by Country 2025 & 2033
- Figure 37: Europe Platinum Nanoparticles Market Revenue Share (%), by Country 2025 & 2033
- Figure 38: Europe Platinum Nanoparticles Market Volume Share (%), by Country 2025 & 2033
- Figure 39: South America Platinum Nanoparticles Market Revenue (Million), by Product 2025 & 2033
- Figure 40: South America Platinum Nanoparticles Market Volume (K Tons), by Product 2025 & 2033
- Figure 41: South America Platinum Nanoparticles Market Revenue Share (%), by Product 2025 & 2033
- Figure 42: South America Platinum Nanoparticles Market Volume Share (%), by Product 2025 & 2033
- Figure 43: South America Platinum Nanoparticles Market Revenue (Million), by End-user Industry 2025 & 2033
- Figure 44: South America Platinum Nanoparticles Market Volume (K Tons), by End-user Industry 2025 & 2033
- Figure 45: South America Platinum Nanoparticles Market Revenue Share (%), by End-user Industry 2025 & 2033
- Figure 46: South America Platinum Nanoparticles Market Volume Share (%), by End-user Industry 2025 & 2033
- Figure 47: South America Platinum Nanoparticles Market Revenue (Million), by Country 2025 & 2033
- Figure 48: South America Platinum Nanoparticles Market Volume (K Tons), by Country 2025 & 2033
- Figure 49: South America Platinum Nanoparticles Market Revenue Share (%), by Country 2025 & 2033
- Figure 50: South America Platinum Nanoparticles Market Volume Share (%), by Country 2025 & 2033
- Figure 51: Middle East and Africa Platinum Nanoparticles Market Revenue (Million), by Product 2025 & 2033
- Figure 52: Middle East and Africa Platinum Nanoparticles Market Volume (K Tons), by Product 2025 & 2033
- Figure 53: Middle East and Africa Platinum Nanoparticles Market Revenue Share (%), by Product 2025 & 2033
- Figure 54: Middle East and Africa Platinum Nanoparticles Market Volume Share (%), by Product 2025 & 2033
- Figure 55: Middle East and Africa Platinum Nanoparticles Market Revenue (Million), by End-user Industry 2025 & 2033
- Figure 56: Middle East and Africa Platinum Nanoparticles Market Volume (K Tons), by End-user Industry 2025 & 2033
- Figure 57: Middle East and Africa Platinum Nanoparticles Market Revenue Share (%), by End-user Industry 2025 & 2033
- Figure 58: Middle East and Africa Platinum Nanoparticles Market Volume Share (%), by End-user Industry 2025 & 2033
- Figure 59: Middle East and Africa Platinum Nanoparticles Market Revenue (Million), by Country 2025 & 2033
- Figure 60: Middle East and Africa Platinum Nanoparticles Market Volume (K Tons), by Country 2025 & 2033
- Figure 61: Middle East and Africa Platinum Nanoparticles Market Revenue Share (%), by Country 2025 & 2033
- Figure 62: Middle East and Africa Platinum Nanoparticles Market Volume Share (%), by Country 2025 & 2033
List of Tables
- Table 1: Global Platinum Nanoparticles Market Revenue Million Forecast, by Product 2020 & 2033
- Table 2: Global Platinum Nanoparticles Market Volume K Tons Forecast, by Product 2020 & 2033
- Table 3: Global Platinum Nanoparticles Market Revenue Million Forecast, by End-user Industry 2020 & 2033
- Table 4: Global Platinum Nanoparticles Market Volume K Tons Forecast, by End-user Industry 2020 & 2033
- Table 5: Global Platinum Nanoparticles Market Revenue Million Forecast, by Region 2020 & 2033
- Table 6: Global Platinum Nanoparticles Market Volume K Tons Forecast, by Region 2020 & 2033
- Table 7: Global Platinum Nanoparticles Market Revenue Million Forecast, by Product 2020 & 2033
- Table 8: Global Platinum Nanoparticles Market Volume K Tons Forecast, by Product 2020 & 2033
- Table 9: Global Platinum Nanoparticles Market Revenue Million Forecast, by End-user Industry 2020 & 2033
- Table 10: Global Platinum Nanoparticles Market Volume K Tons Forecast, by End-user Industry 2020 & 2033
- Table 11: Global Platinum Nanoparticles Market Revenue Million Forecast, by Country 2020 & 2033
- Table 12: Global Platinum Nanoparticles Market Volume K Tons Forecast, by Country 2020 & 2033
- Table 13: China Platinum Nanoparticles Market Revenue (Million) Forecast, by Application 2020 & 2033
- Table 14: China Platinum Nanoparticles Market Volume (K Tons) Forecast, by Application 2020 & 2033
- Table 15: India Platinum Nanoparticles Market Revenue (Million) Forecast, by Application 2020 & 2033
- Table 16: India Platinum Nanoparticles Market Volume (K Tons) Forecast, by Application 2020 & 2033
- Table 17: Japan Platinum Nanoparticles Market Revenue (Million) Forecast, by Application 2020 & 2033
- Table 18: Japan Platinum Nanoparticles Market Volume (K Tons) Forecast, by Application 2020 & 2033
- Table 19: South Korea Platinum Nanoparticles Market Revenue (Million) Forecast, by Application 2020 & 2033
- Table 20: South Korea Platinum Nanoparticles Market Volume (K Tons) Forecast, by Application 2020 & 2033
- Table 21: Rest of Asia Pacific Platinum Nanoparticles Market Revenue (Million) Forecast, by Application 2020 & 2033
- Table 22: Rest of Asia Pacific Platinum Nanoparticles Market Volume (K Tons) Forecast, by Application 2020 & 2033
- Table 23: Global Platinum Nanoparticles Market Revenue Million Forecast, by Product 2020 & 2033
- Table 24: Global Platinum Nanoparticles Market Volume K Tons Forecast, by Product 2020 & 2033
- Table 25: Global Platinum Nanoparticles Market Revenue Million Forecast, by End-user Industry 2020 & 2033
- Table 26: Global Platinum Nanoparticles Market Volume K Tons Forecast, by End-user Industry 2020 & 2033
- Table 27: Global Platinum Nanoparticles Market Revenue Million Forecast, by Country 2020 & 2033
- Table 28: Global Platinum Nanoparticles Market Volume K Tons Forecast, by Country 2020 & 2033
- Table 29: United States Platinum Nanoparticles Market Revenue (Million) Forecast, by Application 2020 & 2033
- Table 30: United States Platinum Nanoparticles Market Volume (K Tons) Forecast, by Application 2020 & 2033
- Table 31: Canada Platinum Nanoparticles Market Revenue (Million) Forecast, by Application 2020 & 2033
- Table 32: Canada Platinum Nanoparticles Market Volume (K Tons) Forecast, by Application 2020 & 2033
- Table 33: Mexico Platinum Nanoparticles Market Revenue (Million) Forecast, by Application 2020 & 2033
- Table 34: Mexico Platinum Nanoparticles Market Volume (K Tons) Forecast, by Application 2020 & 2033
- Table 35: Global Platinum Nanoparticles Market Revenue Million Forecast, by Product 2020 & 2033
- Table 36: Global Platinum Nanoparticles Market Volume K Tons Forecast, by Product 2020 & 2033
- Table 37: Global Platinum Nanoparticles Market Revenue Million Forecast, by End-user Industry 2020 & 2033
- Table 38: Global Platinum Nanoparticles Market Volume K Tons Forecast, by End-user Industry 2020 & 2033
- Table 39: Global Platinum Nanoparticles Market Revenue Million Forecast, by Country 2020 & 2033
- Table 40: Global Platinum Nanoparticles Market Volume K Tons Forecast, by Country 2020 & 2033
- Table 41: Germany Platinum Nanoparticles Market Revenue (Million) Forecast, by Application 2020 & 2033
- Table 42: Germany Platinum Nanoparticles Market Volume (K Tons) Forecast, by Application 2020 & 2033
- Table 43: United Kingdom Platinum Nanoparticles Market Revenue (Million) Forecast, by Application 2020 & 2033
- Table 44: United Kingdom Platinum Nanoparticles Market Volume (K Tons) Forecast, by Application 2020 & 2033
- Table 45: France Platinum Nanoparticles Market Revenue (Million) Forecast, by Application 2020 & 2033
- Table 46: France Platinum Nanoparticles Market Volume (K Tons) Forecast, by Application 2020 & 2033
- Table 47: Italy Platinum Nanoparticles Market Revenue (Million) Forecast, by Application 2020 & 2033
- Table 48: Italy Platinum Nanoparticles Market Volume (K Tons) Forecast, by Application 2020 & 2033
- Table 49: Rest of Europe Platinum Nanoparticles Market Revenue (Million) Forecast, by Application 2020 & 2033
- Table 50: Rest of Europe Platinum Nanoparticles Market Volume (K Tons) Forecast, by Application 2020 & 2033
- Table 51: Global Platinum Nanoparticles Market Revenue Million Forecast, by Product 2020 & 2033
- Table 52: Global Platinum Nanoparticles Market Volume K Tons Forecast, by Product 2020 & 2033
- Table 53: Global Platinum Nanoparticles Market Revenue Million Forecast, by End-user Industry 2020 & 2033
- Table 54: Global Platinum Nanoparticles Market Volume K Tons Forecast, by End-user Industry 2020 & 2033
- Table 55: Global Platinum Nanoparticles Market Revenue Million Forecast, by Country 2020 & 2033
- Table 56: Global Platinum Nanoparticles Market Volume K Tons Forecast, by Country 2020 & 2033
- Table 57: Brazil Platinum Nanoparticles Market Revenue (Million) Forecast, by Application 2020 & 2033
- Table 58: Brazil Platinum Nanoparticles Market Volume (K Tons) Forecast, by Application 2020 & 2033
- Table 59: Argentina Platinum Nanoparticles Market Revenue (Million) Forecast, by Application 2020 & 2033
- Table 60: Argentina Platinum Nanoparticles Market Volume (K Tons) Forecast, by Application 2020 & 2033
- Table 61: Rest of South America Platinum Nanoparticles Market Revenue (Million) Forecast, by Application 2020 & 2033
- Table 62: Rest of South America Platinum Nanoparticles Market Volume (K Tons) Forecast, by Application 2020 & 2033
- Table 63: Global Platinum Nanoparticles Market Revenue Million Forecast, by Product 2020 & 2033
- Table 64: Global Platinum Nanoparticles Market Volume K Tons Forecast, by Product 2020 & 2033
- Table 65: Global Platinum Nanoparticles Market Revenue Million Forecast, by End-user Industry 2020 & 2033
- Table 66: Global Platinum Nanoparticles Market Volume K Tons Forecast, by End-user Industry 2020 & 2033
- Table 67: Global Platinum Nanoparticles Market Revenue Million Forecast, by Country 2020 & 2033
- Table 68: Global Platinum Nanoparticles Market Volume K Tons Forecast, by Country 2020 & 2033
- Table 69: Saudi Arabia Platinum Nanoparticles Market Revenue (Million) Forecast, by Application 2020 & 2033
- Table 70: Saudi Arabia Platinum Nanoparticles Market Volume (K Tons) Forecast, by Application 2020 & 2033
- Table 71: South Africa Platinum Nanoparticles Market Revenue (Million) Forecast, by Application 2020 & 2033
- Table 72: South Africa Platinum Nanoparticles Market Volume (K Tons) Forecast, by Application 2020 & 2033
- Table 73: Rest of Middle East and Africa Platinum Nanoparticles Market Revenue (Million) Forecast, by Application 2020 & 2033
- Table 74: Rest of Middle East and Africa Platinum Nanoparticles Market Volume (K Tons) Forecast, by Application 2020 & 2033
Frequently Asked Questions
1. What is the projected Compound Annual Growth Rate (CAGR) of the Platinum Nanoparticles Market?
The projected CAGR is approximately 6%.
2. Which companies are prominent players in the Platinum Nanoparticles Market?
Key companies in the market include US Research Nanomaterials Inc, Nanoshel LLC, American Elements, Nanocomposix, Sigma-Aldrich, NanoBio Chemicals India Pvt Ltd, TANAKA HOLDINGS Co Ltd, Nanostructured & Amorphous Materials Inc, Metrohm India Limited, HiQ-Nano s r l, Strem Chemicals Inc, PlasmaChem GmbH, Meliorum Technologies Inc, Particular GMBH, NANOCHEMAZONE.
3. What are the main segments of the Platinum Nanoparticles Market?
The market segments include Product, End-user Industry.
4. Can you provide details about the market size?
The market size is estimated to be USD 283.78 Million as of 2022.
5. What are some drivers contributing to market growth?
; Growing Health Care Industry; Other Drivers.
6. What are the notable trends driving market growth?
Health Care Segment to Dominate the Market.
7. Are there any restraints impacting market growth?
; Toxic Nature of Platinum Nanoparticles; Unfavorable Conditions in Non-medical End-user Industries Arising Due to COVID-19 Outbreak.
8. Can you provide examples of recent developments in the market?
N/A
9. What pricing options are available for accessing the report?
Pricing options include single-user, multi-user, and enterprise licenses priced at USD 4750, USD 5250, and USD 8750 respectively.
10. Is the market size provided in terms of value or volume?
The market size is provided in terms of value, measured in Million and volume, measured in K Tons.
11. Are there any specific market keywords associated with the report?
Yes, the market keyword associated with the report is "Platinum Nanoparticles Market," which aids in identifying and referencing the specific market segment covered.
12. How do I determine which pricing option suits my needs best?
The pricing options vary based on user requirements and access needs. Individual users may opt for single-user licenses, while businesses requiring broader access may choose multi-user or enterprise licenses for cost-effective access to the report.
13. Are there any additional resources or data provided in the Platinum Nanoparticles Market report?
While the report offers comprehensive insights, it's advisable to review the specific contents or supplementary materials provided to ascertain if additional resources or data are available.
14. How can I stay updated on further developments or reports in the Platinum Nanoparticles Market?
To stay informed about further developments, trends, and reports in the Platinum Nanoparticles Market, consider subscribing to industry newsletters, following relevant companies and organizations, or regularly checking reputable industry news sources and publications.
Methodology
Step 1 - Identification of Relevant Samples Size from Population Database


Step 2 - Approaches for Defining Global Market Size (Value, Volume* & Price*)

Note*: In applicable scenarios
Step 3 - Data Sources
Primary Research
- Web Analytics
- Survey Reports
- Research Institute
- Latest Research Reports
- Opinion Leaders
Secondary Research
- Annual Reports
- White Paper
- Latest Press Release
- Industry Association
- Paid Database
- Investor Presentations

Step 4 - Data Triangulation
Involves using different sources of information in order to increase the validity of a study
These sources are likely to be stakeholders in a program - participants, other researchers, program staff, other community members, and so on.
Then we put all data in single framework & apply various statistical tools to find out the dynamic on the market.
During the analysis stage, feedback from the stakeholder groups would be compared to determine areas of agreement as well as areas of divergence