

Key Insights
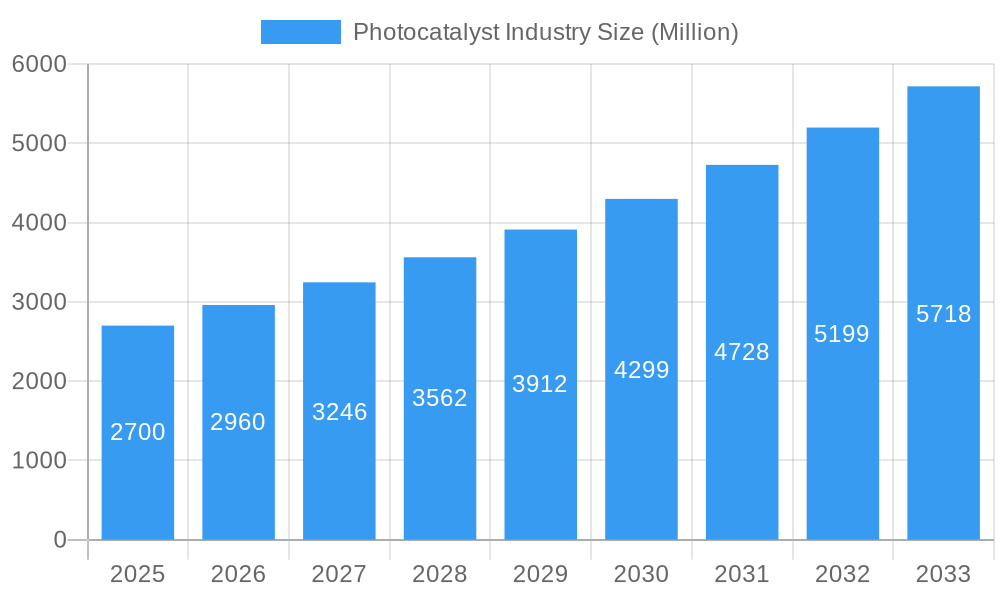
The photocatalyst market, valued at $2.70 billion in 2025, is projected to experience robust growth, driven by increasing demand for environmentally friendly solutions across various sectors. A compound annual growth rate (CAGR) of 9.68% from 2025 to 2033 signifies significant expansion opportunities. Key drivers include the rising adoption of photocatalysis in water purification, air pollution control, and self-cleaning surfaces. Growing environmental concerns and stringent regulations regarding pollution are further bolstering market growth. Technological advancements, such as the development of more efficient and cost-effective photocatalysts, are also contributing to market expansion. While data on specific market segments is unavailable, it's reasonable to assume strong growth in segments like titanium dioxide-based photocatalysts due to their wide applications and established market presence. Furthermore, the emergence of novel materials and innovative applications in areas such as self-healing materials and energy generation is likely to shape future market dynamics. The competitive landscape is characterized by a mix of established players like Daicel Miraizu Ltd, Kronos Worldwide Inc., and Showa Denko KK, and emerging companies developing innovative photocatalyst technologies. Geographical expansion into developing economies with growing infrastructure projects and increasing environmental awareness will also contribute to market growth.
Photocatalyst Industry Market Size (In Billion)
The forecast period of 2025-2033 presents a significant opportunity for market players to capitalize on this burgeoning market. However, challenges such as high initial investment costs for implementing photocatalytic technologies and potential limitations in scalability could act as restraints. Nevertheless, ongoing research and development efforts focused on improving efficiency, reducing costs, and expanding applications are likely to overcome these obstacles and drive substantial market expansion in the coming years. The market’s sustained growth is poised to be fueled by increasing government initiatives promoting sustainable technologies, a growing focus on improving air and water quality, and the ever-increasing awareness of environmental sustainability across the globe. This creates a positive outlook for the future of the photocatalyst industry.
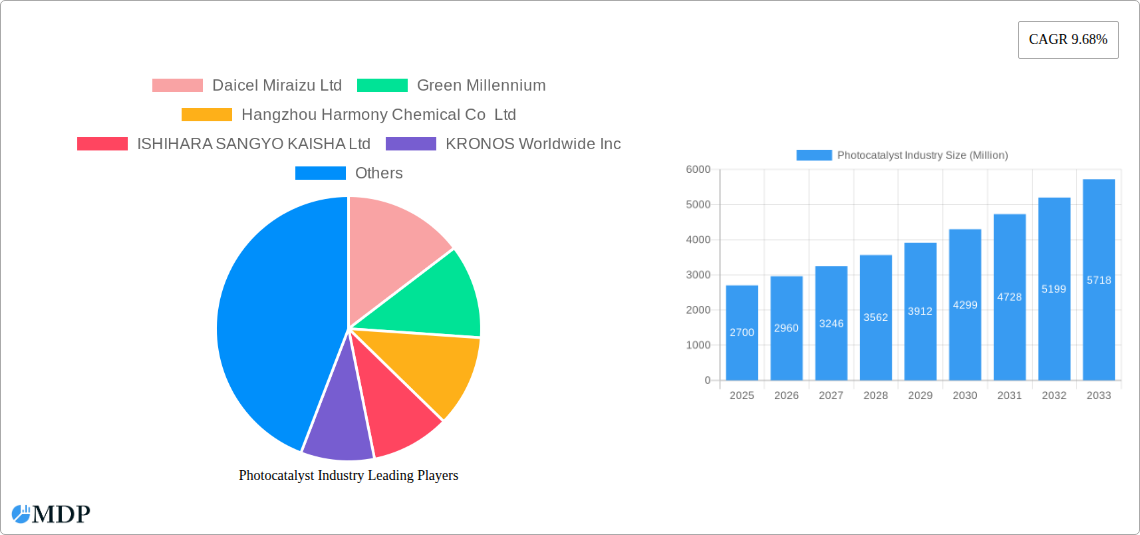
Photocatalyst Industry Company Market Share
Photocatalyst Industry Report: 2019-2033 Market Analysis and Forecast
Dive deep into the dynamic Photocatalyst Industry with this comprehensive report, providing actionable insights for strategic decision-making. This in-depth analysis covers market size, growth drivers, competitive landscape, and future opportunities, offering a crucial resource for industry stakeholders, investors, and researchers. The report utilizes data from 2019-2024 (Historical Period), with a base year of 2025 and a forecast period extending to 2033 (Forecast Period: 2025-2033). The Estimated Year is 2025. The global market value is projected to reach xx Million by 2033.
Photocatalyst Industry Market Dynamics & Concentration
The Photocatalyst industry, valued at xx Million in 2025, is characterized by moderate concentration, with several key players commanding significant market share. Market leaders such as KRONOS Worldwide Inc, Tronox Holdings PLC, and Venator Materials PLC contribute to a competitive yet established landscape. Innovation, particularly in TiO2 formulations and application-specific photocatalysts, is a key driver. Stringent environmental regulations, particularly concerning VOC emissions and air purification, are shaping market trends. Product substitutes, such as traditional chemical treatments and UV sterilization, face competition from the photocatalyst's efficiency and sustainability aspects. End-user trends are increasingly favoring environmentally friendly solutions, particularly in construction and water treatment. M&A activities in the sector have been moderate, with xx major deals recorded between 2019 and 2024, indicating strategic consolidation and expansion efforts by major players.
- Market Concentration: Moderate, with a top 5 players controlling approximately xx% market share.
- Innovation Drivers: Improved TiO2 formulations, novel photocatalyst materials, application-specific designs.
- Regulatory Frameworks: Stringent environmental regulations driving adoption in air and water purification.
- Product Substitutes: Traditional chemical treatments, UV sterilization, facing increasing competition.
- End-User Trends: Growing demand for sustainable and efficient solutions in construction, water treatment, and self-cleaning surfaces.
- M&A Activities: xx major mergers and acquisitions recorded between 2019 and 2024.
Photocatalyst Industry Industry Trends & Analysis
The Photocatalyst industry exhibits a robust CAGR of xx% during the forecast period (2025-2033), fueled by rising environmental concerns and the increasing demand for sustainable technologies. Technological advancements, such as the development of highly efficient photocatalysts with enhanced stability and durability, are driving market expansion. Consumer preferences are shifting towards eco-friendly products, leading to increased demand for self-cleaning surfaces and air/water purification systems. The market penetration of photocatalysts in various applications continues to grow, with significant opportunities in construction, textiles, and automotive sectors. The competitive landscape is characterized by both established players and emerging companies focusing on niche applications and innovative materials.
Leading Markets & Segments in Photocatalyst Industry
The Asia-Pacific region dominates the Photocatalyst market, driven by rapid industrialization, increasing environmental awareness, and supportive government policies promoting sustainable technologies. China, in particular, is a major market, fueled by substantial infrastructure investments and high demand for air and water purification solutions. Japan and South Korea also contribute significantly to the regional market growth.
- Key Drivers in Asia-Pacific:
- Rapid industrialization and urbanization.
- Growing environmental awareness and stringent regulations.
- Significant government investment in infrastructure development and green technologies.
- High demand for air and water purification systems.
- Dominance Analysis: Asia-Pacific's dominance stems from its large population, rapid economic growth, and proactive government support for sustainable solutions.
Photocatalyst Industry Product Developments
Recent advancements in the photocatalyst industry are revolutionizing product development, with a significant focus on enhancing efficiency, durability, and cost-effectiveness. Innovations are centered around the creation of next-generation titanium dioxide (TiO2) materials, engineered for superior light absorption across a broader spectrum and improved charge separation, which are critical for maximizing catalytic activity. Alongside advancements in TiO2, the exploration of alternative semiconductor materials, such as perovskites and metal-organic frameworks (MOFs), is opening up new avenues for performance and application diversity. These groundbreaking developments are not only expanding the existing market penetration of photocatalysts in established areas like self-cleaning coatings, advanced air purification systems, and high-performance water treatment technologies but also enabling novel applications in areas such as CO2 reduction and organic synthesis. Furthermore, a strong emphasis on environmentally friendly and sustainable manufacturing processes is becoming a key differentiator, enhancing the competitive advantage and market appeal of photocatalyst products as industries increasingly prioritize green solutions.
Key Drivers of Photocatalyst Industry Growth
The robust growth of the photocatalyst industry is propelled by a confluence of powerful factors. At the forefront are continuous technological advancements in catalyst materials, leading to demonstrably enhanced efficiency and cost-effectiveness, making these solutions more accessible and attractive for widespread adoption. The global implementation of stringent environmental regulations worldwide is a significant catalyst, compelling industries to seek cleaner, more sustainable technologies, thereby directly boosting the demand for photocatalytic solutions. Moreover, the overarching increasing focus on sustainable and environmentally friendly solutions across a multitude of industries, from construction and automotive to textiles and energy, is a fundamental driver of market expansion. The rising disposable incomes in developing economies, coupled with a growing global heightened environmental awareness among consumers and businesses alike, further solidifies and strengthens the trajectory of market growth for photocatalytic applications.
Challenges in the Photocatalyst Industry Market
Despite its promising growth, the photocatalyst industry navigates several significant challenges. The high initial investment costs associated with implementing and integrating photocatalytic technologies can be a substantial barrier for some potential adopters, particularly small and medium-sized enterprises. Fluctuations and potential supply chain disruptions can impact the consistent availability and price volatility of essential raw materials, affecting production timelines and cost predictability. Intense competition from both established global players and agile emerging startups creates ongoing pressure on pricing strategies and profit margins across the sector. Additionally, the absence of consistent standardization and comprehensive regulatory frameworks in certain regions can introduce uncertainty and potentially hinder broader market penetration and the seamless adoption of photocatalytic solutions. Addressing these factors is crucial for unlocking the full market potential.
Emerging Opportunities in Photocatalyst Industry
The long-term growth of the Photocatalyst industry hinges on several emerging opportunities. Technological breakthroughs, such as the development of more efficient and cost-effective photocatalyst materials, offer significant potential. Strategic partnerships between material suppliers, technology developers, and end-users are crucial for market expansion. Market expansion into new and emerging applications, particularly in the renewable energy sector, is expected to provide additional growth avenues.
Leading Players in the Photocatalyst Industry Sector
- Daicel Miraizu Ltd
- Green Millennium
- Hangzhou Harmony Chemical Co Ltd
- ISHIHARA SANGYO KAISHA Ltd
- KRONOS Worldwide Inc
- Lomon Billions
- Nanoptek Corp
- SHOWA DENKO KK
- TAYCA
- The Chemours Company
- TitanPE Technologies Inc
- Tronox Holdings PLC
- Venator Materials PLC
- *List Not Exhaustive
Key Milestones in Photocatalyst Industry Industry
- September 2022: Venator secured an ECO PASSPORT by OEKO-TEX for its fiber anatase titanium dioxide (TiO2), marking a significant advancement in textile industry sustainability.
- March 2022: Tronox Holdings plc signed a long-term power purchase agreement with SOLA Group, committing to sustainable energy practices and reducing its carbon footprint. This signals a growing trend of sustainability within the industry.
Strategic Outlook for Photocatalyst Industry Market
The strategic outlook for the photocatalyst industry market is exceptionally promising, indicating a future characterized by substantial growth and innovation. The continuation of cutting-edge technological advancements in material science, coupled with a global surge in environmental consciousness and the implementation of supportive government policies and incentives, are poised to drive significant market expansion. Strategic partnerships, research collaborations, and cross-industry alliances will be paramount for expanding market reach, fostering technological synergy, and accelerating the widespread adoption of photocatalytic solutions. Proactive exploration of new and emerging applications, such as in advanced healthcare, sustainable energy generation, and environmental remediation, alongside dedicated efforts to address existing market challenges through innovation and standardization, will be critical in unlocking further robust growth opportunities and ensuring a substantial and sustained market expansion in the coming years.
Photocatalyst Industry Segmentation
-
1. Type
- 1.1. Titanium dioxide
- 1.2. Zinc Oxide
- 1.3. Other Types
-
2. Application
- 2.1. Self-Cleaning
- 2.2. Air Purification
- 2.3. Water Treatment
- 2.4. Anti-Fogging
- 2.5. Other Applications
Photocatalyst Industry Segmentation By Geography
-
1. Asia Pacific
- 1.1. China
- 1.2. India
- 1.3. Japan
- 1.4. South Korea
- 1.5. Rest of Asia Pacific
-
2. North America
- 2.1. United States
- 2.2. Canada
- 2.3. Mexico
-
3. Europe
- 3.1. Germany
- 3.2. United Kingdom
- 3.3. France
- 3.4. Italy
- 3.5. Rest of Europe
-
4. South America
- 4.1. Brazil
- 4.2. Argentina
- 4.3. Rest of South America
-
5. Middle East and Africa
- 5.1. Saudi Arabia
- 5.2. South Africa
- 5.3. Rest of Middle East and Africa
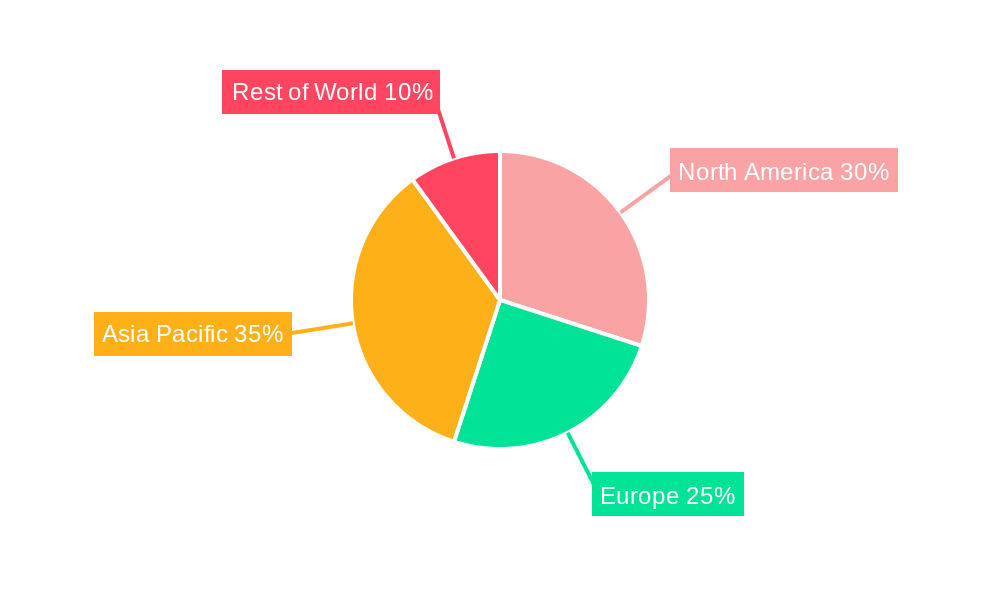
Photocatalyst Industry Regional Market Share
Geographic Coverage of Photocatalyst Industry
Photocatalyst Industry REPORT HIGHLIGHTS
| Aspects | Details |
|---|---|
| Study Period | 2020-2034 |
| Base Year | 2025 |
| Estimated Year | 2026 |
| Forecast Period | 2026-2034 |
| Historical Period | 2020-2025 |
| Growth Rate | CAGR of 9.68% from 2020-2034 |
| Segmentation |
|
Table of Contents
- 1. Introduction
- 1.1. Research Scope
- 1.2. Market Segmentation
- 1.3. Research Objective
- 1.4. Definitions and Assumptions
- 2. Executive Summary
- 2.1. Market Snapshot
- 3. Market Dynamics
- 3.1. Market Drivers
- 3.2. Market Restrains
- 3.3. Market Trends
- 3.4. Market Opportunities
- 4. Market Factor Analysis
- 4.1. Porters Five Forces
- 4.1.1. Bargaining Power of Suppliers
- 4.1.2. Bargaining Power of Buyers
- 4.1.3. Threat of New Entrants
- 4.1.4. Threat of Substitutes
- 4.1.5. Competitive Rivalry
- 4.2. PESTEL analysis
- 4.3. BCG Analysis
- 4.3.1. Stars (High Growth, High Market Share)
- 4.3.2. Cash Cows (Low Growth, High Market Share)
- 4.3.3. Question Mark (High Growth, Low Market Share)
- 4.3.4. Dogs (Low Growth, Low Market Share)
- 4.4. Ansoff Matrix Analysis
- 4.5. Supply Chain Analysis
- 4.6. Regulatory Landscape
- 4.7. Current Market Potential and Opportunity Assessment (TAM–SAM–SOM Framework)
- 4.8. MDP Analyst Note
- 4.1. Porters Five Forces
- 5. Market Analysis, Insights and Forecast 2021-2033
- 5.1. Market Analysis, Insights and Forecast - by Type
- 5.1.1. Titanium dioxide
- 5.1.2. Zinc Oxide
- 5.1.3. Other Types
- 5.2. Market Analysis, Insights and Forecast - by Application
- 5.2.1. Self-Cleaning
- 5.2.2. Air Purification
- 5.2.3. Water Treatment
- 5.2.4. Anti-Fogging
- 5.2.5. Other Applications
- 5.3. Market Analysis, Insights and Forecast - by Region
- 5.3.1. Asia Pacific
- 5.3.2. North America
- 5.3.3. Europe
- 5.3.4. South America
- 5.3.5. Middle East and Africa
- 5.1. Market Analysis, Insights and Forecast - by Type
- 6. Global Photocatalyst Industry Analysis, Insights and Forecast, 2021-2033
- 6.1. Market Analysis, Insights and Forecast - by Type
- 6.1.1. Titanium dioxide
- 6.1.2. Zinc Oxide
- 6.1.3. Other Types
- 6.2. Market Analysis, Insights and Forecast - by Application
- 6.2.1. Self-Cleaning
- 6.2.2. Air Purification
- 6.2.3. Water Treatment
- 6.2.4. Anti-Fogging
- 6.2.5. Other Applications
- 6.1. Market Analysis, Insights and Forecast - by Type
- 7. Asia Pacific Photocatalyst Industry Analysis, Insights and Forecast, 2020-2032
- 7.1. Market Analysis, Insights and Forecast - by Type
- 7.1.1. Titanium dioxide
- 7.1.2. Zinc Oxide
- 7.1.3. Other Types
- 7.2. Market Analysis, Insights and Forecast - by Application
- 7.2.1. Self-Cleaning
- 7.2.2. Air Purification
- 7.2.3. Water Treatment
- 7.2.4. Anti-Fogging
- 7.2.5. Other Applications
- 7.1. Market Analysis, Insights and Forecast - by Type
- 8. North America Photocatalyst Industry Analysis, Insights and Forecast, 2020-2032
- 8.1. Market Analysis, Insights and Forecast - by Type
- 8.1.1. Titanium dioxide
- 8.1.2. Zinc Oxide
- 8.1.3. Other Types
- 8.2. Market Analysis, Insights and Forecast - by Application
- 8.2.1. Self-Cleaning
- 8.2.2. Air Purification
- 8.2.3. Water Treatment
- 8.2.4. Anti-Fogging
- 8.2.5. Other Applications
- 8.1. Market Analysis, Insights and Forecast - by Type
- 9. Europe Photocatalyst Industry Analysis, Insights and Forecast, 2020-2032
- 9.1. Market Analysis, Insights and Forecast - by Type
- 9.1.1. Titanium dioxide
- 9.1.2. Zinc Oxide
- 9.1.3. Other Types
- 9.2. Market Analysis, Insights and Forecast - by Application
- 9.2.1. Self-Cleaning
- 9.2.2. Air Purification
- 9.2.3. Water Treatment
- 9.2.4. Anti-Fogging
- 9.2.5. Other Applications
- 9.1. Market Analysis, Insights and Forecast - by Type
- 10. South America Photocatalyst Industry Analysis, Insights and Forecast, 2020-2032
- 10.1. Market Analysis, Insights and Forecast - by Type
- 10.1.1. Titanium dioxide
- 10.1.2. Zinc Oxide
- 10.1.3. Other Types
- 10.2. Market Analysis, Insights and Forecast - by Application
- 10.2.1. Self-Cleaning
- 10.2.2. Air Purification
- 10.2.3. Water Treatment
- 10.2.4. Anti-Fogging
- 10.2.5. Other Applications
- 10.1. Market Analysis, Insights and Forecast - by Type
- 11. Middle East and Africa Photocatalyst Industry Analysis, Insights and Forecast, 2020-2032
- 11.1. Market Analysis, Insights and Forecast - by Type
- 11.1.1. Titanium dioxide
- 11.1.2. Zinc Oxide
- 11.1.3. Other Types
- 11.2. Market Analysis, Insights and Forecast - by Application
- 11.2.1. Self-Cleaning
- 11.2.2. Air Purification
- 11.2.3. Water Treatment
- 11.2.4. Anti-Fogging
- 11.2.5. Other Applications
- 11.1. Market Analysis, Insights and Forecast - by Type
- 12. Competitive Analysis
- 12.1. Company Profiles
- 12.1.1 Daicel Miraizu Ltd
- 12.1.1.1. Company Overview
- 12.1.1.2. Products
- 12.1.1.3. Company Financials
- 12.1.1.4. SWOT Analysis
- 12.1.2 Green Millennium
- 12.1.2.1. Company Overview
- 12.1.2.2. Products
- 12.1.2.3. Company Financials
- 12.1.2.4. SWOT Analysis
- 12.1.3 Hangzhou Harmony Chemical Co Ltd
- 12.1.3.1. Company Overview
- 12.1.3.2. Products
- 12.1.3.3. Company Financials
- 12.1.3.4. SWOT Analysis
- 12.1.4 ISHIHARA SANGYO KAISHA Ltd
- 12.1.4.1. Company Overview
- 12.1.4.2. Products
- 12.1.4.3. Company Financials
- 12.1.4.4. SWOT Analysis
- 12.1.5 KRONOS Worldwide Inc
- 12.1.5.1. Company Overview
- 12.1.5.2. Products
- 12.1.5.3. Company Financials
- 12.1.5.4. SWOT Analysis
- 12.1.6 Lomon Billions
- 12.1.6.1. Company Overview
- 12.1.6.2. Products
- 12.1.6.3. Company Financials
- 12.1.6.4. SWOT Analysis
- 12.1.7 Nanoptek Corp
- 12.1.7.1. Company Overview
- 12.1.7.2. Products
- 12.1.7.3. Company Financials
- 12.1.7.4. SWOT Analysis
- 12.1.8 SHOWA DENKO KK
- 12.1.8.1. Company Overview
- 12.1.8.2. Products
- 12.1.8.3. Company Financials
- 12.1.8.4. SWOT Analysis
- 12.1.9 TAYCA
- 12.1.9.1. Company Overview
- 12.1.9.2. Products
- 12.1.9.3. Company Financials
- 12.1.9.4. SWOT Analysis
- 12.1.10 The Chemours Company
- 12.1.10.1. Company Overview
- 12.1.10.2. Products
- 12.1.10.3. Company Financials
- 12.1.10.4. SWOT Analysis
- 12.1.11 TitanPE Technologies Inc
- 12.1.11.1. Company Overview
- 12.1.11.2. Products
- 12.1.11.3. Company Financials
- 12.1.11.4. SWOT Analysis
- 12.1.12 Tronox Holdings PLC
- 12.1.12.1. Company Overview
- 12.1.12.2. Products
- 12.1.12.3. Company Financials
- 12.1.12.4. SWOT Analysis
- 12.1.13 Venator Materials PLC*List Not Exhaustive
- 12.1.13.1. Company Overview
- 12.1.13.2. Products
- 12.1.13.3. Company Financials
- 12.1.13.4. SWOT Analysis
- 12.1.1 Daicel Miraizu Ltd
- 12.2. Market Entropy
- 12.2.1 Company's Key Areas Served
- 12.2.2 Recent Developments
- 12.3. Company Market Share Analysis 2025
- 12.3.1 Top 5 Companies Market Share Analysis
- 12.3.2 Top 3 Companies Market Share Analysis
- 12.4. List of Potential Customers
- 13. Research Methodology
List of Figures
- Figure 1: Global Photocatalyst Industry Revenue Breakdown (Million, %) by Region 2025 & 2033
- Figure 2: Global Photocatalyst Industry Volume Breakdown (Billion, %) by Region 2025 & 2033
- Figure 3: Asia Pacific Photocatalyst Industry Revenue (Million), by Type 2025 & 2033
- Figure 4: Asia Pacific Photocatalyst Industry Volume (Billion), by Type 2025 & 2033
- Figure 5: Asia Pacific Photocatalyst Industry Revenue Share (%), by Type 2025 & 2033
- Figure 6: Asia Pacific Photocatalyst Industry Volume Share (%), by Type 2025 & 2033
- Figure 7: Asia Pacific Photocatalyst Industry Revenue (Million), by Application 2025 & 2033
- Figure 8: Asia Pacific Photocatalyst Industry Volume (Billion), by Application 2025 & 2033
- Figure 9: Asia Pacific Photocatalyst Industry Revenue Share (%), by Application 2025 & 2033
- Figure 10: Asia Pacific Photocatalyst Industry Volume Share (%), by Application 2025 & 2033
- Figure 11: Asia Pacific Photocatalyst Industry Revenue (Million), by Country 2025 & 2033
- Figure 12: Asia Pacific Photocatalyst Industry Volume (Billion), by Country 2025 & 2033
- Figure 13: Asia Pacific Photocatalyst Industry Revenue Share (%), by Country 2025 & 2033
- Figure 14: Asia Pacific Photocatalyst Industry Volume Share (%), by Country 2025 & 2033
- Figure 15: North America Photocatalyst Industry Revenue (Million), by Type 2025 & 2033
- Figure 16: North America Photocatalyst Industry Volume (Billion), by Type 2025 & 2033
- Figure 17: North America Photocatalyst Industry Revenue Share (%), by Type 2025 & 2033
- Figure 18: North America Photocatalyst Industry Volume Share (%), by Type 2025 & 2033
- Figure 19: North America Photocatalyst Industry Revenue (Million), by Application 2025 & 2033
- Figure 20: North America Photocatalyst Industry Volume (Billion), by Application 2025 & 2033
- Figure 21: North America Photocatalyst Industry Revenue Share (%), by Application 2025 & 2033
- Figure 22: North America Photocatalyst Industry Volume Share (%), by Application 2025 & 2033
- Figure 23: North America Photocatalyst Industry Revenue (Million), by Country 2025 & 2033
- Figure 24: North America Photocatalyst Industry Volume (Billion), by Country 2025 & 2033
- Figure 25: North America Photocatalyst Industry Revenue Share (%), by Country 2025 & 2033
- Figure 26: North America Photocatalyst Industry Volume Share (%), by Country 2025 & 2033
- Figure 27: Europe Photocatalyst Industry Revenue (Million), by Type 2025 & 2033
- Figure 28: Europe Photocatalyst Industry Volume (Billion), by Type 2025 & 2033
- Figure 29: Europe Photocatalyst Industry Revenue Share (%), by Type 2025 & 2033
- Figure 30: Europe Photocatalyst Industry Volume Share (%), by Type 2025 & 2033
- Figure 31: Europe Photocatalyst Industry Revenue (Million), by Application 2025 & 2033
- Figure 32: Europe Photocatalyst Industry Volume (Billion), by Application 2025 & 2033
- Figure 33: Europe Photocatalyst Industry Revenue Share (%), by Application 2025 & 2033
- Figure 34: Europe Photocatalyst Industry Volume Share (%), by Application 2025 & 2033
- Figure 35: Europe Photocatalyst Industry Revenue (Million), by Country 2025 & 2033
- Figure 36: Europe Photocatalyst Industry Volume (Billion), by Country 2025 & 2033
- Figure 37: Europe Photocatalyst Industry Revenue Share (%), by Country 2025 & 2033
- Figure 38: Europe Photocatalyst Industry Volume Share (%), by Country 2025 & 2033
- Figure 39: South America Photocatalyst Industry Revenue (Million), by Type 2025 & 2033
- Figure 40: South America Photocatalyst Industry Volume (Billion), by Type 2025 & 2033
- Figure 41: South America Photocatalyst Industry Revenue Share (%), by Type 2025 & 2033
- Figure 42: South America Photocatalyst Industry Volume Share (%), by Type 2025 & 2033
- Figure 43: South America Photocatalyst Industry Revenue (Million), by Application 2025 & 2033
- Figure 44: South America Photocatalyst Industry Volume (Billion), by Application 2025 & 2033
- Figure 45: South America Photocatalyst Industry Revenue Share (%), by Application 2025 & 2033
- Figure 46: South America Photocatalyst Industry Volume Share (%), by Application 2025 & 2033
- Figure 47: South America Photocatalyst Industry Revenue (Million), by Country 2025 & 2033
- Figure 48: South America Photocatalyst Industry Volume (Billion), by Country 2025 & 2033
- Figure 49: South America Photocatalyst Industry Revenue Share (%), by Country 2025 & 2033
- Figure 50: South America Photocatalyst Industry Volume Share (%), by Country 2025 & 2033
- Figure 51: Middle East and Africa Photocatalyst Industry Revenue (Million), by Type 2025 & 2033
- Figure 52: Middle East and Africa Photocatalyst Industry Volume (Billion), by Type 2025 & 2033
- Figure 53: Middle East and Africa Photocatalyst Industry Revenue Share (%), by Type 2025 & 2033
- Figure 54: Middle East and Africa Photocatalyst Industry Volume Share (%), by Type 2025 & 2033
- Figure 55: Middle East and Africa Photocatalyst Industry Revenue (Million), by Application 2025 & 2033
- Figure 56: Middle East and Africa Photocatalyst Industry Volume (Billion), by Application 2025 & 2033
- Figure 57: Middle East and Africa Photocatalyst Industry Revenue Share (%), by Application 2025 & 2033
- Figure 58: Middle East and Africa Photocatalyst Industry Volume Share (%), by Application 2025 & 2033
- Figure 59: Middle East and Africa Photocatalyst Industry Revenue (Million), by Country 2025 & 2033
- Figure 60: Middle East and Africa Photocatalyst Industry Volume (Billion), by Country 2025 & 2033
- Figure 61: Middle East and Africa Photocatalyst Industry Revenue Share (%), by Country 2025 & 2033
- Figure 62: Middle East and Africa Photocatalyst Industry Volume Share (%), by Country 2025 & 2033
List of Tables
- Table 1: Global Photocatalyst Industry Revenue Million Forecast, by Type 2020 & 2033
- Table 2: Global Photocatalyst Industry Volume Billion Forecast, by Type 2020 & 2033
- Table 3: Global Photocatalyst Industry Revenue Million Forecast, by Application 2020 & 2033
- Table 4: Global Photocatalyst Industry Volume Billion Forecast, by Application 2020 & 2033
- Table 5: Global Photocatalyst Industry Revenue Million Forecast, by Region 2020 & 2033
- Table 6: Global Photocatalyst Industry Volume Billion Forecast, by Region 2020 & 2033
- Table 7: Global Photocatalyst Industry Revenue Million Forecast, by Type 2020 & 2033
- Table 8: Global Photocatalyst Industry Volume Billion Forecast, by Type 2020 & 2033
- Table 9: Global Photocatalyst Industry Revenue Million Forecast, by Application 2020 & 2033
- Table 10: Global Photocatalyst Industry Volume Billion Forecast, by Application 2020 & 2033
- Table 11: Global Photocatalyst Industry Revenue Million Forecast, by Country 2020 & 2033
- Table 12: Global Photocatalyst Industry Volume Billion Forecast, by Country 2020 & 2033
- Table 13: China Photocatalyst Industry Revenue (Million) Forecast, by Application 2020 & 2033
- Table 14: China Photocatalyst Industry Volume (Billion) Forecast, by Application 2020 & 2033
- Table 15: India Photocatalyst Industry Revenue (Million) Forecast, by Application 2020 & 2033
- Table 16: India Photocatalyst Industry Volume (Billion) Forecast, by Application 2020 & 2033
- Table 17: Japan Photocatalyst Industry Revenue (Million) Forecast, by Application 2020 & 2033
- Table 18: Japan Photocatalyst Industry Volume (Billion) Forecast, by Application 2020 & 2033
- Table 19: South Korea Photocatalyst Industry Revenue (Million) Forecast, by Application 2020 & 2033
- Table 20: South Korea Photocatalyst Industry Volume (Billion) Forecast, by Application 2020 & 2033
- Table 21: Rest of Asia Pacific Photocatalyst Industry Revenue (Million) Forecast, by Application 2020 & 2033
- Table 22: Rest of Asia Pacific Photocatalyst Industry Volume (Billion) Forecast, by Application 2020 & 2033
- Table 23: Global Photocatalyst Industry Revenue Million Forecast, by Type 2020 & 2033
- Table 24: Global Photocatalyst Industry Volume Billion Forecast, by Type 2020 & 2033
- Table 25: Global Photocatalyst Industry Revenue Million Forecast, by Application 2020 & 2033
- Table 26: Global Photocatalyst Industry Volume Billion Forecast, by Application 2020 & 2033
- Table 27: Global Photocatalyst Industry Revenue Million Forecast, by Country 2020 & 2033
- Table 28: Global Photocatalyst Industry Volume Billion Forecast, by Country 2020 & 2033
- Table 29: United States Photocatalyst Industry Revenue (Million) Forecast, by Application 2020 & 2033
- Table 30: United States Photocatalyst Industry Volume (Billion) Forecast, by Application 2020 & 2033
- Table 31: Canada Photocatalyst Industry Revenue (Million) Forecast, by Application 2020 & 2033
- Table 32: Canada Photocatalyst Industry Volume (Billion) Forecast, by Application 2020 & 2033
- Table 33: Mexico Photocatalyst Industry Revenue (Million) Forecast, by Application 2020 & 2033
- Table 34: Mexico Photocatalyst Industry Volume (Billion) Forecast, by Application 2020 & 2033
- Table 35: Global Photocatalyst Industry Revenue Million Forecast, by Type 2020 & 2033
- Table 36: Global Photocatalyst Industry Volume Billion Forecast, by Type 2020 & 2033
- Table 37: Global Photocatalyst Industry Revenue Million Forecast, by Application 2020 & 2033
- Table 38: Global Photocatalyst Industry Volume Billion Forecast, by Application 2020 & 2033
- Table 39: Global Photocatalyst Industry Revenue Million Forecast, by Country 2020 & 2033
- Table 40: Global Photocatalyst Industry Volume Billion Forecast, by Country 2020 & 2033
- Table 41: Germany Photocatalyst Industry Revenue (Million) Forecast, by Application 2020 & 2033
- Table 42: Germany Photocatalyst Industry Volume (Billion) Forecast, by Application 2020 & 2033
- Table 43: United Kingdom Photocatalyst Industry Revenue (Million) Forecast, by Application 2020 & 2033
- Table 44: United Kingdom Photocatalyst Industry Volume (Billion) Forecast, by Application 2020 & 2033
- Table 45: France Photocatalyst Industry Revenue (Million) Forecast, by Application 2020 & 2033
- Table 46: France Photocatalyst Industry Volume (Billion) Forecast, by Application 2020 & 2033
- Table 47: Italy Photocatalyst Industry Revenue (Million) Forecast, by Application 2020 & 2033
- Table 48: Italy Photocatalyst Industry Volume (Billion) Forecast, by Application 2020 & 2033
- Table 49: Rest of Europe Photocatalyst Industry Revenue (Million) Forecast, by Application 2020 & 2033
- Table 50: Rest of Europe Photocatalyst Industry Volume (Billion) Forecast, by Application 2020 & 2033
- Table 51: Global Photocatalyst Industry Revenue Million Forecast, by Type 2020 & 2033
- Table 52: Global Photocatalyst Industry Volume Billion Forecast, by Type 2020 & 2033
- Table 53: Global Photocatalyst Industry Revenue Million Forecast, by Application 2020 & 2033
- Table 54: Global Photocatalyst Industry Volume Billion Forecast, by Application 2020 & 2033
- Table 55: Global Photocatalyst Industry Revenue Million Forecast, by Country 2020 & 2033
- Table 56: Global Photocatalyst Industry Volume Billion Forecast, by Country 2020 & 2033
- Table 57: Brazil Photocatalyst Industry Revenue (Million) Forecast, by Application 2020 & 2033
- Table 58: Brazil Photocatalyst Industry Volume (Billion) Forecast, by Application 2020 & 2033
- Table 59: Argentina Photocatalyst Industry Revenue (Million) Forecast, by Application 2020 & 2033
- Table 60: Argentina Photocatalyst Industry Volume (Billion) Forecast, by Application 2020 & 2033
- Table 61: Rest of South America Photocatalyst Industry Revenue (Million) Forecast, by Application 2020 & 2033
- Table 62: Rest of South America Photocatalyst Industry Volume (Billion) Forecast, by Application 2020 & 2033
- Table 63: Global Photocatalyst Industry Revenue Million Forecast, by Type 2020 & 2033
- Table 64: Global Photocatalyst Industry Volume Billion Forecast, by Type 2020 & 2033
- Table 65: Global Photocatalyst Industry Revenue Million Forecast, by Application 2020 & 2033
- Table 66: Global Photocatalyst Industry Volume Billion Forecast, by Application 2020 & 2033
- Table 67: Global Photocatalyst Industry Revenue Million Forecast, by Country 2020 & 2033
- Table 68: Global Photocatalyst Industry Volume Billion Forecast, by Country 2020 & 2033
- Table 69: Saudi Arabia Photocatalyst Industry Revenue (Million) Forecast, by Application 2020 & 2033
- Table 70: Saudi Arabia Photocatalyst Industry Volume (Billion) Forecast, by Application 2020 & 2033
- Table 71: South Africa Photocatalyst Industry Revenue (Million) Forecast, by Application 2020 & 2033
- Table 72: South Africa Photocatalyst Industry Volume (Billion) Forecast, by Application 2020 & 2033
- Table 73: Rest of Middle East and Africa Photocatalyst Industry Revenue (Million) Forecast, by Application 2020 & 2033
- Table 74: Rest of Middle East and Africa Photocatalyst Industry Volume (Billion) Forecast, by Application 2020 & 2033
Frequently Asked Questions
1. What is the projected Compound Annual Growth Rate (CAGR) of the Photocatalyst Industry?
The projected CAGR is approximately 9.68%.
2. Which companies are prominent players in the Photocatalyst Industry?
Key companies in the market include Daicel Miraizu Ltd, Green Millennium, Hangzhou Harmony Chemical Co Ltd, ISHIHARA SANGYO KAISHA Ltd, KRONOS Worldwide Inc, Lomon Billions, Nanoptek Corp, SHOWA DENKO KK, TAYCA, The Chemours Company, TitanPE Technologies Inc, Tronox Holdings PLC, Venator Materials PLC*List Not Exhaustive.
3. What are the main segments of the Photocatalyst Industry?
The market segments include Type, Application.
4. Can you provide details about the market size?
The market size is estimated to be USD 2.70 Million as of 2022.
5. What are some drivers contributing to market growth?
Rapidly Growing Demand for Titanium dioxide; Increasing Applications in Water Treatment and Air Purification.
6. What are the notable trends driving market growth?
Increasing Demand from Self Cleaning Application.
7. Are there any restraints impacting market growth?
Rapidly Growing Demand for Titanium dioxide; Increasing Applications in Water Treatment and Air Purification.
8. Can you provide examples of recent developments in the market?
September 2022: Venator has become the first manufacturer and supplier of fiber anatase titanium dioxide (TiO2) to the textile industry to secure an ECO PASSPORT by OEKO-TEX.
9. What pricing options are available for accessing the report?
Pricing options include single-user, multi-user, and enterprise licenses priced at USD 4750, USD 5250, and USD 8750 respectively.
10. Is the market size provided in terms of value or volume?
The market size is provided in terms of value, measured in Million and volume, measured in Billion.
11. Are there any specific market keywords associated with the report?
Yes, the market keyword associated with the report is "Photocatalyst Industry," which aids in identifying and referencing the specific market segment covered.
12. How do I determine which pricing option suits my needs best?
The pricing options vary based on user requirements and access needs. Individual users may opt for single-user licenses, while businesses requiring broader access may choose multi-user or enterprise licenses for cost-effective access to the report.
13. Are there any additional resources or data provided in the Photocatalyst Industry report?
While the report offers comprehensive insights, it's advisable to review the specific contents or supplementary materials provided to ascertain if additional resources or data are available.
14. How can I stay updated on further developments or reports in the Photocatalyst Industry?
To stay informed about further developments, trends, and reports in the Photocatalyst Industry, consider subscribing to industry newsletters, following relevant companies and organizations, or regularly checking reputable industry news sources and publications.
Methodology
Step 1 - Identification of Relevant Samples Size from Population Database


Step 2 - Approaches for Defining Global Market Size (Value, Volume* & Price*)

Note*: In applicable scenarios
Step 3 - Data Sources
Primary Research
- Web Analytics
- Survey Reports
- Research Institute
- Latest Research Reports
- Opinion Leaders
Secondary Research
- Annual Reports
- White Paper
- Latest Press Release
- Industry Association
- Paid Database
- Investor Presentations

Step 4 - Data Triangulation
Involves using different sources of information in order to increase the validity of a study
These sources are likely to be stakeholders in a program - participants, other researchers, program staff, other community members, and so on.
Then we put all data in single framework & apply various statistical tools to find out the dynamic on the market.
During the analysis stage, feedback from the stakeholder groups would be compared to determine areas of agreement as well as areas of divergence