

Key Insights
The global phosphorescent pigments market is poised for significant expansion, driven by escalating demand across key industries. Projections indicate a Compound Annual Growth Rate (CAGR) of 15.73%, propelling the market size to an estimated 6.88 billion by 2025. Key growth catalysts include the increasing integration of phosphorescent pigments in safety applications, such as illuminated signage and high-visibility apparel, where enhanced luminescence is paramount. The burgeoning plastics sector, particularly in packaging and consumer goods, also contributes substantially, with manufacturers leveraging these pigments for both aesthetic enhancement and functional properties. Furthermore, the paints and coatings industry actively adopts phosphorescent pigments for decorative and specialized functional finishes. While challenges such as the cost of certain pigment types and environmental considerations persist, ongoing research and development are yielding more economical and eco-friendly alternatives. Market segmentation reveals zinc sulfide and strontium aluminate as leading pigment types, with paints & coatings dominating the application landscape. Robust growth is anticipated across North America, Europe, and Asia Pacific, fueled by rapid industrialization and rising consumer expenditure. The competitive environment is characterized by a blend of established industry leaders and innovative new entrants. Advancements in pigment technology, particularly in developing pigments with extended luminescence and superior brightness, will be instrumental in shaping the market's future.
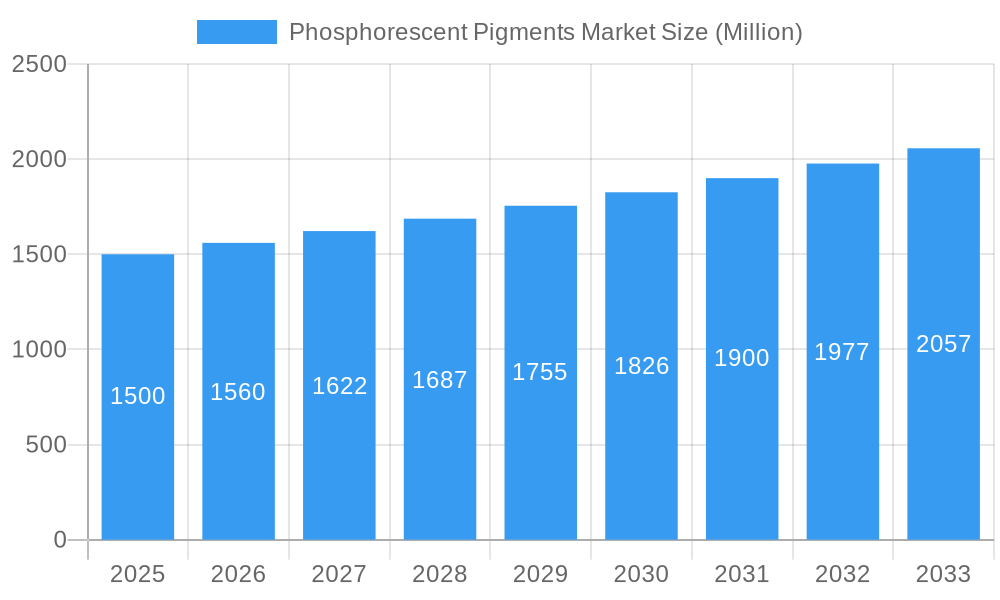
Phosphorescent Pigments Market Market Size (In Billion)
The outlook for the phosphorescent pigments market remains highly positive, with sustained growth anticipated through 2033. Technological innovation, focusing on enhancing luminance, phosphorescence duration, and environmental compatibility, will be crucial for continued expansion. Strategic collaborations and mergers & acquisitions are expected to reshape the competitive dynamics and foster further innovation. A discernible trend towards more sustainable and environmentally friendly phosphorescent pigment solutions is emerging, driven by increasing consumer environmental awareness and regulatory mandates. Regional growth trajectories will continue to be influenced by economic development, infrastructure investments, and evolving consumer preferences in major global markets. The market's sustained upward momentum will rely on ongoing technological breakthroughs, broader adoption in emerging applications, and manufacturers' capacity to address environmental concerns while delivering cost-effective solutions.
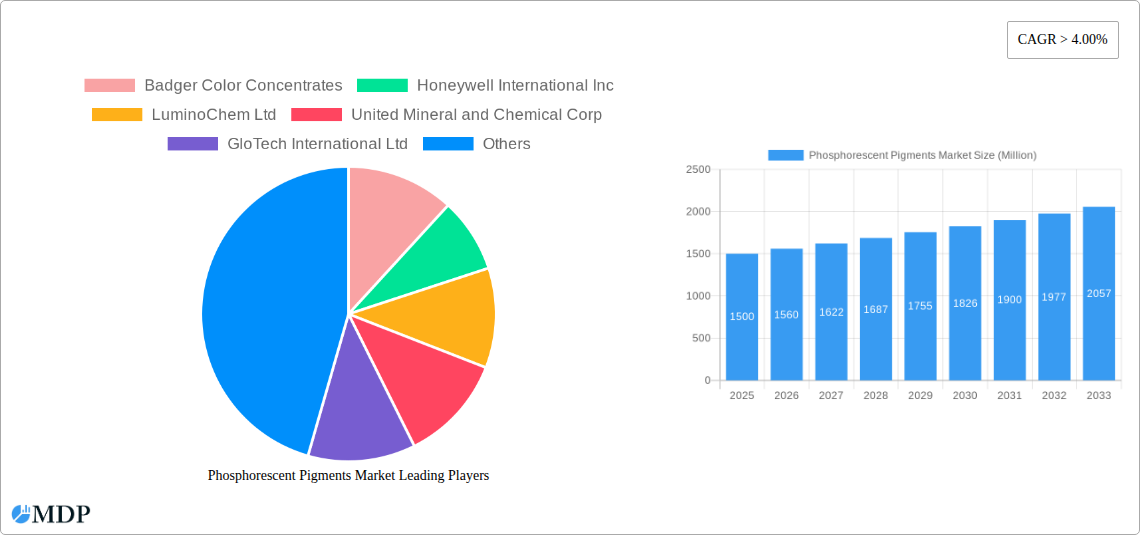
Phosphorescent Pigments Market Company Market Share
Phosphorescent Pigments Market: A Comprehensive Report (2019-2033)
This in-depth report provides a comprehensive analysis of the Phosphorescent Pigments Market, offering invaluable insights for stakeholders seeking to navigate this dynamic sector. Covering the period 2019-2033, with a focus on 2025, this report delves into market dynamics, trends, leading players, and future growth opportunities. The market is projected to reach xx Million by 2033, exhibiting a CAGR of xx% during the forecast period (2025-2033).
Phosphorescent Pigments Market Market Dynamics & Concentration
The phosphorescent pigments market is characterized by moderate concentration, with a few key players holding significant market share. Badger Color Concentrates, Honeywell International Inc, LuminoChem Ltd, United Mineral and Chemical Corp, GloTech International Ltd, Nemoto & Co Ltd, Kremer Pigmente, Nemoto Lumi-Materials Company Limited, Radiant Color NV, and Allureglow International are prominent players, collectively accounting for approximately xx% of the global market share in 2025. Innovation in pigment formulations, driven by the demand for enhanced brightness, longer persistence, and wider color palettes, is a key market driver. Stringent environmental regulations concerning heavy metal content are shaping product development and influencing market dynamics. The market also experiences competition from alternative technologies, including electroluminescent materials. M&A activity has been relatively low in recent years, with only xx major deals recorded between 2019 and 2024. End-user trends, particularly in the paints & coatings and plastics sectors, are strongly influencing market demand.
Phosphorescent Pigments Market Industry Trends & Analysis
The phosphorescent pigments market is experiencing robust growth, propelled by increasing demand from diverse end-use sectors. The rising adoption of phosphorescent pigments in safety signage, decorative applications, and consumer electronics is a major driver. Technological advancements, such as the development of new pigment formulations with enhanced performance characteristics, are further fueling market expansion. Consumer preference for innovative and aesthetically pleasing products with enhanced safety features is significantly boosting market demand. The competitive landscape is characterized by both price competition and differentiation based on product performance and application-specific formulations. The market is witnessing a shift towards eco-friendly and sustainable pigment options, driven by environmental concerns and regulatory pressures. This trend is expected to accelerate in the coming years, impacting the market share of different pigment types. The market penetration of strontium aluminate-based pigments is increasing due to their superior performance compared to zinc sulfide-based pigments.
Leading Markets & Segments in Phosphorescent Pigments Market
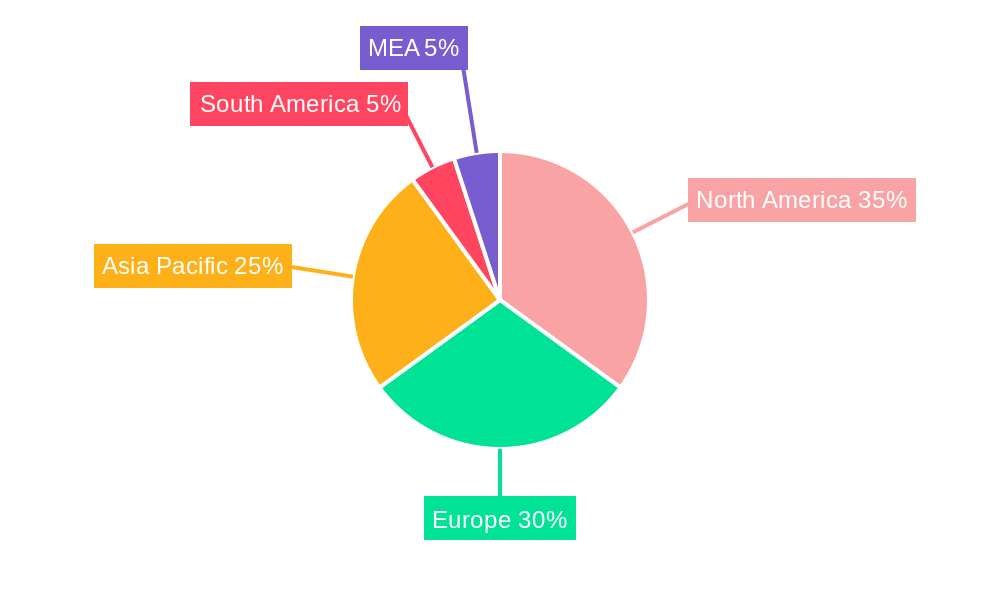
The Paints & Coatings segment currently holds the largest market share, driven by the widespread use of phosphorescent pigments in various applications, including safety markings and decorative finishes. The Asia-Pacific region is the leading market, fueled by robust economic growth, infrastructure development, and increasing demand from construction and automotive industries.
- Key Drivers in Asia-Pacific: Rapid urbanization, expanding construction sector, increasing investments in infrastructure projects, and favorable government policies.
- Key Drivers in Paints & Coatings Segment: Growing demand for safety markings, decorative applications, and functional coatings in various industries.
- Key Drivers in Strontium Aluminate Segment: Superior luminance and longer persistence compared to zinc sulfide-based pigments.
Europe and North America also represent significant markets, driven by stringent safety regulations and a preference for high-performance materials. The demand for phosphorescent pigments in the plastics and printing inks segments is also showing consistent growth.
Phosphorescent Pigments Market Product Developments
Recent product developments focus on enhancing the brightness, persistence, and color range of phosphorescent pigments. Formulations with improved light resistance and stability are being introduced to meet the demands of various applications. The development of environmentally friendly pigments with reduced toxicity is a key area of innovation. These advancements are enhancing the market appeal and expanding the application range of phosphorescent pigments, leading to increased market adoption.
Key Drivers of Phosphorescent Pigments Market Growth
The market's growth is primarily driven by the increasing demand for enhanced safety and security features in various applications. Technological advancements leading to improved pigment performance and the growing adoption of phosphorescent pigments in diverse industries are also key growth drivers. Favorable government regulations and increasing investments in infrastructure projects contribute significantly to the market's expansion. The growing awareness of the benefits of using phosphorescent pigments in various fields is also a key factor in the market's growth trajectory.
Challenges in the Phosphorescent Pigments Market Market
The market faces challenges related to the high cost of production for some phosphorescent pigments, particularly those with enhanced performance characteristics. Supply chain disruptions and fluctuations in raw material prices can also impact market dynamics. The intense competition from alternative technologies and the availability of substitute materials present significant challenges. Environmental regulations concerning the use of certain chemicals in pigment production impose further constraints on the market's expansion.
Emerging Opportunities in Phosphorescent Pigments Market
The market presents significant opportunities for growth through the development of novel pigment formulations with improved performance and eco-friendly attributes. Strategic partnerships between pigment manufacturers and end-use industries can unlock new market segments. Expansion into emerging economies with growing infrastructure development offers significant potential for market expansion. Technological breakthroughs in materials science can further improve the performance characteristics of phosphorescent pigments, boosting their market penetration.
Leading Players in the Phosphorescent Pigments Market Sector
- Badger Color Concentrates
- Honeywell International Inc (Honeywell International Inc)
- LuminoChem Ltd
- United Mineral and Chemical Corp
- GloTech International Ltd
- Nemoto & Co Ltd
- Kremer Pigmente
- Nemoto Lumi-Materials Company Limited
- Radiant Color NV
- Allureglow International
Key Milestones in Phosphorescent Pigments Market Industry
- 2020: Introduction of a new strontium aluminate-based pigment with enhanced brightness by LuminoChem Ltd.
- 2022: Acquisition of a smaller pigment manufacturer by Honeywell International Inc, expanding its market reach.
- 2023: Launch of an eco-friendly zinc sulfide-based pigment by Badger Color Concentrates, addressing environmental concerns.
- 2024: Implementation of stricter environmental regulations in Europe, impacting the production of certain pigment types.
Strategic Outlook for Phosphorescent Pigments Market Market
The phosphorescent pigments market is poised for significant growth, driven by technological advancements, increasing demand from various sectors, and favorable market dynamics. Strategic investments in research and development, focusing on eco-friendly formulations and improved performance characteristics, will be crucial for success. Expanding into new geographical markets and establishing strategic partnerships with key players in the end-use industries will play a significant role in shaping the future of the market. The continued development of sustainable and high-performance products will determine the success of companies in this sector.
Phosphorescent Pigments Market Segmentation
-
1. Type
- 1.1. Zinc Sulfide
- 1.2. Strontium Aluminate
- 1.3. Other Types
-
2. Application
- 2.1. Paints & Coatings
- 2.2. Plastics
- 2.3. Printing Inks
- 2.4. Textiles
- 2.5. Other Application
Phosphorescent Pigments Market Segmentation By Geography
-
1. Asia Pacific
- 1.1. China
- 1.2. India
- 1.3. Japan
- 1.4. South Korea
- 1.5. Rest of Asia Pacific
-
2. North America
- 2.1. United States
- 2.2. Canada
- 2.3. Mexico
-
3. Europe
- 3.1. Germany
- 3.2. United Kingdom
- 3.3. Italy
- 3.4. France
- 3.5. Rest of Europe
-
4. South America
- 4.1. Brazil
- 4.2. Argentina
- 4.3. Rest of South America
- 5. Middle East
-
6. Saudi Arabia
- 6.1. South Africa
- 6.2. Rest of Middle East
Phosphorescent Pigments Market Regional Market Share
Geographic Coverage of Phosphorescent Pigments Market
Phosphorescent Pigments Market REPORT HIGHLIGHTS
| Aspects | Details |
|---|---|
| Study Period | 2020-2034 |
| Base Year | 2025 |
| Estimated Year | 2026 |
| Forecast Period | 2026-2034 |
| Historical Period | 2020-2025 |
| Growth Rate | CAGR of 15.73% from 2020-2034 |
| Segmentation |
|
Table of Contents
- 1. Introduction
- 1.1. Research Scope
- 1.2. Market Segmentation
- 1.3. Research Objective
- 1.4. Definitions and Assumptions
- 2. Executive Summary
- 2.1. Market Snapshot
- 3. Market Dynamics
- 3.1. Market Drivers
- 3.2. Market Restrains
- 3.3. Market Trends
- 3.4. Market Opportunities
- 4. Market Factor Analysis
- 4.1. Porters Five Forces
- 4.1.1. Bargaining Power of Suppliers
- 4.1.2. Bargaining Power of Buyers
- 4.1.3. Threat of New Entrants
- 4.1.4. Threat of Substitutes
- 4.1.5. Competitive Rivalry
- 4.2. PESTEL analysis
- 4.3. BCG Analysis
- 4.3.1. Stars (High Growth, High Market Share)
- 4.3.2. Cash Cows (Low Growth, High Market Share)
- 4.3.3. Question Mark (High Growth, Low Market Share)
- 4.3.4. Dogs (Low Growth, Low Market Share)
- 4.4. Ansoff Matrix Analysis
- 4.5. Supply Chain Analysis
- 4.6. Regulatory Landscape
- 4.7. Current Market Potential and Opportunity Assessment (TAM–SAM–SOM Framework)
- 4.8. MDP Analyst Note
- 4.1. Porters Five Forces
- 5. Market Analysis, Insights and Forecast 2021-2033
- 5.1. Market Analysis, Insights and Forecast - by Type
- 5.1.1. Zinc Sulfide
- 5.1.2. Strontium Aluminate
- 5.1.3. Other Types
- 5.2. Market Analysis, Insights and Forecast - by Application
- 5.2.1. Paints & Coatings
- 5.2.2. Plastics
- 5.2.3. Printing Inks
- 5.2.4. Textiles
- 5.2.5. Other Application
- 5.3. Market Analysis, Insights and Forecast - by Region
- 5.3.1. Asia Pacific
- 5.3.2. North America
- 5.3.3. Europe
- 5.3.4. South America
- 5.3.5. Middle East
- 5.3.6. Saudi Arabia
- 5.1. Market Analysis, Insights and Forecast - by Type
- 6. Global Phosphorescent Pigments Market Analysis, Insights and Forecast, 2021-2033
- 6.1. Market Analysis, Insights and Forecast - by Type
- 6.1.1. Zinc Sulfide
- 6.1.2. Strontium Aluminate
- 6.1.3. Other Types
- 6.2. Market Analysis, Insights and Forecast - by Application
- 6.2.1. Paints & Coatings
- 6.2.2. Plastics
- 6.2.3. Printing Inks
- 6.2.4. Textiles
- 6.2.5. Other Application
- 6.1. Market Analysis, Insights and Forecast - by Type
- 7. Asia Pacific Phosphorescent Pigments Market Analysis, Insights and Forecast, 2020-2032
- 7.1. Market Analysis, Insights and Forecast - by Type
- 7.1.1. Zinc Sulfide
- 7.1.2. Strontium Aluminate
- 7.1.3. Other Types
- 7.2. Market Analysis, Insights and Forecast - by Application
- 7.2.1. Paints & Coatings
- 7.2.2. Plastics
- 7.2.3. Printing Inks
- 7.2.4. Textiles
- 7.2.5. Other Application
- 7.1. Market Analysis, Insights and Forecast - by Type
- 8. North America Phosphorescent Pigments Market Analysis, Insights and Forecast, 2020-2032
- 8.1. Market Analysis, Insights and Forecast - by Type
- 8.1.1. Zinc Sulfide
- 8.1.2. Strontium Aluminate
- 8.1.3. Other Types
- 8.2. Market Analysis, Insights and Forecast - by Application
- 8.2.1. Paints & Coatings
- 8.2.2. Plastics
- 8.2.3. Printing Inks
- 8.2.4. Textiles
- 8.2.5. Other Application
- 8.1. Market Analysis, Insights and Forecast - by Type
- 9. Europe Phosphorescent Pigments Market Analysis, Insights and Forecast, 2020-2032
- 9.1. Market Analysis, Insights and Forecast - by Type
- 9.1.1. Zinc Sulfide
- 9.1.2. Strontium Aluminate
- 9.1.3. Other Types
- 9.2. Market Analysis, Insights and Forecast - by Application
- 9.2.1. Paints & Coatings
- 9.2.2. Plastics
- 9.2.3. Printing Inks
- 9.2.4. Textiles
- 9.2.5. Other Application
- 9.1. Market Analysis, Insights and Forecast - by Type
- 10. South America Phosphorescent Pigments Market Analysis, Insights and Forecast, 2020-2032
- 10.1. Market Analysis, Insights and Forecast - by Type
- 10.1.1. Zinc Sulfide
- 10.1.2. Strontium Aluminate
- 10.1.3. Other Types
- 10.2. Market Analysis, Insights and Forecast - by Application
- 10.2.1. Paints & Coatings
- 10.2.2. Plastics
- 10.2.3. Printing Inks
- 10.2.4. Textiles
- 10.2.5. Other Application
- 10.1. Market Analysis, Insights and Forecast - by Type
- 11. Middle East Phosphorescent Pigments Market Analysis, Insights and Forecast, 2020-2032
- 11.1. Market Analysis, Insights and Forecast - by Type
- 11.1.1. Zinc Sulfide
- 11.1.2. Strontium Aluminate
- 11.1.3. Other Types
- 11.2. Market Analysis, Insights and Forecast - by Application
- 11.2.1. Paints & Coatings
- 11.2.2. Plastics
- 11.2.3. Printing Inks
- 11.2.4. Textiles
- 11.2.5. Other Application
- 11.1. Market Analysis, Insights and Forecast - by Type
- 12. Saudi Arabia Phosphorescent Pigments Market Analysis, Insights and Forecast, 2020-2032
- 12.1. Market Analysis, Insights and Forecast - by Type
- 12.1.1. Zinc Sulfide
- 12.1.2. Strontium Aluminate
- 12.1.3. Other Types
- 12.2. Market Analysis, Insights and Forecast - by Application
- 12.2.1. Paints & Coatings
- 12.2.2. Plastics
- 12.2.3. Printing Inks
- 12.2.4. Textiles
- 12.2.5. Other Application
- 12.1. Market Analysis, Insights and Forecast - by Type
- 13. Competitive Analysis
- 13.1. Company Profiles
- 13.1.1 Badger Color Concentrates
- 13.1.1.1. Company Overview
- 13.1.1.2. Products
- 13.1.1.3. Company Financials
- 13.1.1.4. SWOT Analysis
- 13.1.2 Honeywell International Inc
- 13.1.2.1. Company Overview
- 13.1.2.2. Products
- 13.1.2.3. Company Financials
- 13.1.2.4. SWOT Analysis
- 13.1.3 LuminoChem Ltd
- 13.1.3.1. Company Overview
- 13.1.3.2. Products
- 13.1.3.3. Company Financials
- 13.1.3.4. SWOT Analysis
- 13.1.4 United Mineral and Chemical Corp
- 13.1.4.1. Company Overview
- 13.1.4.2. Products
- 13.1.4.3. Company Financials
- 13.1.4.4. SWOT Analysis
- 13.1.5 GloTech International Ltd
- 13.1.5.1. Company Overview
- 13.1.5.2. Products
- 13.1.5.3. Company Financials
- 13.1.5.4. SWOT Analysis
- 13.1.6 Nemoto & Co Ltd
- 13.1.6.1. Company Overview
- 13.1.6.2. Products
- 13.1.6.3. Company Financials
- 13.1.6.4. SWOT Analysis
- 13.1.7 Kremer Pigmente
- 13.1.7.1. Company Overview
- 13.1.7.2. Products
- 13.1.7.3. Company Financials
- 13.1.7.4. SWOT Analysis
- 13.1.8 Nemoto Lumi-Materials Company Limited
- 13.1.8.1. Company Overview
- 13.1.8.2. Products
- 13.1.8.3. Company Financials
- 13.1.8.4. SWOT Analysis
- 13.1.9 Radiant Color NV
- 13.1.9.1. Company Overview
- 13.1.9.2. Products
- 13.1.9.3. Company Financials
- 13.1.9.4. SWOT Analysis
- 13.1.10 Allureglow International
- 13.1.10.1. Company Overview
- 13.1.10.2. Products
- 13.1.10.3. Company Financials
- 13.1.10.4. SWOT Analysis
- 13.1.1 Badger Color Concentrates
- 13.2. Market Entropy
- 13.2.1 Company's Key Areas Served
- 13.2.2 Recent Developments
- 13.3. Company Market Share Analysis 2025
- 13.3.1 Top 5 Companies Market Share Analysis
- 13.3.2 Top 3 Companies Market Share Analysis
- 13.4. List of Potential Customers
- 14. Research Methodology
List of Figures
- Figure 1: Global Phosphorescent Pigments Market Revenue Breakdown (billion, %) by Region 2025 & 2033
- Figure 2: Global Phosphorescent Pigments Market Volume Breakdown (K Tons, %) by Region 2025 & 2033
- Figure 3: Asia Pacific Phosphorescent Pigments Market Revenue (billion), by Type 2025 & 2033
- Figure 4: Asia Pacific Phosphorescent Pigments Market Volume (K Tons), by Type 2025 & 2033
- Figure 5: Asia Pacific Phosphorescent Pigments Market Revenue Share (%), by Type 2025 & 2033
- Figure 6: Asia Pacific Phosphorescent Pigments Market Volume Share (%), by Type 2025 & 2033
- Figure 7: Asia Pacific Phosphorescent Pigments Market Revenue (billion), by Application 2025 & 2033
- Figure 8: Asia Pacific Phosphorescent Pigments Market Volume (K Tons), by Application 2025 & 2033
- Figure 9: Asia Pacific Phosphorescent Pigments Market Revenue Share (%), by Application 2025 & 2033
- Figure 10: Asia Pacific Phosphorescent Pigments Market Volume Share (%), by Application 2025 & 2033
- Figure 11: Asia Pacific Phosphorescent Pigments Market Revenue (billion), by Country 2025 & 2033
- Figure 12: Asia Pacific Phosphorescent Pigments Market Volume (K Tons), by Country 2025 & 2033
- Figure 13: Asia Pacific Phosphorescent Pigments Market Revenue Share (%), by Country 2025 & 2033
- Figure 14: Asia Pacific Phosphorescent Pigments Market Volume Share (%), by Country 2025 & 2033
- Figure 15: North America Phosphorescent Pigments Market Revenue (billion), by Type 2025 & 2033
- Figure 16: North America Phosphorescent Pigments Market Volume (K Tons), by Type 2025 & 2033
- Figure 17: North America Phosphorescent Pigments Market Revenue Share (%), by Type 2025 & 2033
- Figure 18: North America Phosphorescent Pigments Market Volume Share (%), by Type 2025 & 2033
- Figure 19: North America Phosphorescent Pigments Market Revenue (billion), by Application 2025 & 2033
- Figure 20: North America Phosphorescent Pigments Market Volume (K Tons), by Application 2025 & 2033
- Figure 21: North America Phosphorescent Pigments Market Revenue Share (%), by Application 2025 & 2033
- Figure 22: North America Phosphorescent Pigments Market Volume Share (%), by Application 2025 & 2033
- Figure 23: North America Phosphorescent Pigments Market Revenue (billion), by Country 2025 & 2033
- Figure 24: North America Phosphorescent Pigments Market Volume (K Tons), by Country 2025 & 2033
- Figure 25: North America Phosphorescent Pigments Market Revenue Share (%), by Country 2025 & 2033
- Figure 26: North America Phosphorescent Pigments Market Volume Share (%), by Country 2025 & 2033
- Figure 27: Europe Phosphorescent Pigments Market Revenue (billion), by Type 2025 & 2033
- Figure 28: Europe Phosphorescent Pigments Market Volume (K Tons), by Type 2025 & 2033
- Figure 29: Europe Phosphorescent Pigments Market Revenue Share (%), by Type 2025 & 2033
- Figure 30: Europe Phosphorescent Pigments Market Volume Share (%), by Type 2025 & 2033
- Figure 31: Europe Phosphorescent Pigments Market Revenue (billion), by Application 2025 & 2033
- Figure 32: Europe Phosphorescent Pigments Market Volume (K Tons), by Application 2025 & 2033
- Figure 33: Europe Phosphorescent Pigments Market Revenue Share (%), by Application 2025 & 2033
- Figure 34: Europe Phosphorescent Pigments Market Volume Share (%), by Application 2025 & 2033
- Figure 35: Europe Phosphorescent Pigments Market Revenue (billion), by Country 2025 & 2033
- Figure 36: Europe Phosphorescent Pigments Market Volume (K Tons), by Country 2025 & 2033
- Figure 37: Europe Phosphorescent Pigments Market Revenue Share (%), by Country 2025 & 2033
- Figure 38: Europe Phosphorescent Pigments Market Volume Share (%), by Country 2025 & 2033
- Figure 39: South America Phosphorescent Pigments Market Revenue (billion), by Type 2025 & 2033
- Figure 40: South America Phosphorescent Pigments Market Volume (K Tons), by Type 2025 & 2033
- Figure 41: South America Phosphorescent Pigments Market Revenue Share (%), by Type 2025 & 2033
- Figure 42: South America Phosphorescent Pigments Market Volume Share (%), by Type 2025 & 2033
- Figure 43: South America Phosphorescent Pigments Market Revenue (billion), by Application 2025 & 2033
- Figure 44: South America Phosphorescent Pigments Market Volume (K Tons), by Application 2025 & 2033
- Figure 45: South America Phosphorescent Pigments Market Revenue Share (%), by Application 2025 & 2033
- Figure 46: South America Phosphorescent Pigments Market Volume Share (%), by Application 2025 & 2033
- Figure 47: South America Phosphorescent Pigments Market Revenue (billion), by Country 2025 & 2033
- Figure 48: South America Phosphorescent Pigments Market Volume (K Tons), by Country 2025 & 2033
- Figure 49: South America Phosphorescent Pigments Market Revenue Share (%), by Country 2025 & 2033
- Figure 50: South America Phosphorescent Pigments Market Volume Share (%), by Country 2025 & 2033
- Figure 51: Middle East Phosphorescent Pigments Market Revenue (billion), by Type 2025 & 2033
- Figure 52: Middle East Phosphorescent Pigments Market Volume (K Tons), by Type 2025 & 2033
- Figure 53: Middle East Phosphorescent Pigments Market Revenue Share (%), by Type 2025 & 2033
- Figure 54: Middle East Phosphorescent Pigments Market Volume Share (%), by Type 2025 & 2033
- Figure 55: Middle East Phosphorescent Pigments Market Revenue (billion), by Application 2025 & 2033
- Figure 56: Middle East Phosphorescent Pigments Market Volume (K Tons), by Application 2025 & 2033
- Figure 57: Middle East Phosphorescent Pigments Market Revenue Share (%), by Application 2025 & 2033
- Figure 58: Middle East Phosphorescent Pigments Market Volume Share (%), by Application 2025 & 2033
- Figure 59: Middle East Phosphorescent Pigments Market Revenue (billion), by Country 2025 & 2033
- Figure 60: Middle East Phosphorescent Pigments Market Volume (K Tons), by Country 2025 & 2033
- Figure 61: Middle East Phosphorescent Pigments Market Revenue Share (%), by Country 2025 & 2033
- Figure 62: Middle East Phosphorescent Pigments Market Volume Share (%), by Country 2025 & 2033
- Figure 63: Saudi Arabia Phosphorescent Pigments Market Revenue (billion), by Type 2025 & 2033
- Figure 64: Saudi Arabia Phosphorescent Pigments Market Volume (K Tons), by Type 2025 & 2033
- Figure 65: Saudi Arabia Phosphorescent Pigments Market Revenue Share (%), by Type 2025 & 2033
- Figure 66: Saudi Arabia Phosphorescent Pigments Market Volume Share (%), by Type 2025 & 2033
- Figure 67: Saudi Arabia Phosphorescent Pigments Market Revenue (billion), by Application 2025 & 2033
- Figure 68: Saudi Arabia Phosphorescent Pigments Market Volume (K Tons), by Application 2025 & 2033
- Figure 69: Saudi Arabia Phosphorescent Pigments Market Revenue Share (%), by Application 2025 & 2033
- Figure 70: Saudi Arabia Phosphorescent Pigments Market Volume Share (%), by Application 2025 & 2033
- Figure 71: Saudi Arabia Phosphorescent Pigments Market Revenue (billion), by Country 2025 & 2033
- Figure 72: Saudi Arabia Phosphorescent Pigments Market Volume (K Tons), by Country 2025 & 2033
- Figure 73: Saudi Arabia Phosphorescent Pigments Market Revenue Share (%), by Country 2025 & 2033
- Figure 74: Saudi Arabia Phosphorescent Pigments Market Volume Share (%), by Country 2025 & 2033
List of Tables
- Table 1: Global Phosphorescent Pigments Market Revenue billion Forecast, by Type 2020 & 2033
- Table 2: Global Phosphorescent Pigments Market Volume K Tons Forecast, by Type 2020 & 2033
- Table 3: Global Phosphorescent Pigments Market Revenue billion Forecast, by Application 2020 & 2033
- Table 4: Global Phosphorescent Pigments Market Volume K Tons Forecast, by Application 2020 & 2033
- Table 5: Global Phosphorescent Pigments Market Revenue billion Forecast, by Region 2020 & 2033
- Table 6: Global Phosphorescent Pigments Market Volume K Tons Forecast, by Region 2020 & 2033
- Table 7: Global Phosphorescent Pigments Market Revenue billion Forecast, by Type 2020 & 2033
- Table 8: Global Phosphorescent Pigments Market Volume K Tons Forecast, by Type 2020 & 2033
- Table 9: Global Phosphorescent Pigments Market Revenue billion Forecast, by Application 2020 & 2033
- Table 10: Global Phosphorescent Pigments Market Volume K Tons Forecast, by Application 2020 & 2033
- Table 11: Global Phosphorescent Pigments Market Revenue billion Forecast, by Country 2020 & 2033
- Table 12: Global Phosphorescent Pigments Market Volume K Tons Forecast, by Country 2020 & 2033
- Table 13: China Phosphorescent Pigments Market Revenue (billion) Forecast, by Application 2020 & 2033
- Table 14: China Phosphorescent Pigments Market Volume (K Tons) Forecast, by Application 2020 & 2033
- Table 15: India Phosphorescent Pigments Market Revenue (billion) Forecast, by Application 2020 & 2033
- Table 16: India Phosphorescent Pigments Market Volume (K Tons) Forecast, by Application 2020 & 2033
- Table 17: Japan Phosphorescent Pigments Market Revenue (billion) Forecast, by Application 2020 & 2033
- Table 18: Japan Phosphorescent Pigments Market Volume (K Tons) Forecast, by Application 2020 & 2033
- Table 19: South Korea Phosphorescent Pigments Market Revenue (billion) Forecast, by Application 2020 & 2033
- Table 20: South Korea Phosphorescent Pigments Market Volume (K Tons) Forecast, by Application 2020 & 2033
- Table 21: Rest of Asia Pacific Phosphorescent Pigments Market Revenue (billion) Forecast, by Application 2020 & 2033
- Table 22: Rest of Asia Pacific Phosphorescent Pigments Market Volume (K Tons) Forecast, by Application 2020 & 2033
- Table 23: Global Phosphorescent Pigments Market Revenue billion Forecast, by Type 2020 & 2033
- Table 24: Global Phosphorescent Pigments Market Volume K Tons Forecast, by Type 2020 & 2033
- Table 25: Global Phosphorescent Pigments Market Revenue billion Forecast, by Application 2020 & 2033
- Table 26: Global Phosphorescent Pigments Market Volume K Tons Forecast, by Application 2020 & 2033
- Table 27: Global Phosphorescent Pigments Market Revenue billion Forecast, by Country 2020 & 2033
- Table 28: Global Phosphorescent Pigments Market Volume K Tons Forecast, by Country 2020 & 2033
- Table 29: United States Phosphorescent Pigments Market Revenue (billion) Forecast, by Application 2020 & 2033
- Table 30: United States Phosphorescent Pigments Market Volume (K Tons) Forecast, by Application 2020 & 2033
- Table 31: Canada Phosphorescent Pigments Market Revenue (billion) Forecast, by Application 2020 & 2033
- Table 32: Canada Phosphorescent Pigments Market Volume (K Tons) Forecast, by Application 2020 & 2033
- Table 33: Mexico Phosphorescent Pigments Market Revenue (billion) Forecast, by Application 2020 & 2033
- Table 34: Mexico Phosphorescent Pigments Market Volume (K Tons) Forecast, by Application 2020 & 2033
- Table 35: Global Phosphorescent Pigments Market Revenue billion Forecast, by Type 2020 & 2033
- Table 36: Global Phosphorescent Pigments Market Volume K Tons Forecast, by Type 2020 & 2033
- Table 37: Global Phosphorescent Pigments Market Revenue billion Forecast, by Application 2020 & 2033
- Table 38: Global Phosphorescent Pigments Market Volume K Tons Forecast, by Application 2020 & 2033
- Table 39: Global Phosphorescent Pigments Market Revenue billion Forecast, by Country 2020 & 2033
- Table 40: Global Phosphorescent Pigments Market Volume K Tons Forecast, by Country 2020 & 2033
- Table 41: Germany Phosphorescent Pigments Market Revenue (billion) Forecast, by Application 2020 & 2033
- Table 42: Germany Phosphorescent Pigments Market Volume (K Tons) Forecast, by Application 2020 & 2033
- Table 43: United Kingdom Phosphorescent Pigments Market Revenue (billion) Forecast, by Application 2020 & 2033
- Table 44: United Kingdom Phosphorescent Pigments Market Volume (K Tons) Forecast, by Application 2020 & 2033
- Table 45: Italy Phosphorescent Pigments Market Revenue (billion) Forecast, by Application 2020 & 2033
- Table 46: Italy Phosphorescent Pigments Market Volume (K Tons) Forecast, by Application 2020 & 2033
- Table 47: France Phosphorescent Pigments Market Revenue (billion) Forecast, by Application 2020 & 2033
- Table 48: France Phosphorescent Pigments Market Volume (K Tons) Forecast, by Application 2020 & 2033
- Table 49: Rest of Europe Phosphorescent Pigments Market Revenue (billion) Forecast, by Application 2020 & 2033
- Table 50: Rest of Europe Phosphorescent Pigments Market Volume (K Tons) Forecast, by Application 2020 & 2033
- Table 51: Global Phosphorescent Pigments Market Revenue billion Forecast, by Type 2020 & 2033
- Table 52: Global Phosphorescent Pigments Market Volume K Tons Forecast, by Type 2020 & 2033
- Table 53: Global Phosphorescent Pigments Market Revenue billion Forecast, by Application 2020 & 2033
- Table 54: Global Phosphorescent Pigments Market Volume K Tons Forecast, by Application 2020 & 2033
- Table 55: Global Phosphorescent Pigments Market Revenue billion Forecast, by Country 2020 & 2033
- Table 56: Global Phosphorescent Pigments Market Volume K Tons Forecast, by Country 2020 & 2033
- Table 57: Brazil Phosphorescent Pigments Market Revenue (billion) Forecast, by Application 2020 & 2033
- Table 58: Brazil Phosphorescent Pigments Market Volume (K Tons) Forecast, by Application 2020 & 2033
- Table 59: Argentina Phosphorescent Pigments Market Revenue (billion) Forecast, by Application 2020 & 2033
- Table 60: Argentina Phosphorescent Pigments Market Volume (K Tons) Forecast, by Application 2020 & 2033
- Table 61: Rest of South America Phosphorescent Pigments Market Revenue (billion) Forecast, by Application 2020 & 2033
- Table 62: Rest of South America Phosphorescent Pigments Market Volume (K Tons) Forecast, by Application 2020 & 2033
- Table 63: Global Phosphorescent Pigments Market Revenue billion Forecast, by Type 2020 & 2033
- Table 64: Global Phosphorescent Pigments Market Volume K Tons Forecast, by Type 2020 & 2033
- Table 65: Global Phosphorescent Pigments Market Revenue billion Forecast, by Application 2020 & 2033
- Table 66: Global Phosphorescent Pigments Market Volume K Tons Forecast, by Application 2020 & 2033
- Table 67: Global Phosphorescent Pigments Market Revenue billion Forecast, by Country 2020 & 2033
- Table 68: Global Phosphorescent Pigments Market Volume K Tons Forecast, by Country 2020 & 2033
- Table 69: Global Phosphorescent Pigments Market Revenue billion Forecast, by Type 2020 & 2033
- Table 70: Global Phosphorescent Pigments Market Volume K Tons Forecast, by Type 2020 & 2033
- Table 71: Global Phosphorescent Pigments Market Revenue billion Forecast, by Application 2020 & 2033
- Table 72: Global Phosphorescent Pigments Market Volume K Tons Forecast, by Application 2020 & 2033
- Table 73: Global Phosphorescent Pigments Market Revenue billion Forecast, by Country 2020 & 2033
- Table 74: Global Phosphorescent Pigments Market Volume K Tons Forecast, by Country 2020 & 2033
- Table 75: South Africa Phosphorescent Pigments Market Revenue (billion) Forecast, by Application 2020 & 2033
- Table 76: South Africa Phosphorescent Pigments Market Volume (K Tons) Forecast, by Application 2020 & 2033
- Table 77: Rest of Middle East Phosphorescent Pigments Market Revenue (billion) Forecast, by Application 2020 & 2033
- Table 78: Rest of Middle East Phosphorescent Pigments Market Volume (K Tons) Forecast, by Application 2020 & 2033
Frequently Asked Questions
1. What is the projected Compound Annual Growth Rate (CAGR) of the Phosphorescent Pigments Market?
The projected CAGR is approximately 15.73%.
2. Which companies are prominent players in the Phosphorescent Pigments Market?
Key companies in the market include Badger Color Concentrates, Honeywell International Inc, LuminoChem Ltd, United Mineral and Chemical Corp , GloTech International Ltd, Nemoto & Co Ltd, Kremer Pigmente, Nemoto Lumi-Materials Company Limited, Radiant Color NV, Allureglow International.
3. What are the main segments of the Phosphorescent Pigments Market?
The market segments include Type, Application.
4. Can you provide details about the market size?
The market size is estimated to be USD 6.88 billion as of 2022.
5. What are some drivers contributing to market growth?
; Rising demand from paints & coatings; Increasing product application in signage boards.
6. What are the notable trends driving market growth?
Paints & Coatings Dominating the Phosphorescent Pigments Market Growth.
7. Are there any restraints impacting market growth?
Fluctuating Prices of Nickel and Other Alloying Elements; Other Restraints.
8. Can you provide examples of recent developments in the market?
N/A
9. What pricing options are available for accessing the report?
Pricing options include single-user, multi-user, and enterprise licenses priced at USD 4750, USD 5250, and USD 8750 respectively.
10. Is the market size provided in terms of value or volume?
The market size is provided in terms of value, measured in billion and volume, measured in K Tons.
11. Are there any specific market keywords associated with the report?
Yes, the market keyword associated with the report is "Phosphorescent Pigments Market," which aids in identifying and referencing the specific market segment covered.
12. How do I determine which pricing option suits my needs best?
The pricing options vary based on user requirements and access needs. Individual users may opt for single-user licenses, while businesses requiring broader access may choose multi-user or enterprise licenses for cost-effective access to the report.
13. Are there any additional resources or data provided in the Phosphorescent Pigments Market report?
While the report offers comprehensive insights, it's advisable to review the specific contents or supplementary materials provided to ascertain if additional resources or data are available.
14. How can I stay updated on further developments or reports in the Phosphorescent Pigments Market?
To stay informed about further developments, trends, and reports in the Phosphorescent Pigments Market, consider subscribing to industry newsletters, following relevant companies and organizations, or regularly checking reputable industry news sources and publications.
Methodology
Step 1 - Identification of Relevant Samples Size from Population Database


Step 2 - Approaches for Defining Global Market Size (Value, Volume* & Price*)

Note*: In applicable scenarios
Step 3 - Data Sources
Primary Research
- Web Analytics
- Survey Reports
- Research Institute
- Latest Research Reports
- Opinion Leaders
Secondary Research
- Annual Reports
- White Paper
- Latest Press Release
- Industry Association
- Paid Database
- Investor Presentations

Step 4 - Data Triangulation
Involves using different sources of information in order to increase the validity of a study
These sources are likely to be stakeholders in a program - participants, other researchers, program staff, other community members, and so on.
Then we put all data in single framework & apply various statistical tools to find out the dynamic on the market.
During the analysis stage, feedback from the stakeholder groups would be compared to determine areas of agreement as well as areas of divergence