

Key Insights
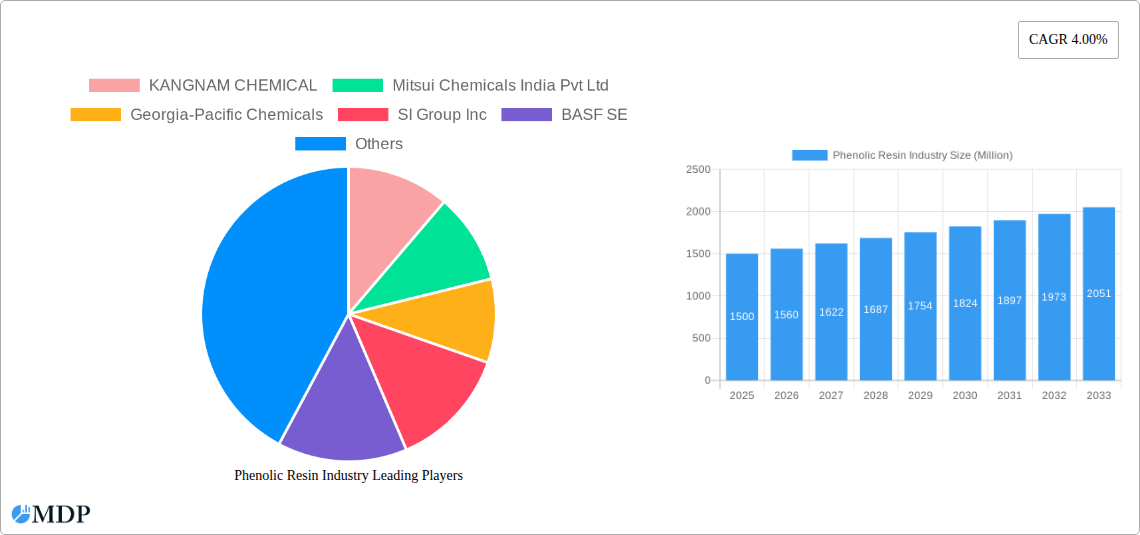
The global phenolic resin market, valued at approximately $XX million in 2025, is projected to experience steady growth with a compound annual growth rate (CAGR) of 4.00% from 2025 to 2033. This growth is driven by the increasing demand from key end-use industries such as automotive and transportation, building and construction, and consumer electronics. The automotive sector's reliance on phenolic resins for components like brakes and clutches, coupled with the burgeoning construction industry's need for robust and durable materials, significantly contributes to market expansion. Furthermore, the rising adoption of phenolic resins in electrical and electronic applications, leveraging their excellent insulating properties, fuels market growth. The market is segmented by product type (novolac and resol), application (molding, adhesive, insulation, and others), and end-user industry. While the resol type currently holds a larger market share due to its versatility, novolac resins are gaining traction owing to their superior thermal stability. Geographical analysis reveals strong growth potential in the Asia-Pacific region, driven by rapid industrialization and infrastructure development in countries like China and India. However, fluctuations in raw material prices and environmental concerns related to resin production pose challenges to market expansion. Despite these restraints, the continued innovation in phenolic resin formulations to enhance performance characteristics and sustainability will contribute to the overall market growth trajectory.
The competitive landscape is characterized by a mix of established global players and regional manufacturers. Companies such as BASF SE, Mitsui Chemicals, and others are continuously investing in research and development to improve product quality and explore new applications. Strategic partnerships, acquisitions, and expansions are common strategies employed by market participants to enhance their market presence and competitiveness. The forecast period (2025-2033) anticipates a continuous upward trend, propelled by the increasing demand for durable, cost-effective, and versatile materials across diverse industrial sectors. The long-term outlook remains positive, with continued growth expected as emerging economies further industrialize and adopt advanced technologies incorporating phenolic resins.
This in-depth report provides a comprehensive analysis of the global Phenolic Resin industry, offering invaluable insights for stakeholders, investors, and industry professionals. With a study period spanning 2019-2033, a base year of 2025, and a forecast period of 2025-2033, this report leverages rigorous data analysis and expert insights to uncover key market trends and future growth potential. The global market is expected to reach xx Million by 2033, exhibiting a CAGR of xx% during the forecast period.
Phenolic Resin Industry Market Dynamics & Concentration
The global phenolic resin market is characterized by a moderately concentrated competitive landscape, with several key players holding significant market share. Market concentration is influenced by factors such as economies of scale, technological advancements, and M&A activities. The industry witnesses continuous innovation driven by the need for improved resin properties like enhanced thermal stability, superior adhesion, and biodegradability. Stringent environmental regulations regarding volatile organic compounds (VOCs) and the increasing focus on sustainable practices are significantly shaping the industry landscape. Product substitutes, such as epoxy resins and polyurethane resins, pose a competitive threat, necessitating ongoing innovation to maintain market share. End-user trends, particularly in the automotive, construction, and electronics sectors, play a crucial role in driving demand. The number of M&A deals in the industry has shown a significant increase in recent years, as companies pursue strategic expansion and consolidation. For instance, in 2022 alone, xx M&A deals were recorded. Key players like BASF SE hold significant market share, estimated at xx%, while other players account for xx% collectively.
Phenolic Resin Industry Industry Trends & Analysis
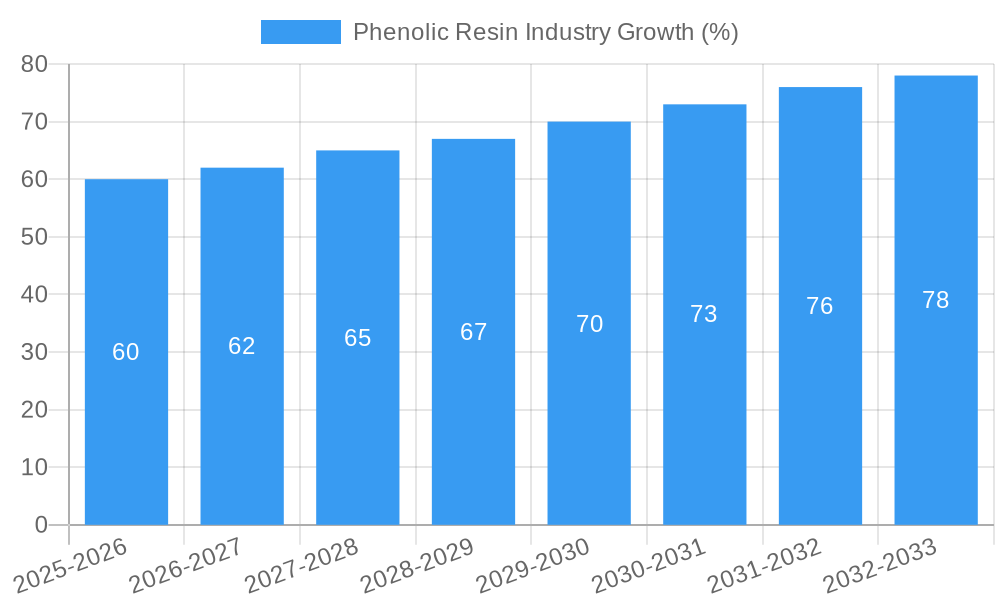
The phenolic resin market is experiencing robust growth, driven by increasing demand from various end-use sectors. Several key trends are shaping the market trajectory. Technological advancements in resin formulations are enabling the development of high-performance resins with improved properties, catering to the evolving needs of diverse industries. The growing adoption of sustainable and eco-friendly resins is another significant trend. Consumer preference for durable, high-quality products is fueling demand for phenolic resins in various applications. Competitive dynamics are influenced by factors such as pricing strategies, product differentiation, and technological innovation. The market exhibits a high degree of competition among established players and emerging entrants. The industry's growth trajectory is further influenced by macroeconomic conditions and fluctuations in raw material prices. Overall, the market is expected to witness sustained growth in the coming years, driven by these intertwined factors. The estimated market value in 2025 is projected to be xx Million, showcasing a significant increase from the historical period.
Leading Markets & Segments in Phenolic Resin Industry
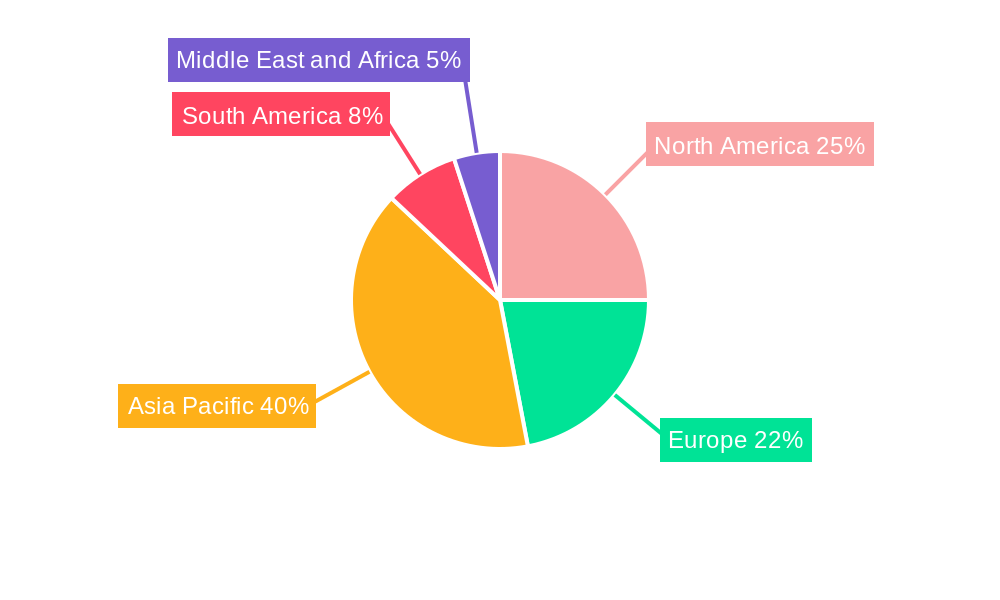
The Asia-Pacific region currently dominates the global phenolic resin market, driven by rapid industrialization and infrastructural development in countries like China and India. Within the product type segment, resol resins currently hold the largest market share, primarily owing to their versatility and suitability in a wide range of applications. The molding application segment dominates the application landscape, accounting for the largest market share due to its extensive use in the automotive and electronics industries. Key drivers for this dominance include:
- Rapid industrialization and urbanization: Driving increased demand for construction materials and consumer goods.
- Favorable government policies and infrastructure investments: Supporting industrial growth and creating a favorable business environment.
- Strong automotive and electronics sectors: Contributing significantly to the demand for phenolic resins in these industries.
The automotive and transportation sector is a key end-user industry, largely due to the use of phenolic resins in brake linings, clutch facings, and other critical components.
Phenolic Resin Industry Product Developments
Recent product innovations focus on enhancing the performance and sustainability of phenolic resins. This includes the development of bio-based phenolic resins, which utilize renewable resources and reduce reliance on petroleum-based raw materials. These innovations are improving the thermal stability, chemical resistance, and mechanical properties of phenolic resins, allowing them to cater to increasingly demanding applications. Improved adhesion and reduced VOC emissions are also key areas of focus, aligning with stricter environmental regulations.
Key Drivers of Phenolic Resin Industry Growth
Several factors are driving the growth of the phenolic resin industry. Technological advancements, including the development of high-performance resins with improved properties and bio-based alternatives, are playing a key role. Economic growth in developing countries is fueling demand for various products that utilize phenolic resins. Favorable government policies and regulations promoting sustainable materials and manufacturing practices further support industry growth. For example, the increasing adoption of renewable energy sources, particularly in the building and construction industry, is leading to greater demand for energy-efficient materials, where phenolic resins play a vital role in thermal insulation.
Challenges in the Phenolic Resin Industry Market
The phenolic resin industry faces challenges such as fluctuating raw material prices, which can significantly impact production costs and profitability. Supply chain disruptions can lead to production delays and shortages. Intense competition from substitute materials and emerging technologies presents a constant challenge, demanding continuous innovation and adaptation to maintain market share. Regulatory compliance requirements, particularly those related to environmental protection, can also impose additional costs and complexities on manufacturers.
Emerging Opportunities in Phenolic Resin Industry
The industry is poised for growth due to opportunities presented by technological advancements in resin formulations and the development of bio-based alternatives. Strategic partnerships and collaborations between manufacturers and end-users can unlock new market segments and applications. Market expansion strategies focusing on emerging economies with rapid industrialization, such as those in Southeast Asia and Africa, hold significant potential for growth.
Leading Players in the Phenolic Resin Industry Sector
- KANGNAM CHEMICAL
- Mitsui Chemicals India Pvt Ltd
- Georgia-Pacific Chemicals
- SI Group Inc
- BASF SE
- SHANDONG LAIWU RUNDA NEW MATERIAL CO LTD
- Hexcel Corporation
- DIC CORPORATION
- Prefere Resins Holding GmbH
- Changshu South-East Plastic Co Ltd
- Sumitomo Bakelite Co Ltd
- Kolon Industries Inc
Key Milestones in Phenolic Resin Industry Industry
- November 2022: ASK Chemicals Group acquired the industrial resins business from SI Group, expanding its presence in the foundry and phenolic resin markets.
- December 2022: Sumitomo Bakelite Europe NV received ISCC PLUS certification, highlighting its commitment to sustainability.
- January 2023: BASF SE invested in capacity expansion for polymer dispersions in Indonesia, catering to the growing packaging market in ASEAN.
Strategic Outlook for Phenolic Resin Industry Market
The phenolic resin market is poised for continued growth, driven by technological innovation, increasing demand from diverse end-use sectors, and a rising focus on sustainability. Strategic partnerships, investments in R&D, and market expansion into emerging economies will be critical for success in this dynamic industry. The future potential lies in developing high-performance, eco-friendly resins that cater to the evolving needs of a growing global market.
Phenolic Resin Industry Segmentation
-
1. Product Type
- 1.1. Novolac
- 1.2. Resol
-
2. Application
- 2.1. Molding
- 2.2. Adhesive
- 2.3. Insulation
- 2.4. Other Applications
-
3. End-user Industry
- 3.1. Automotive and Transportation
- 3.2. Consumer Electronics
- 3.3. Building and Construction
- 3.4. Oil and Gas
- 3.5. Furniture
- 3.6. Other End-user Industries
Phenolic Resin Industry Segmentation By Geography
-
1. Asia Pacific
- 1.1. China
- 1.2. India
- 1.3. Japan
- 1.4. South Korea
- 1.5. Rest of Asia Pacific
-
2. North America
- 2.1. United States
- 2.2. Canada
- 2.3. Mexico
-
3. Europe
- 3.1. Germany
- 3.2. United Kingdom
- 3.3. France
- 3.4. Italy
- 3.5. Rest of Europe
-
4. South America
- 4.1. Brazil
- 4.2. Argentina
- 4.3. Rest of South America
-
5. Middle East and Africa
- 5.1. Saudi Arabia
- 5.2. South Africa
- 5.3. Rest of Middle East and Africa
Phenolic Resin Industry REPORT HIGHLIGHTS
| Aspects | Details |
|---|---|
| Study Period | 2019-2033 |
| Base Year | 2024 |
| Estimated Year | 2025 |
| Forecast Period | 2025-2033 |
| Historical Period | 2019-2024 |
| Growth Rate | CAGR of 4.00% from 2019-2033 |
| Segmentation |
|
Table of Contents
- 1. Introduction
- 1.1. Research Scope
- 1.2. Market Segmentation
- 1.3. Research Methodology
- 1.4. Definitions and Assumptions
- 2. Executive Summary
- 2.1. Introduction
- 3. Market Dynamics
- 3.1. Introduction
- 3.2. Market Drivers
- 3.2.1. Increasing Demand from the Construction and Transportation Industries; Other Drivers
- 3.3. Market Restrains
- 3.3.1. Unfavorable Conditions Arising Due to the COVID-19 Outbreak; Other Restraints
- 3.4. Market Trends
- 3.4.1. Increasing Demand for Molding Applications is Driving the Phenolic Resin Market
- 4. Market Factor Analysis
- 4.1. Porters Five Forces
- 4.2. Supply/Value Chain
- 4.3. PESTEL analysis
- 4.4. Market Entropy
- 4.5. Patent/Trademark Analysis
- 5. Global Phenolic Resin Industry Analysis, Insights and Forecast, 2019-2031
- 5.1. Market Analysis, Insights and Forecast - by Product Type
- 5.1.1. Novolac
- 5.1.2. Resol
- 5.2. Market Analysis, Insights and Forecast - by Application
- 5.2.1. Molding
- 5.2.2. Adhesive
- 5.2.3. Insulation
- 5.2.4. Other Applications
- 5.3. Market Analysis, Insights and Forecast - by End-user Industry
- 5.3.1. Automotive and Transportation
- 5.3.2. Consumer Electronics
- 5.3.3. Building and Construction
- 5.3.4. Oil and Gas
- 5.3.5. Furniture
- 5.3.6. Other End-user Industries
- 5.4. Market Analysis, Insights and Forecast - by Region
- 5.4.1. Asia Pacific
- 5.4.2. North America
- 5.4.3. Europe
- 5.4.4. South America
- 5.4.5. Middle East and Africa
- 5.1. Market Analysis, Insights and Forecast - by Product Type
- 6. Asia Pacific Phenolic Resin Industry Analysis, Insights and Forecast, 2019-2031
- 6.1. Market Analysis, Insights and Forecast - by Product Type
- 6.1.1. Novolac
- 6.1.2. Resol
- 6.2. Market Analysis, Insights and Forecast - by Application
- 6.2.1. Molding
- 6.2.2. Adhesive
- 6.2.3. Insulation
- 6.2.4. Other Applications
- 6.3. Market Analysis, Insights and Forecast - by End-user Industry
- 6.3.1. Automotive and Transportation
- 6.3.2. Consumer Electronics
- 6.3.3. Building and Construction
- 6.3.4. Oil and Gas
- 6.3.5. Furniture
- 6.3.6. Other End-user Industries
- 6.1. Market Analysis, Insights and Forecast - by Product Type
- 7. North America Phenolic Resin Industry Analysis, Insights and Forecast, 2019-2031
- 7.1. Market Analysis, Insights and Forecast - by Product Type
- 7.1.1. Novolac
- 7.1.2. Resol
- 7.2. Market Analysis, Insights and Forecast - by Application
- 7.2.1. Molding
- 7.2.2. Adhesive
- 7.2.3. Insulation
- 7.2.4. Other Applications
- 7.3. Market Analysis, Insights and Forecast - by End-user Industry
- 7.3.1. Automotive and Transportation
- 7.3.2. Consumer Electronics
- 7.3.3. Building and Construction
- 7.3.4. Oil and Gas
- 7.3.5. Furniture
- 7.3.6. Other End-user Industries
- 7.1. Market Analysis, Insights and Forecast - by Product Type
- 8. Europe Phenolic Resin Industry Analysis, Insights and Forecast, 2019-2031
- 8.1. Market Analysis, Insights and Forecast - by Product Type
- 8.1.1. Novolac
- 8.1.2. Resol
- 8.2. Market Analysis, Insights and Forecast - by Application
- 8.2.1. Molding
- 8.2.2. Adhesive
- 8.2.3. Insulation
- 8.2.4. Other Applications
- 8.3. Market Analysis, Insights and Forecast - by End-user Industry
- 8.3.1. Automotive and Transportation
- 8.3.2. Consumer Electronics
- 8.3.3. Building and Construction
- 8.3.4. Oil and Gas
- 8.3.5. Furniture
- 8.3.6. Other End-user Industries
- 8.1. Market Analysis, Insights and Forecast - by Product Type
- 9. South America Phenolic Resin Industry Analysis, Insights and Forecast, 2019-2031
- 9.1. Market Analysis, Insights and Forecast - by Product Type
- 9.1.1. Novolac
- 9.1.2. Resol
- 9.2. Market Analysis, Insights and Forecast - by Application
- 9.2.1. Molding
- 9.2.2. Adhesive
- 9.2.3. Insulation
- 9.2.4. Other Applications
- 9.3. Market Analysis, Insights and Forecast - by End-user Industry
- 9.3.1. Automotive and Transportation
- 9.3.2. Consumer Electronics
- 9.3.3. Building and Construction
- 9.3.4. Oil and Gas
- 9.3.5. Furniture
- 9.3.6. Other End-user Industries
- 9.1. Market Analysis, Insights and Forecast - by Product Type
- 10. Middle East and Africa Phenolic Resin Industry Analysis, Insights and Forecast, 2019-2031
- 10.1. Market Analysis, Insights and Forecast - by Product Type
- 10.1.1. Novolac
- 10.1.2. Resol
- 10.2. Market Analysis, Insights and Forecast - by Application
- 10.2.1. Molding
- 10.2.2. Adhesive
- 10.2.3. Insulation
- 10.2.4. Other Applications
- 10.3. Market Analysis, Insights and Forecast - by End-user Industry
- 10.3.1. Automotive and Transportation
- 10.3.2. Consumer Electronics
- 10.3.3. Building and Construction
- 10.3.4. Oil and Gas
- 10.3.5. Furniture
- 10.3.6. Other End-user Industries
- 10.1. Market Analysis, Insights and Forecast - by Product Type
- 11. Asia Pacific Phenolic Resin Industry Analysis, Insights and Forecast, 2019-2031
- 11.1. Market Analysis, Insights and Forecast - By Country/Sub-region
- 11.1.1 China
- 11.1.2 India
- 11.1.3 Japan
- 11.1.4 South Korea
- 11.1.5 Rest of Asia Pacific
- 12. North America Phenolic Resin Industry Analysis, Insights and Forecast, 2019-2031
- 12.1. Market Analysis, Insights and Forecast - By Country/Sub-region
- 12.1.1 United States
- 12.1.2 Canada
- 12.1.3 Mexico
- 13. Europe Phenolic Resin Industry Analysis, Insights and Forecast, 2019-2031
- 13.1. Market Analysis, Insights and Forecast - By Country/Sub-region
- 13.1.1 Germany
- 13.1.2 United Kingdom
- 13.1.3 France
- 13.1.4 Italy
- 13.1.5 Rest of Europe
- 14. South America Phenolic Resin Industry Analysis, Insights and Forecast, 2019-2031
- 14.1. Market Analysis, Insights and Forecast - By Country/Sub-region
- 14.1.1 Brazil
- 14.1.2 Argentina
- 14.1.3 Rest of South America
- 15. Middle East and Africa Phenolic Resin Industry Analysis, Insights and Forecast, 2019-2031
- 15.1. Market Analysis, Insights and Forecast - By Country/Sub-region
- 15.1.1 Saudi Arabia
- 15.1.2 South Africa
- 15.1.3 Rest of Middle East and Africa
- 16. Competitive Analysis
- 16.1. Global Market Share Analysis 2024
- 16.2. Company Profiles
- 16.2.1 KANGNAM CHEMICAL
- 16.2.1.1. Overview
- 16.2.1.2. Products
- 16.2.1.3. SWOT Analysis
- 16.2.1.4. Recent Developments
- 16.2.1.5. Financials (Based on Availability)
- 16.2.2 Mitsui Chemicals India Pvt Ltd
- 16.2.2.1. Overview
- 16.2.2.2. Products
- 16.2.2.3. SWOT Analysis
- 16.2.2.4. Recent Developments
- 16.2.2.5. Financials (Based on Availability)
- 16.2.3 Georgia-Pacific Chemicals
- 16.2.3.1. Overview
- 16.2.3.2. Products
- 16.2.3.3. SWOT Analysis
- 16.2.3.4. Recent Developments
- 16.2.3.5. Financials (Based on Availability)
- 16.2.4 SI Group Inc
- 16.2.4.1. Overview
- 16.2.4.2. Products
- 16.2.4.3. SWOT Analysis
- 16.2.4.4. Recent Developments
- 16.2.4.5. Financials (Based on Availability)
- 16.2.5 BASF SE
- 16.2.5.1. Overview
- 16.2.5.2. Products
- 16.2.5.3. SWOT Analysis
- 16.2.5.4. Recent Developments
- 16.2.5.5. Financials (Based on Availability)
- 16.2.6 SHANDONG LAIWU RUNDA NEW MATERIAL CO LTD
- 16.2.6.1. Overview
- 16.2.6.2. Products
- 16.2.6.3. SWOT Analysis
- 16.2.6.4. Recent Developments
- 16.2.6.5. Financials (Based on Availability)
- 16.2.7 Hexcel Corporation
- 16.2.7.1. Overview
- 16.2.7.2. Products
- 16.2.7.3. SWOT Analysis
- 16.2.7.4. Recent Developments
- 16.2.7.5. Financials (Based on Availability)
- 16.2.8 DIC CORPORATION
- 16.2.8.1. Overview
- 16.2.8.2. Products
- 16.2.8.3. SWOT Analysis
- 16.2.8.4. Recent Developments
- 16.2.8.5. Financials (Based on Availability)
- 16.2.9 Prefere Resins Holding GmbH
- 16.2.9.1. Overview
- 16.2.9.2. Products
- 16.2.9.3. SWOT Analysis
- 16.2.9.4. Recent Developments
- 16.2.9.5. Financials (Based on Availability)
- 16.2.10 Changshu South-East Plastic Co Ltd
- 16.2.10.1. Overview
- 16.2.10.2. Products
- 16.2.10.3. SWOT Analysis
- 16.2.10.4. Recent Developments
- 16.2.10.5. Financials (Based on Availability)
- 16.2.11 Sumitomo Bakelite Co Ltd*List Not Exhaustive
- 16.2.11.1. Overview
- 16.2.11.2. Products
- 16.2.11.3. SWOT Analysis
- 16.2.11.4. Recent Developments
- 16.2.11.5. Financials (Based on Availability)
- 16.2.12 Kolon Industries Inc
- 16.2.12.1. Overview
- 16.2.12.2. Products
- 16.2.12.3. SWOT Analysis
- 16.2.12.4. Recent Developments
- 16.2.12.5. Financials (Based on Availability)
- 16.2.1 KANGNAM CHEMICAL
List of Figures
- Figure 1: Global Phenolic Resin Industry Revenue Breakdown (Million, %) by Region 2024 & 2032
- Figure 2: Asia Pacific Phenolic Resin Industry Revenue (Million), by Country 2024 & 2032
- Figure 3: Asia Pacific Phenolic Resin Industry Revenue Share (%), by Country 2024 & 2032
- Figure 4: North America Phenolic Resin Industry Revenue (Million), by Country 2024 & 2032
- Figure 5: North America Phenolic Resin Industry Revenue Share (%), by Country 2024 & 2032
- Figure 6: Europe Phenolic Resin Industry Revenue (Million), by Country 2024 & 2032
- Figure 7: Europe Phenolic Resin Industry Revenue Share (%), by Country 2024 & 2032
- Figure 8: South America Phenolic Resin Industry Revenue (Million), by Country 2024 & 2032
- Figure 9: South America Phenolic Resin Industry Revenue Share (%), by Country 2024 & 2032
- Figure 10: Middle East and Africa Phenolic Resin Industry Revenue (Million), by Country 2024 & 2032
- Figure 11: Middle East and Africa Phenolic Resin Industry Revenue Share (%), by Country 2024 & 2032
- Figure 12: Asia Pacific Phenolic Resin Industry Revenue (Million), by Product Type 2024 & 2032
- Figure 13: Asia Pacific Phenolic Resin Industry Revenue Share (%), by Product Type 2024 & 2032
- Figure 14: Asia Pacific Phenolic Resin Industry Revenue (Million), by Application 2024 & 2032
- Figure 15: Asia Pacific Phenolic Resin Industry Revenue Share (%), by Application 2024 & 2032
- Figure 16: Asia Pacific Phenolic Resin Industry Revenue (Million), by End-user Industry 2024 & 2032
- Figure 17: Asia Pacific Phenolic Resin Industry Revenue Share (%), by End-user Industry 2024 & 2032
- Figure 18: Asia Pacific Phenolic Resin Industry Revenue (Million), by Country 2024 & 2032
- Figure 19: Asia Pacific Phenolic Resin Industry Revenue Share (%), by Country 2024 & 2032
- Figure 20: North America Phenolic Resin Industry Revenue (Million), by Product Type 2024 & 2032
- Figure 21: North America Phenolic Resin Industry Revenue Share (%), by Product Type 2024 & 2032
- Figure 22: North America Phenolic Resin Industry Revenue (Million), by Application 2024 & 2032
- Figure 23: North America Phenolic Resin Industry Revenue Share (%), by Application 2024 & 2032
- Figure 24: North America Phenolic Resin Industry Revenue (Million), by End-user Industry 2024 & 2032
- Figure 25: North America Phenolic Resin Industry Revenue Share (%), by End-user Industry 2024 & 2032
- Figure 26: North America Phenolic Resin Industry Revenue (Million), by Country 2024 & 2032
- Figure 27: North America Phenolic Resin Industry Revenue Share (%), by Country 2024 & 2032
- Figure 28: Europe Phenolic Resin Industry Revenue (Million), by Product Type 2024 & 2032
- Figure 29: Europe Phenolic Resin Industry Revenue Share (%), by Product Type 2024 & 2032
- Figure 30: Europe Phenolic Resin Industry Revenue (Million), by Application 2024 & 2032
- Figure 31: Europe Phenolic Resin Industry Revenue Share (%), by Application 2024 & 2032
- Figure 32: Europe Phenolic Resin Industry Revenue (Million), by End-user Industry 2024 & 2032
- Figure 33: Europe Phenolic Resin Industry Revenue Share (%), by End-user Industry 2024 & 2032
- Figure 34: Europe Phenolic Resin Industry Revenue (Million), by Country 2024 & 2032
- Figure 35: Europe Phenolic Resin Industry Revenue Share (%), by Country 2024 & 2032
- Figure 36: South America Phenolic Resin Industry Revenue (Million), by Product Type 2024 & 2032
- Figure 37: South America Phenolic Resin Industry Revenue Share (%), by Product Type 2024 & 2032
- Figure 38: South America Phenolic Resin Industry Revenue (Million), by Application 2024 & 2032
- Figure 39: South America Phenolic Resin Industry Revenue Share (%), by Application 2024 & 2032
- Figure 40: South America Phenolic Resin Industry Revenue (Million), by End-user Industry 2024 & 2032
- Figure 41: South America Phenolic Resin Industry Revenue Share (%), by End-user Industry 2024 & 2032
- Figure 42: South America Phenolic Resin Industry Revenue (Million), by Country 2024 & 2032
- Figure 43: South America Phenolic Resin Industry Revenue Share (%), by Country 2024 & 2032
- Figure 44: Middle East and Africa Phenolic Resin Industry Revenue (Million), by Product Type 2024 & 2032
- Figure 45: Middle East and Africa Phenolic Resin Industry Revenue Share (%), by Product Type 2024 & 2032
- Figure 46: Middle East and Africa Phenolic Resin Industry Revenue (Million), by Application 2024 & 2032
- Figure 47: Middle East and Africa Phenolic Resin Industry Revenue Share (%), by Application 2024 & 2032
- Figure 48: Middle East and Africa Phenolic Resin Industry Revenue (Million), by End-user Industry 2024 & 2032
- Figure 49: Middle East and Africa Phenolic Resin Industry Revenue Share (%), by End-user Industry 2024 & 2032
- Figure 50: Middle East and Africa Phenolic Resin Industry Revenue (Million), by Country 2024 & 2032
- Figure 51: Middle East and Africa Phenolic Resin Industry Revenue Share (%), by Country 2024 & 2032
List of Tables
- Table 1: Global Phenolic Resin Industry Revenue Million Forecast, by Region 2019 & 2032
- Table 2: Global Phenolic Resin Industry Revenue Million Forecast, by Product Type 2019 & 2032
- Table 3: Global Phenolic Resin Industry Revenue Million Forecast, by Application 2019 & 2032
- Table 4: Global Phenolic Resin Industry Revenue Million Forecast, by End-user Industry 2019 & 2032
- Table 5: Global Phenolic Resin Industry Revenue Million Forecast, by Region 2019 & 2032
- Table 6: Global Phenolic Resin Industry Revenue Million Forecast, by Country 2019 & 2032
- Table 7: China Phenolic Resin Industry Revenue (Million) Forecast, by Application 2019 & 2032
- Table 8: India Phenolic Resin Industry Revenue (Million) Forecast, by Application 2019 & 2032
- Table 9: Japan Phenolic Resin Industry Revenue (Million) Forecast, by Application 2019 & 2032
- Table 10: South Korea Phenolic Resin Industry Revenue (Million) Forecast, by Application 2019 & 2032
- Table 11: Rest of Asia Pacific Phenolic Resin Industry Revenue (Million) Forecast, by Application 2019 & 2032
- Table 12: Global Phenolic Resin Industry Revenue Million Forecast, by Country 2019 & 2032
- Table 13: United States Phenolic Resin Industry Revenue (Million) Forecast, by Application 2019 & 2032
- Table 14: Canada Phenolic Resin Industry Revenue (Million) Forecast, by Application 2019 & 2032
- Table 15: Mexico Phenolic Resin Industry Revenue (Million) Forecast, by Application 2019 & 2032
- Table 16: Global Phenolic Resin Industry Revenue Million Forecast, by Country 2019 & 2032
- Table 17: Germany Phenolic Resin Industry Revenue (Million) Forecast, by Application 2019 & 2032
- Table 18: United Kingdom Phenolic Resin Industry Revenue (Million) Forecast, by Application 2019 & 2032
- Table 19: France Phenolic Resin Industry Revenue (Million) Forecast, by Application 2019 & 2032
- Table 20: Italy Phenolic Resin Industry Revenue (Million) Forecast, by Application 2019 & 2032
- Table 21: Rest of Europe Phenolic Resin Industry Revenue (Million) Forecast, by Application 2019 & 2032
- Table 22: Global Phenolic Resin Industry Revenue Million Forecast, by Country 2019 & 2032
- Table 23: Brazil Phenolic Resin Industry Revenue (Million) Forecast, by Application 2019 & 2032
- Table 24: Argentina Phenolic Resin Industry Revenue (Million) Forecast, by Application 2019 & 2032
- Table 25: Rest of South America Phenolic Resin Industry Revenue (Million) Forecast, by Application 2019 & 2032
- Table 26: Global Phenolic Resin Industry Revenue Million Forecast, by Country 2019 & 2032
- Table 27: Saudi Arabia Phenolic Resin Industry Revenue (Million) Forecast, by Application 2019 & 2032
- Table 28: South Africa Phenolic Resin Industry Revenue (Million) Forecast, by Application 2019 & 2032
- Table 29: Rest of Middle East and Africa Phenolic Resin Industry Revenue (Million) Forecast, by Application 2019 & 2032
- Table 30: Global Phenolic Resin Industry Revenue Million Forecast, by Product Type 2019 & 2032
- Table 31: Global Phenolic Resin Industry Revenue Million Forecast, by Application 2019 & 2032
- Table 32: Global Phenolic Resin Industry Revenue Million Forecast, by End-user Industry 2019 & 2032
- Table 33: Global Phenolic Resin Industry Revenue Million Forecast, by Country 2019 & 2032
- Table 34: China Phenolic Resin Industry Revenue (Million) Forecast, by Application 2019 & 2032
- Table 35: India Phenolic Resin Industry Revenue (Million) Forecast, by Application 2019 & 2032
- Table 36: Japan Phenolic Resin Industry Revenue (Million) Forecast, by Application 2019 & 2032
- Table 37: South Korea Phenolic Resin Industry Revenue (Million) Forecast, by Application 2019 & 2032
- Table 38: Rest of Asia Pacific Phenolic Resin Industry Revenue (Million) Forecast, by Application 2019 & 2032
- Table 39: Global Phenolic Resin Industry Revenue Million Forecast, by Product Type 2019 & 2032
- Table 40: Global Phenolic Resin Industry Revenue Million Forecast, by Application 2019 & 2032
- Table 41: Global Phenolic Resin Industry Revenue Million Forecast, by End-user Industry 2019 & 2032
- Table 42: Global Phenolic Resin Industry Revenue Million Forecast, by Country 2019 & 2032
- Table 43: United States Phenolic Resin Industry Revenue (Million) Forecast, by Application 2019 & 2032
- Table 44: Canada Phenolic Resin Industry Revenue (Million) Forecast, by Application 2019 & 2032
- Table 45: Mexico Phenolic Resin Industry Revenue (Million) Forecast, by Application 2019 & 2032
- Table 46: Global Phenolic Resin Industry Revenue Million Forecast, by Product Type 2019 & 2032
- Table 47: Global Phenolic Resin Industry Revenue Million Forecast, by Application 2019 & 2032
- Table 48: Global Phenolic Resin Industry Revenue Million Forecast, by End-user Industry 2019 & 2032
- Table 49: Global Phenolic Resin Industry Revenue Million Forecast, by Country 2019 & 2032
- Table 50: Germany Phenolic Resin Industry Revenue (Million) Forecast, by Application 2019 & 2032
- Table 51: United Kingdom Phenolic Resin Industry Revenue (Million) Forecast, by Application 2019 & 2032
- Table 52: France Phenolic Resin Industry Revenue (Million) Forecast, by Application 2019 & 2032
- Table 53: Italy Phenolic Resin Industry Revenue (Million) Forecast, by Application 2019 & 2032
- Table 54: Rest of Europe Phenolic Resin Industry Revenue (Million) Forecast, by Application 2019 & 2032
- Table 55: Global Phenolic Resin Industry Revenue Million Forecast, by Product Type 2019 & 2032
- Table 56: Global Phenolic Resin Industry Revenue Million Forecast, by Application 2019 & 2032
- Table 57: Global Phenolic Resin Industry Revenue Million Forecast, by End-user Industry 2019 & 2032
- Table 58: Global Phenolic Resin Industry Revenue Million Forecast, by Country 2019 & 2032
- Table 59: Brazil Phenolic Resin Industry Revenue (Million) Forecast, by Application 2019 & 2032
- Table 60: Argentina Phenolic Resin Industry Revenue (Million) Forecast, by Application 2019 & 2032
- Table 61: Rest of South America Phenolic Resin Industry Revenue (Million) Forecast, by Application 2019 & 2032
- Table 62: Global Phenolic Resin Industry Revenue Million Forecast, by Product Type 2019 & 2032
- Table 63: Global Phenolic Resin Industry Revenue Million Forecast, by Application 2019 & 2032
- Table 64: Global Phenolic Resin Industry Revenue Million Forecast, by End-user Industry 2019 & 2032
- Table 65: Global Phenolic Resin Industry Revenue Million Forecast, by Country 2019 & 2032
- Table 66: Saudi Arabia Phenolic Resin Industry Revenue (Million) Forecast, by Application 2019 & 2032
- Table 67: South Africa Phenolic Resin Industry Revenue (Million) Forecast, by Application 2019 & 2032
- Table 68: Rest of Middle East and Africa Phenolic Resin Industry Revenue (Million) Forecast, by Application 2019 & 2032
Frequently Asked Questions
1. What is the projected Compound Annual Growth Rate (CAGR) of the Phenolic Resin Industry?
The projected CAGR is approximately 4.00%.
2. Which companies are prominent players in the Phenolic Resin Industry?
Key companies in the market include KANGNAM CHEMICAL, Mitsui Chemicals India Pvt Ltd, Georgia-Pacific Chemicals, SI Group Inc, BASF SE, SHANDONG LAIWU RUNDA NEW MATERIAL CO LTD, Hexcel Corporation, DIC CORPORATION, Prefere Resins Holding GmbH, Changshu South-East Plastic Co Ltd, Sumitomo Bakelite Co Ltd*List Not Exhaustive, Kolon Industries Inc.
3. What are the main segments of the Phenolic Resin Industry?
The market segments include Product Type, Application, End-user Industry.
4. Can you provide details about the market size?
The market size is estimated to be USD XX Million as of 2022.
5. What are some drivers contributing to market growth?
Increasing Demand from the Construction and Transportation Industries; Other Drivers.
6. What are the notable trends driving market growth?
Increasing Demand for Molding Applications is Driving the Phenolic Resin Market.
7. Are there any restraints impacting market growth?
Unfavorable Conditions Arising Due to the COVID-19 Outbreak; Other Restraints.
8. Can you provide examples of recent developments in the market?
January 2023: BASF SE invested in the capacity expansion of polymer dispersions at its production site in Merak, Indonesia. The expansion is in line with the growing trend of high-quality packaging in ASEAN, where key paper and board manufacturers are located.
9. What pricing options are available for accessing the report?
Pricing options include single-user, multi-user, and enterprise licenses priced at USD 4750, USD 5250, and USD 8750 respectively.
10. Is the market size provided in terms of value or volume?
The market size is provided in terms of value, measured in Million.
11. Are there any specific market keywords associated with the report?
Yes, the market keyword associated with the report is "Phenolic Resin Industry," which aids in identifying and referencing the specific market segment covered.
12. How do I determine which pricing option suits my needs best?
The pricing options vary based on user requirements and access needs. Individual users may opt for single-user licenses, while businesses requiring broader access may choose multi-user or enterprise licenses for cost-effective access to the report.
13. Are there any additional resources or data provided in the Phenolic Resin Industry report?
While the report offers comprehensive insights, it's advisable to review the specific contents or supplementary materials provided to ascertain if additional resources or data are available.
14. How can I stay updated on further developments or reports in the Phenolic Resin Industry?
To stay informed about further developments, trends, and reports in the Phenolic Resin Industry, consider subscribing to industry newsletters, following relevant companies and organizations, or regularly checking reputable industry news sources and publications.
Methodology
Step 1 - Identification of Relevant Samples Size from Population Database


Step 2 - Approaches for Defining Global Market Size (Value, Volume* & Price*)

Note*: In applicable scenarios
Step 3 - Data Sources
Primary Research
- Web Analytics
- Survey Reports
- Research Institute
- Latest Research Reports
- Opinion Leaders
Secondary Research
- Annual Reports
- White Paper
- Latest Press Release
- Industry Association
- Paid Database
- Investor Presentations

Step 4 - Data Triangulation
Involves using different sources of information in order to increase the validity of a study
These sources are likely to be stakeholders in a program - participants, other researchers, program staff, other community members, and so on.
Then we put all data in single framework & apply various statistical tools to find out the dynamic on the market.
During the analysis stage, feedback from the stakeholder groups would be compared to determine areas of agreement as well as areas of divergence
