

Key Insights
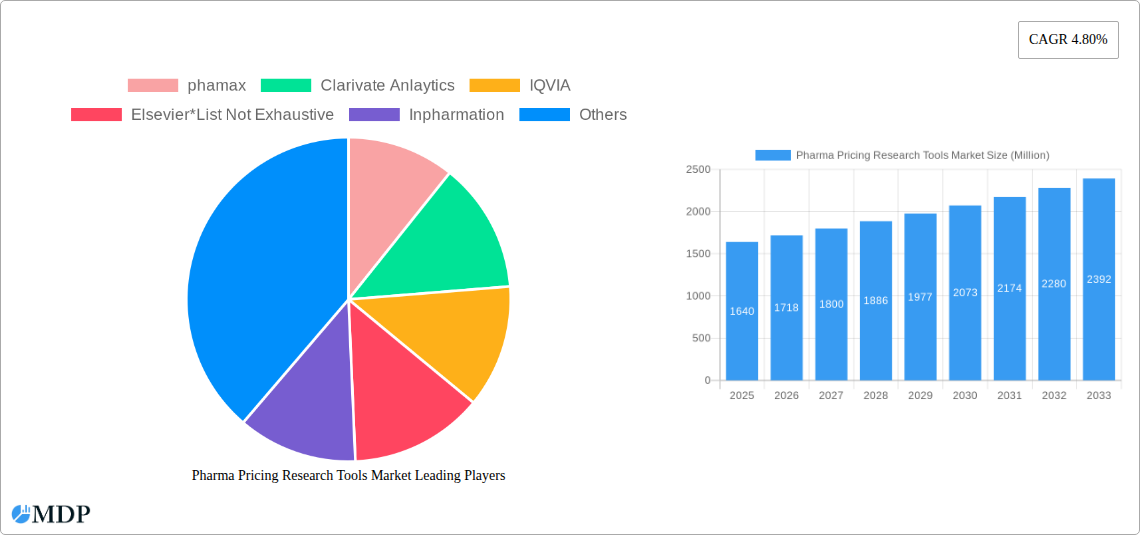
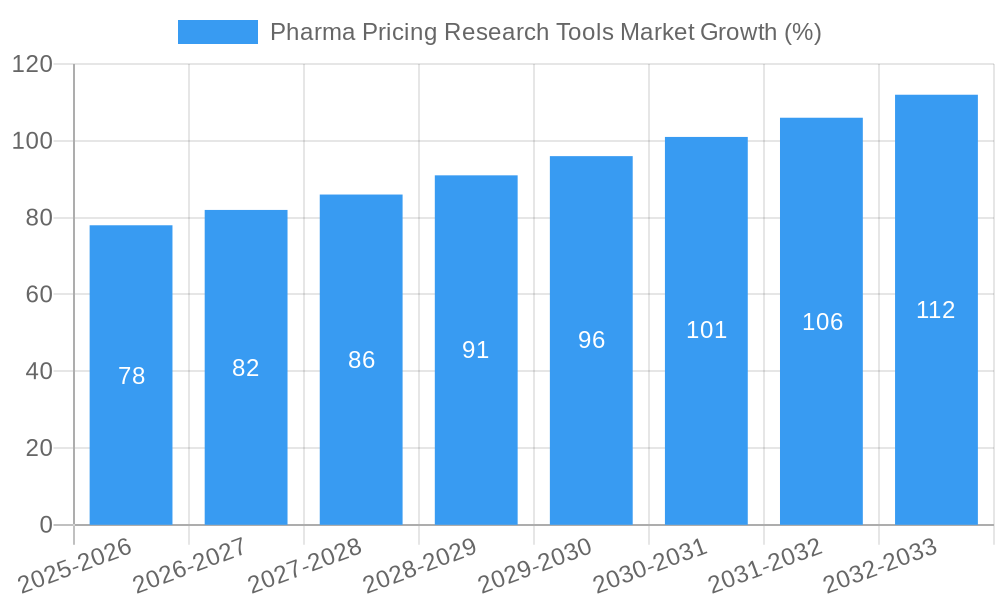
The Pharma Pricing Research Tools market is experiencing robust growth, projected to reach \$1.64 billion in 2025 and expanding at a compound annual growth rate (CAGR) of 4.80% from 2025 to 2033. This growth is fueled by several key drivers. The increasing complexity of pharmaceutical pricing, driven by evolving reimbursement models and regulatory landscapes, necessitates sophisticated tools for effective pricing strategies. Furthermore, the rising demand for data-driven decision-making within pharmaceutical companies is pushing adoption of these research tools. Market segmentation reveals a strong preference for market-based pricing models, largely driven by the need to understand competitor pricing and market dynamics. Prescription drugs constitute a significant portion of the market, reflecting the high cost and complexity associated with this segment. Leading players like IQVIA, Clarivate Analytics, and Elsevier are leveraging their established expertise in data analytics and market research to dominate the market, providing comprehensive solutions that integrate pricing analysis with other aspects of drug development and commercialization. However, challenges remain, including the high cost of these sophisticated tools and the need for continuous data updates to maintain accuracy. Future growth will likely be influenced by advancements in artificial intelligence (AI) and machine learning (ML) technologies that enhance data analysis and predictive modeling capabilities within these tools, allowing for more precise and data-driven pricing strategies.
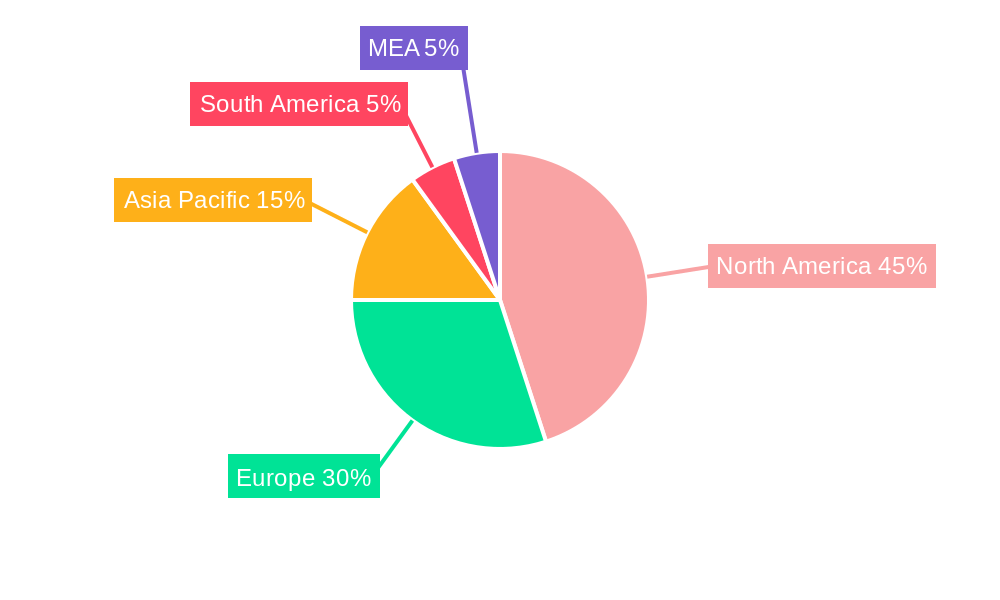
Geographic distribution indicates a significant market presence in North America, fueled by advanced healthcare infrastructure and high adoption rates. Europe follows closely, driven by strong regulatory frameworks and a focus on drug pricing transparency. The Asia-Pacific region is experiencing rapid growth, propelled by the expansion of pharmaceutical markets in emerging economies like China and India. Though North America currently holds the largest market share, the Asia-Pacific region is projected to demonstrate significant growth over the forecast period due to increasing healthcare expenditure and greater investment in pharmaceutical R&D. The competitive landscape is dynamic, with established players continually innovating and smaller companies emerging with specialized solutions. The continuous evolution of pharmaceutical pricing strategies and the growing need for actionable insights will continue to drive the growth of this market in the coming years.
Pharma Pricing Research Tools Market: A Comprehensive Report (2019-2033)
This in-depth report provides a comprehensive analysis of the Pharma Pricing Research Tools Market, offering invaluable insights for stakeholders across the pharmaceutical industry. From market dynamics and leading players to emerging opportunities and future trends, this report is an essential resource for strategic decision-making. The market is projected to reach xx Million by 2033, exhibiting a CAGR of xx% during the forecast period (2025-2033). The study period covers 2019-2033, with 2025 as the base and estimated year.
Pharma Pricing Research Tools Market Market Dynamics & Concentration
The Pharma Pricing Research Tools market exhibits a moderately concentrated landscape, with key players like Phamax, Clarivate Analytics, IQVIA, Elsevier, Inpharmation, Wolters Kluwer N.V., Veeva Systems, and Avalere Health LLC holding significant market share. However, the market is dynamic, driven by continuous innovation in pricing models and analytics tools. Regulatory frameworks, particularly those concerning data privacy and pricing transparency, significantly influence market growth. The presence of substitute tools and evolving end-user preferences (pharma companies increasingly adopting value-based pricing strategies) further shape the competitive landscape.
- Market Concentration: The top 5 players collectively hold approximately xx% of the market share in 2025.
- Innovation Drivers: Advancements in AI, machine learning, and big data analytics are driving the development of sophisticated pricing tools.
- Regulatory Frameworks: Stringent regulations regarding drug pricing and data security impact market growth and product development.
- Product Substitutes: The availability of alternative analytical tools and in-house pricing models presents competitive challenges.
- End-User Trends: A shift towards value-based pricing is creating a strong demand for tools that support this model.
- M&A Activities: The market has witnessed xx M&A deals in the historical period (2019-2024), indicating consolidation and strategic expansion among players.
Pharma Pricing Research Tools Market Industry Trends & Analysis
The Pharma Pricing Research Tools market is experiencing robust growth, propelled by several key factors. The increasing adoption of value-based pricing models by pharmaceutical companies is a major driver, demanding sophisticated tools for accurate pricing and reimbursement analysis. Technological advancements, particularly in AI and machine learning, are enabling the development of more precise and efficient pricing tools, boosting market penetration. Consumer preferences for cost-effective and innovative healthcare solutions indirectly influence the demand for tools that facilitate optimal drug pricing. Competitive dynamics are characterized by continuous product innovation, strategic partnerships, and a growing emphasis on data-driven insights.
- Market Growth Drivers: Value-based pricing, technological advancements, and increasing demand for data-driven decision-making are key drivers.
- Technological Disruptions: AI and machine learning are transforming pricing strategies and analytics capabilities.
- Consumer Preferences: The rising demand for affordable and effective healthcare solutions indirectly influences market growth.
- Competitive Dynamics: Intense competition among established players and emerging startups is shaping market trends.
- Market Penetration: The market penetration rate for advanced pricing tools is expected to reach xx% by 2033.
Leading Markets & Segments in Pharma Pricing Research Tools Market
The North American region currently dominates the Pharma Pricing Research Tools market, driven by robust healthcare infrastructure, favorable regulatory environments, and high adoption rates of advanced technologies. Within segments, the Value-Based Pricing tools segment is experiencing the fastest growth, driven by the industry's transition towards outcome-based reimbursement models. Prescription drugs dominate the application segment due to complex pricing structures and reimbursement processes.
By Type:
- Value-Based Pricing: This segment is expected to witness the highest CAGR during the forecast period due to its increasing adoption by pharmaceutical companies.
- Market-Based Pricing: This segment remains significant, offering tools to analyze market trends and competitive landscapes.
- Cost-Based Pricing: This segment serves as a foundational pricing approach but is witnessing slower growth compared to other segments.
By Application:
- Prescription Drugs: This segment is the largest owing to the complex pricing dynamics and reimbursement processes related to prescription drugs.
- Over-the-counter Drugs: This segment displays steady growth due to increasing demand for data-driven decision making for OTC pricing.
Key Drivers:
- Robust Healthcare Infrastructure (North America): Advanced healthcare systems facilitate the adoption of sophisticated tools.
- Favorable Regulatory Environment (North America): Supportive policies encourage the development and use of pricing tools.
- High Adoption Rates of Advanced Technologies (North America): Early adoption of AI and machine learning boosts market growth.
Pharma Pricing Research Tools Market Product Developments
Recent product developments focus on integrating AI and machine learning to enhance predictive capabilities, improve data analysis, and provide more accurate pricing recommendations. This trend reflects the growing demand for sophisticated tools that can effectively navigate the complexities of value-based pricing. New features such as real-time data integration, advanced simulation modeling, and user-friendly interfaces are enhancing market fit and competitiveness.
Key Drivers of Pharma Pricing Research Tools Market Growth
The market is driven by several key factors: the increasing adoption of value-based pricing models, advancements in AI and machine learning, the growing demand for data-driven decision-making in pharmaceutical pricing, and supportive regulatory environments in key markets. Stringent regulations on drug pricing are also driving the need for advanced analytical tools to optimize pricing strategies within compliance frameworks.
Challenges in the Pharma Pricing Research Tools Market Market
Key challenges include the high cost of implementing advanced pricing tools, the complexity of integrating diverse data sources, and the need for specialized expertise to effectively utilize these tools. Data privacy concerns and stringent regulatory requirements also pose significant hurdles. Competition from established players and emerging startups further complicates the market landscape, impacting profitability for some vendors. These challenges could collectively result in a xx% reduction in market growth if not effectively addressed.
Emerging Opportunities in Pharma Pricing Research Tools Market
Significant opportunities exist in developing tools that integrate real-world evidence (RWE) data into pricing models. Strategic partnerships between technology providers and pharmaceutical companies are also driving innovation and market expansion. Growth in emerging markets and the expansion of value-based pricing models globally present further opportunities for growth.
Leading Players in the Pharma Pricing Research Tools Market Sector
- Phamax
- Clarivate Analytics
- IQVIA
- Elsevier
- Inpharmation
- Wolters Kluwer N.V.
- Veeva Systems
- Avalere Health LLC
Key Milestones in Pharma Pricing Research Tools Market Industry
- 2020: Phamax launches a new AI-powered pricing tool.
- 2021: Clarivate Analytics acquires a smaller analytics firm, expanding its market share.
- 2022: IQVIA releases an updated version of its pricing software with enhanced features.
- 2023: Elsevier integrates RWE data into its pricing analysis platform.
- 2024: Significant regulatory changes impact the market, prompting adjustments in pricing strategies across the industry.
Strategic Outlook for Pharma Pricing Research Tools Market Market
The Pharma Pricing Research Tools market holds significant potential for future growth, driven by increasing demand for data-driven insights and the continued expansion of value-based pricing models. Strategic partnerships, technological advancements, and expansion into emerging markets will play a key role in shaping the future landscape. The market is poised for sustained growth, offering lucrative opportunities for both established players and new entrants.
Pharma Pricing Research Tools Market Segmentation
-
1. Application
- 1.1. Prescription Drugs
- 1.2. Over-the-counter Drugs
-
2. Type
- 2.1. Market-Based Pricing
- 2.2. Value-Based Pricing
- 2.3. Cost-based pricing
Pharma Pricing Research Tools Market Segmentation By Geography
-
1. North America
- 1.1. United States
- 1.2. Canada
- 1.3. Mexico
-
2. Europe
- 2.1. Germany
- 2.2. United Kingdom
- 2.3. France
- 2.4. Italy
- 2.5. Spain
- 2.6. Rest of Europe
- 3. Rest of the World
Pharma Pricing Research Tools Market REPORT HIGHLIGHTS
| Aspects | Details |
|---|---|
| Study Period | 2019-2033 |
| Base Year | 2024 |
| Estimated Year | 2025 |
| Forecast Period | 2025-2033 |
| Historical Period | 2019-2024 |
| Growth Rate | CAGR of 4.80% from 2019-2033 |
| Segmentation |
|
Table of Contents
- 1. Introduction
- 1.1. Research Scope
- 1.2. Market Segmentation
- 1.3. Research Methodology
- 1.4. Definitions and Assumptions
- 2. Executive Summary
- 2.1. Introduction
- 3. Market Dynamics
- 3.1. Introduction
- 3.2. Market Drivers
- 3.2.1. Increasing Complexity of Pharmaceutical Pricing; Rising Demand for Pricing Research & Analytics in Healthcare
- 3.3. Market Restrains
- 3.3.1. Lack of Standardization in Underdeveloped Countries
- 3.4. Market Trends
- 3.4.1. The Over-the-Counter Segment is Expected to Show Healthy Growth Over the Forecast Period
- 4. Market Factor Analysis
- 4.1. Porters Five Forces
- 4.2. Supply/Value Chain
- 4.3. PESTEL analysis
- 4.4. Market Entropy
- 4.5. Patent/Trademark Analysis
- 5. Global Pharma Pricing Research Tools Market Analysis, Insights and Forecast, 2019-2031
- 5.1. Market Analysis, Insights and Forecast - by Application
- 5.1.1. Prescription Drugs
- 5.1.2. Over-the-counter Drugs
- 5.2. Market Analysis, Insights and Forecast - by Type
- 5.2.1. Market-Based Pricing
- 5.2.2. Value-Based Pricing
- 5.2.3. Cost-based pricing
- 5.3. Market Analysis, Insights and Forecast - by Region
- 5.3.1. North America
- 5.3.2. Europe
- 5.3.3. Rest of the World
- 5.1. Market Analysis, Insights and Forecast - by Application
- 6. North America Pharma Pricing Research Tools Market Analysis, Insights and Forecast, 2019-2031
- 6.1. Market Analysis, Insights and Forecast - by Application
- 6.1.1. Prescription Drugs
- 6.1.2. Over-the-counter Drugs
- 6.2. Market Analysis, Insights and Forecast - by Type
- 6.2.1. Market-Based Pricing
- 6.2.2. Value-Based Pricing
- 6.2.3. Cost-based pricing
- 6.1. Market Analysis, Insights and Forecast - by Application
- 7. Europe Pharma Pricing Research Tools Market Analysis, Insights and Forecast, 2019-2031
- 7.1. Market Analysis, Insights and Forecast - by Application
- 7.1.1. Prescription Drugs
- 7.1.2. Over-the-counter Drugs
- 7.2. Market Analysis, Insights and Forecast - by Type
- 7.2.1. Market-Based Pricing
- 7.2.2. Value-Based Pricing
- 7.2.3. Cost-based pricing
- 7.1. Market Analysis, Insights and Forecast - by Application
- 8. Rest of the World Pharma Pricing Research Tools Market Analysis, Insights and Forecast, 2019-2031
- 8.1. Market Analysis, Insights and Forecast - by Application
- 8.1.1. Prescription Drugs
- 8.1.2. Over-the-counter Drugs
- 8.2. Market Analysis, Insights and Forecast - by Type
- 8.2.1. Market-Based Pricing
- 8.2.2. Value-Based Pricing
- 8.2.3. Cost-based pricing
- 8.1. Market Analysis, Insights and Forecast - by Application
- 9. North America Pharma Pricing Research Tools Market Analysis, Insights and Forecast, 2019-2031
- 9.1. Market Analysis, Insights and Forecast - By Country/Sub-region
- 9.1.1 United States
- 9.1.2 Canada
- 9.1.3 Mexico
- 10. Europe Pharma Pricing Research Tools Market Analysis, Insights and Forecast, 2019-2031
- 10.1. Market Analysis, Insights and Forecast - By Country/Sub-region
- 10.1.1 Germany
- 10.1.2 United Kingdom
- 10.1.3 France
- 10.1.4 Spain
- 10.1.5 Italy
- 10.1.6 Spain
- 10.1.7 Belgium
- 10.1.8 Netherland
- 10.1.9 Nordics
- 10.1.10 Rest of Europe
- 11. Asia Pacific Pharma Pricing Research Tools Market Analysis, Insights and Forecast, 2019-2031
- 11.1. Market Analysis, Insights and Forecast - By Country/Sub-region
- 11.1.1 China
- 11.1.2 Japan
- 11.1.3 India
- 11.1.4 South Korea
- 11.1.5 Southeast Asia
- 11.1.6 Australia
- 11.1.7 Indonesia
- 11.1.8 Phillipes
- 11.1.9 Singapore
- 11.1.10 Thailandc
- 11.1.11 Rest of Asia Pacific
- 12. South America Pharma Pricing Research Tools Market Analysis, Insights and Forecast, 2019-2031
- 12.1. Market Analysis, Insights and Forecast - By Country/Sub-region
- 12.1.1 Brazil
- 12.1.2 Argentina
- 12.1.3 Peru
- 12.1.4 Chile
- 12.1.5 Colombia
- 12.1.6 Ecuador
- 12.1.7 Venezuela
- 12.1.8 Rest of South America
- 13. North America Pharma Pricing Research Tools Market Analysis, Insights and Forecast, 2019-2031
- 13.1. Market Analysis, Insights and Forecast - By Country/Sub-region
- 13.1.1 United States
- 13.1.2 Canada
- 13.1.3 Mexico
- 14. MEA Pharma Pricing Research Tools Market Analysis, Insights and Forecast, 2019-2031
- 14.1. Market Analysis, Insights and Forecast - By Country/Sub-region
- 14.1.1 United Arab Emirates
- 14.1.2 Saudi Arabia
- 14.1.3 South Africa
- 14.1.4 Rest of Middle East and Africa
- 15. Competitive Analysis
- 15.1. Global Market Share Analysis 2024
- 15.2. Company Profiles
- 15.2.1 phamax
- 15.2.1.1. Overview
- 15.2.1.2. Products
- 15.2.1.3. SWOT Analysis
- 15.2.1.4. Recent Developments
- 15.2.1.5. Financials (Based on Availability)
- 15.2.2 Clarivate Anlaytics
- 15.2.2.1. Overview
- 15.2.2.2. Products
- 15.2.2.3. SWOT Analysis
- 15.2.2.4. Recent Developments
- 15.2.2.5. Financials (Based on Availability)
- 15.2.3 IQVIA
- 15.2.3.1. Overview
- 15.2.3.2. Products
- 15.2.3.3. SWOT Analysis
- 15.2.3.4. Recent Developments
- 15.2.3.5. Financials (Based on Availability)
- 15.2.4 Elsevier*List Not Exhaustive
- 15.2.4.1. Overview
- 15.2.4.2. Products
- 15.2.4.3. SWOT Analysis
- 15.2.4.4. Recent Developments
- 15.2.4.5. Financials (Based on Availability)
- 15.2.5 Inpharmation
- 15.2.5.1. Overview
- 15.2.5.2. Products
- 15.2.5.3. SWOT Analysis
- 15.2.5.4. Recent Developments
- 15.2.5.5. Financials (Based on Availability)
- 15.2.6 Wolters Kluwer N V
- 15.2.6.1. Overview
- 15.2.6.2. Products
- 15.2.6.3. SWOT Analysis
- 15.2.6.4. Recent Developments
- 15.2.6.5. Financials (Based on Availability)
- 15.2.7 Veeva Systems
- 15.2.7.1. Overview
- 15.2.7.2. Products
- 15.2.7.3. SWOT Analysis
- 15.2.7.4. Recent Developments
- 15.2.7.5. Financials (Based on Availability)
- 15.2.8 Avalere Health LLC
- 15.2.8.1. Overview
- 15.2.8.2. Products
- 15.2.8.3. SWOT Analysis
- 15.2.8.4. Recent Developments
- 15.2.8.5. Financials (Based on Availability)
- 15.2.1 phamax
List of Figures
- Figure 1: Global Pharma Pricing Research Tools Market Revenue Breakdown (Million, %) by Region 2024 & 2032
- Figure 2: North America Pharma Pricing Research Tools Market Revenue (Million), by Country 2024 & 2032
- Figure 3: North America Pharma Pricing Research Tools Market Revenue Share (%), by Country 2024 & 2032
- Figure 4: Europe Pharma Pricing Research Tools Market Revenue (Million), by Country 2024 & 2032
- Figure 5: Europe Pharma Pricing Research Tools Market Revenue Share (%), by Country 2024 & 2032
- Figure 6: Asia Pacific Pharma Pricing Research Tools Market Revenue (Million), by Country 2024 & 2032
- Figure 7: Asia Pacific Pharma Pricing Research Tools Market Revenue Share (%), by Country 2024 & 2032
- Figure 8: South America Pharma Pricing Research Tools Market Revenue (Million), by Country 2024 & 2032
- Figure 9: South America Pharma Pricing Research Tools Market Revenue Share (%), by Country 2024 & 2032
- Figure 10: North America Pharma Pricing Research Tools Market Revenue (Million), by Country 2024 & 2032
- Figure 11: North America Pharma Pricing Research Tools Market Revenue Share (%), by Country 2024 & 2032
- Figure 12: MEA Pharma Pricing Research Tools Market Revenue (Million), by Country 2024 & 2032
- Figure 13: MEA Pharma Pricing Research Tools Market Revenue Share (%), by Country 2024 & 2032
- Figure 14: North America Pharma Pricing Research Tools Market Revenue (Million), by Application 2024 & 2032
- Figure 15: North America Pharma Pricing Research Tools Market Revenue Share (%), by Application 2024 & 2032
- Figure 16: North America Pharma Pricing Research Tools Market Revenue (Million), by Type 2024 & 2032
- Figure 17: North America Pharma Pricing Research Tools Market Revenue Share (%), by Type 2024 & 2032
- Figure 18: North America Pharma Pricing Research Tools Market Revenue (Million), by Country 2024 & 2032
- Figure 19: North America Pharma Pricing Research Tools Market Revenue Share (%), by Country 2024 & 2032
- Figure 20: Europe Pharma Pricing Research Tools Market Revenue (Million), by Application 2024 & 2032
- Figure 21: Europe Pharma Pricing Research Tools Market Revenue Share (%), by Application 2024 & 2032
- Figure 22: Europe Pharma Pricing Research Tools Market Revenue (Million), by Type 2024 & 2032
- Figure 23: Europe Pharma Pricing Research Tools Market Revenue Share (%), by Type 2024 & 2032
- Figure 24: Europe Pharma Pricing Research Tools Market Revenue (Million), by Country 2024 & 2032
- Figure 25: Europe Pharma Pricing Research Tools Market Revenue Share (%), by Country 2024 & 2032
- Figure 26: Rest of the World Pharma Pricing Research Tools Market Revenue (Million), by Application 2024 & 2032
- Figure 27: Rest of the World Pharma Pricing Research Tools Market Revenue Share (%), by Application 2024 & 2032
- Figure 28: Rest of the World Pharma Pricing Research Tools Market Revenue (Million), by Type 2024 & 2032
- Figure 29: Rest of the World Pharma Pricing Research Tools Market Revenue Share (%), by Type 2024 & 2032
- Figure 30: Rest of the World Pharma Pricing Research Tools Market Revenue (Million), by Country 2024 & 2032
- Figure 31: Rest of the World Pharma Pricing Research Tools Market Revenue Share (%), by Country 2024 & 2032
List of Tables
- Table 1: Global Pharma Pricing Research Tools Market Revenue Million Forecast, by Region 2019 & 2032
- Table 2: Global Pharma Pricing Research Tools Market Revenue Million Forecast, by Application 2019 & 2032
- Table 3: Global Pharma Pricing Research Tools Market Revenue Million Forecast, by Type 2019 & 2032
- Table 4: Global Pharma Pricing Research Tools Market Revenue Million Forecast, by Region 2019 & 2032
- Table 5: Global Pharma Pricing Research Tools Market Revenue Million Forecast, by Country 2019 & 2032
- Table 6: United States Pharma Pricing Research Tools Market Revenue (Million) Forecast, by Application 2019 & 2032
- Table 7: Canada Pharma Pricing Research Tools Market Revenue (Million) Forecast, by Application 2019 & 2032
- Table 8: Mexico Pharma Pricing Research Tools Market Revenue (Million) Forecast, by Application 2019 & 2032
- Table 9: Global Pharma Pricing Research Tools Market Revenue Million Forecast, by Country 2019 & 2032
- Table 10: Germany Pharma Pricing Research Tools Market Revenue (Million) Forecast, by Application 2019 & 2032
- Table 11: United Kingdom Pharma Pricing Research Tools Market Revenue (Million) Forecast, by Application 2019 & 2032
- Table 12: France Pharma Pricing Research Tools Market Revenue (Million) Forecast, by Application 2019 & 2032
- Table 13: Spain Pharma Pricing Research Tools Market Revenue (Million) Forecast, by Application 2019 & 2032
- Table 14: Italy Pharma Pricing Research Tools Market Revenue (Million) Forecast, by Application 2019 & 2032
- Table 15: Spain Pharma Pricing Research Tools Market Revenue (Million) Forecast, by Application 2019 & 2032
- Table 16: Belgium Pharma Pricing Research Tools Market Revenue (Million) Forecast, by Application 2019 & 2032
- Table 17: Netherland Pharma Pricing Research Tools Market Revenue (Million) Forecast, by Application 2019 & 2032
- Table 18: Nordics Pharma Pricing Research Tools Market Revenue (Million) Forecast, by Application 2019 & 2032
- Table 19: Rest of Europe Pharma Pricing Research Tools Market Revenue (Million) Forecast, by Application 2019 & 2032
- Table 20: Global Pharma Pricing Research Tools Market Revenue Million Forecast, by Country 2019 & 2032
- Table 21: China Pharma Pricing Research Tools Market Revenue (Million) Forecast, by Application 2019 & 2032
- Table 22: Japan Pharma Pricing Research Tools Market Revenue (Million) Forecast, by Application 2019 & 2032
- Table 23: India Pharma Pricing Research Tools Market Revenue (Million) Forecast, by Application 2019 & 2032
- Table 24: South Korea Pharma Pricing Research Tools Market Revenue (Million) Forecast, by Application 2019 & 2032
- Table 25: Southeast Asia Pharma Pricing Research Tools Market Revenue (Million) Forecast, by Application 2019 & 2032
- Table 26: Australia Pharma Pricing Research Tools Market Revenue (Million) Forecast, by Application 2019 & 2032
- Table 27: Indonesia Pharma Pricing Research Tools Market Revenue (Million) Forecast, by Application 2019 & 2032
- Table 28: Phillipes Pharma Pricing Research Tools Market Revenue (Million) Forecast, by Application 2019 & 2032
- Table 29: Singapore Pharma Pricing Research Tools Market Revenue (Million) Forecast, by Application 2019 & 2032
- Table 30: Thailandc Pharma Pricing Research Tools Market Revenue (Million) Forecast, by Application 2019 & 2032
- Table 31: Rest of Asia Pacific Pharma Pricing Research Tools Market Revenue (Million) Forecast, by Application 2019 & 2032
- Table 32: Global Pharma Pricing Research Tools Market Revenue Million Forecast, by Country 2019 & 2032
- Table 33: Brazil Pharma Pricing Research Tools Market Revenue (Million) Forecast, by Application 2019 & 2032
- Table 34: Argentina Pharma Pricing Research Tools Market Revenue (Million) Forecast, by Application 2019 & 2032
- Table 35: Peru Pharma Pricing Research Tools Market Revenue (Million) Forecast, by Application 2019 & 2032
- Table 36: Chile Pharma Pricing Research Tools Market Revenue (Million) Forecast, by Application 2019 & 2032
- Table 37: Colombia Pharma Pricing Research Tools Market Revenue (Million) Forecast, by Application 2019 & 2032
- Table 38: Ecuador Pharma Pricing Research Tools Market Revenue (Million) Forecast, by Application 2019 & 2032
- Table 39: Venezuela Pharma Pricing Research Tools Market Revenue (Million) Forecast, by Application 2019 & 2032
- Table 40: Rest of South America Pharma Pricing Research Tools Market Revenue (Million) Forecast, by Application 2019 & 2032
- Table 41: Global Pharma Pricing Research Tools Market Revenue Million Forecast, by Country 2019 & 2032
- Table 42: United States Pharma Pricing Research Tools Market Revenue (Million) Forecast, by Application 2019 & 2032
- Table 43: Canada Pharma Pricing Research Tools Market Revenue (Million) Forecast, by Application 2019 & 2032
- Table 44: Mexico Pharma Pricing Research Tools Market Revenue (Million) Forecast, by Application 2019 & 2032
- Table 45: Global Pharma Pricing Research Tools Market Revenue Million Forecast, by Country 2019 & 2032
- Table 46: United Arab Emirates Pharma Pricing Research Tools Market Revenue (Million) Forecast, by Application 2019 & 2032
- Table 47: Saudi Arabia Pharma Pricing Research Tools Market Revenue (Million) Forecast, by Application 2019 & 2032
- Table 48: South Africa Pharma Pricing Research Tools Market Revenue (Million) Forecast, by Application 2019 & 2032
- Table 49: Rest of Middle East and Africa Pharma Pricing Research Tools Market Revenue (Million) Forecast, by Application 2019 & 2032
- Table 50: Global Pharma Pricing Research Tools Market Revenue Million Forecast, by Application 2019 & 2032
- Table 51: Global Pharma Pricing Research Tools Market Revenue Million Forecast, by Type 2019 & 2032
- Table 52: Global Pharma Pricing Research Tools Market Revenue Million Forecast, by Country 2019 & 2032
- Table 53: United States Pharma Pricing Research Tools Market Revenue (Million) Forecast, by Application 2019 & 2032
- Table 54: Canada Pharma Pricing Research Tools Market Revenue (Million) Forecast, by Application 2019 & 2032
- Table 55: Mexico Pharma Pricing Research Tools Market Revenue (Million) Forecast, by Application 2019 & 2032
- Table 56: Global Pharma Pricing Research Tools Market Revenue Million Forecast, by Application 2019 & 2032
- Table 57: Global Pharma Pricing Research Tools Market Revenue Million Forecast, by Type 2019 & 2032
- Table 58: Global Pharma Pricing Research Tools Market Revenue Million Forecast, by Country 2019 & 2032
- Table 59: Germany Pharma Pricing Research Tools Market Revenue (Million) Forecast, by Application 2019 & 2032
- Table 60: United Kingdom Pharma Pricing Research Tools Market Revenue (Million) Forecast, by Application 2019 & 2032
- Table 61: France Pharma Pricing Research Tools Market Revenue (Million) Forecast, by Application 2019 & 2032
- Table 62: Italy Pharma Pricing Research Tools Market Revenue (Million) Forecast, by Application 2019 & 2032
- Table 63: Spain Pharma Pricing Research Tools Market Revenue (Million) Forecast, by Application 2019 & 2032
- Table 64: Rest of Europe Pharma Pricing Research Tools Market Revenue (Million) Forecast, by Application 2019 & 2032
- Table 65: Global Pharma Pricing Research Tools Market Revenue Million Forecast, by Application 2019 & 2032
- Table 66: Global Pharma Pricing Research Tools Market Revenue Million Forecast, by Type 2019 & 2032
- Table 67: Global Pharma Pricing Research Tools Market Revenue Million Forecast, by Country 2019 & 2032
Frequently Asked Questions
1. What is the projected Compound Annual Growth Rate (CAGR) of the Pharma Pricing Research Tools Market?
The projected CAGR is approximately 4.80%.
2. Which companies are prominent players in the Pharma Pricing Research Tools Market?
Key companies in the market include phamax, Clarivate Anlaytics, IQVIA, Elsevier*List Not Exhaustive, Inpharmation, Wolters Kluwer N V, Veeva Systems, Avalere Health LLC.
3. What are the main segments of the Pharma Pricing Research Tools Market?
The market segments include Application, Type.
4. Can you provide details about the market size?
The market size is estimated to be USD 1.64 Million as of 2022.
5. What are some drivers contributing to market growth?
Increasing Complexity of Pharmaceutical Pricing; Rising Demand for Pricing Research & Analytics in Healthcare.
6. What are the notable trends driving market growth?
The Over-the-Counter Segment is Expected to Show Healthy Growth Over the Forecast Period.
7. Are there any restraints impacting market growth?
Lack of Standardization in Underdeveloped Countries.
8. Can you provide examples of recent developments in the market?
N/A
9. What pricing options are available for accessing the report?
Pricing options include single-user, multi-user, and enterprise licenses priced at USD 4750, USD 5250, and USD 8750 respectively.
10. Is the market size provided in terms of value or volume?
The market size is provided in terms of value, measured in Million.
11. Are there any specific market keywords associated with the report?
Yes, the market keyword associated with the report is "Pharma Pricing Research Tools Market," which aids in identifying and referencing the specific market segment covered.
12. How do I determine which pricing option suits my needs best?
The pricing options vary based on user requirements and access needs. Individual users may opt for single-user licenses, while businesses requiring broader access may choose multi-user or enterprise licenses for cost-effective access to the report.
13. Are there any additional resources or data provided in the Pharma Pricing Research Tools Market report?
While the report offers comprehensive insights, it's advisable to review the specific contents or supplementary materials provided to ascertain if additional resources or data are available.
14. How can I stay updated on further developments or reports in the Pharma Pricing Research Tools Market?
To stay informed about further developments, trends, and reports in the Pharma Pricing Research Tools Market, consider subscribing to industry newsletters, following relevant companies and organizations, or regularly checking reputable industry news sources and publications.
Methodology
Step 1 - Identification of Relevant Samples Size from Population Database


Step 2 - Approaches for Defining Global Market Size (Value, Volume* & Price*)

Note*: In applicable scenarios
Step 3 - Data Sources
Primary Research
- Web Analytics
- Survey Reports
- Research Institute
- Latest Research Reports
- Opinion Leaders
Secondary Research
- Annual Reports
- White Paper
- Latest Press Release
- Industry Association
- Paid Database
- Investor Presentations

Step 4 - Data Triangulation
Involves using different sources of information in order to increase the validity of a study
These sources are likely to be stakeholders in a program - participants, other researchers, program staff, other community members, and so on.
Then we put all data in single framework & apply various statistical tools to find out the dynamic on the market.
During the analysis stage, feedback from the stakeholder groups would be compared to determine areas of agreement as well as areas of divergence
