

Key Insights
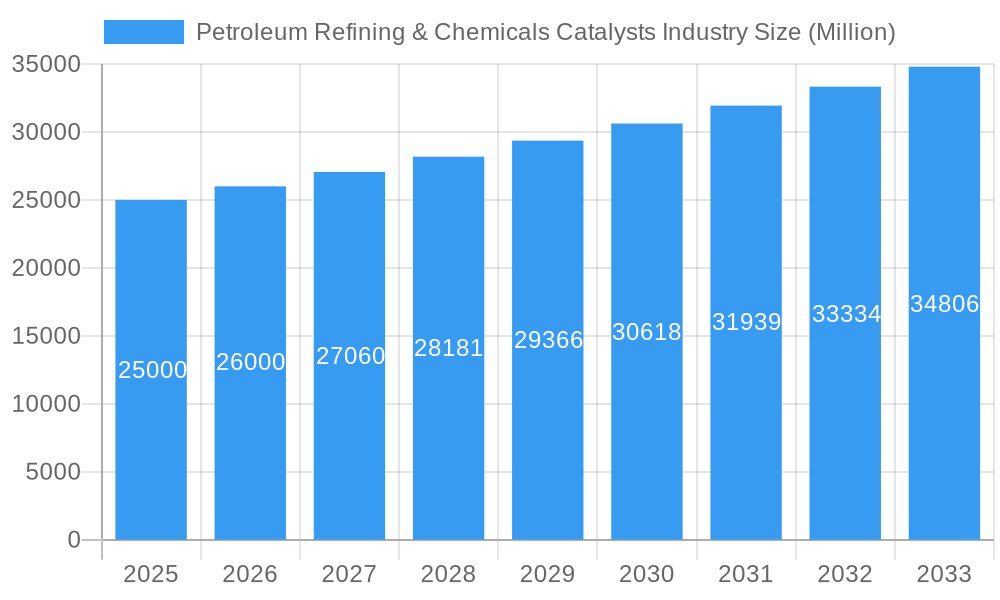
The Petroleum Refining & Chemicals Catalysts market is poised for substantial expansion, driven by escalating demand for refined petroleum products and the robust growth of the petrochemical sector. With a projected Compound Annual Growth Rate (CAGR) of 4.3%, the market is anticipated to reach a value of 10096.57 million by 2025. Key growth catalysts include surging global energy consumption, particularly in emerging economies across the Asia-Pacific region, and the implementation of stringent environmental regulations mandating cleaner and more efficient refining operations. This regulatory landscape necessitates the adoption of advanced catalysts to optimize production yields, minimize emissions, and enhance product quality.
Petroleum Refining & Chemicals Catalysts Industry Market Size (In Billion)
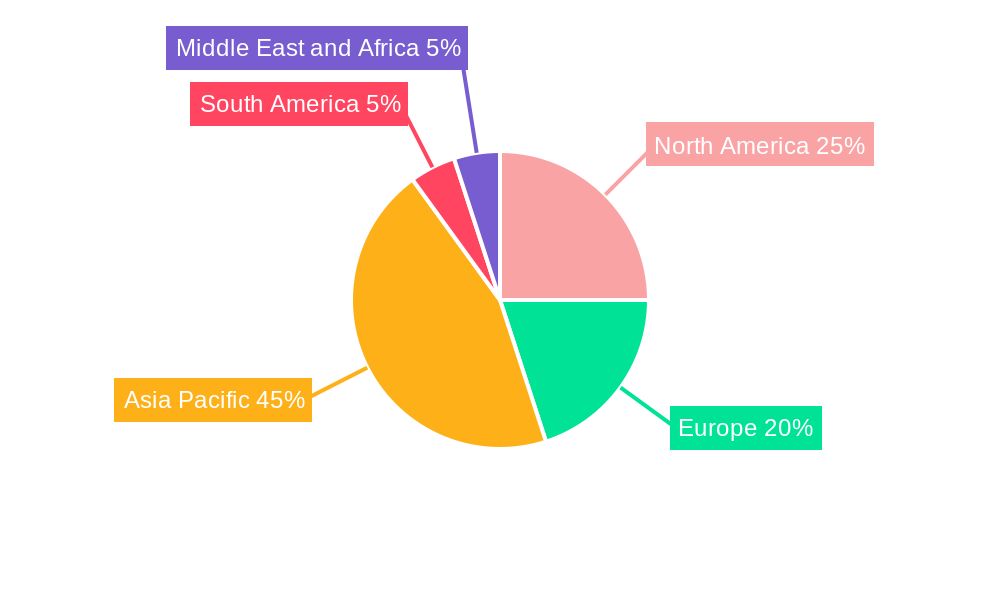
The market is segmented by application (petroleum refining, isomerization, synthesis gas processes, polymerization), material type (metals and organometallic catalysts, metallic compounds, aluminosilicates, molecular sieves, other chemical compounds), and geography. The Asia-Pacific region, led by China and India, is expected to lead market growth due to significant investments in refinery expansions and petrochemical facilities. North America and Europe will maintain substantial market shares, supported by established catalyst manufacturers and extensive refining capacities. Potential market restraints include price volatility of raw materials, rigorous safety regulations, and the disruptive potential of alternative catalyst technologies. However, the overall market outlook remains optimistic, propelled by ongoing innovation and increasing global energy requirements.
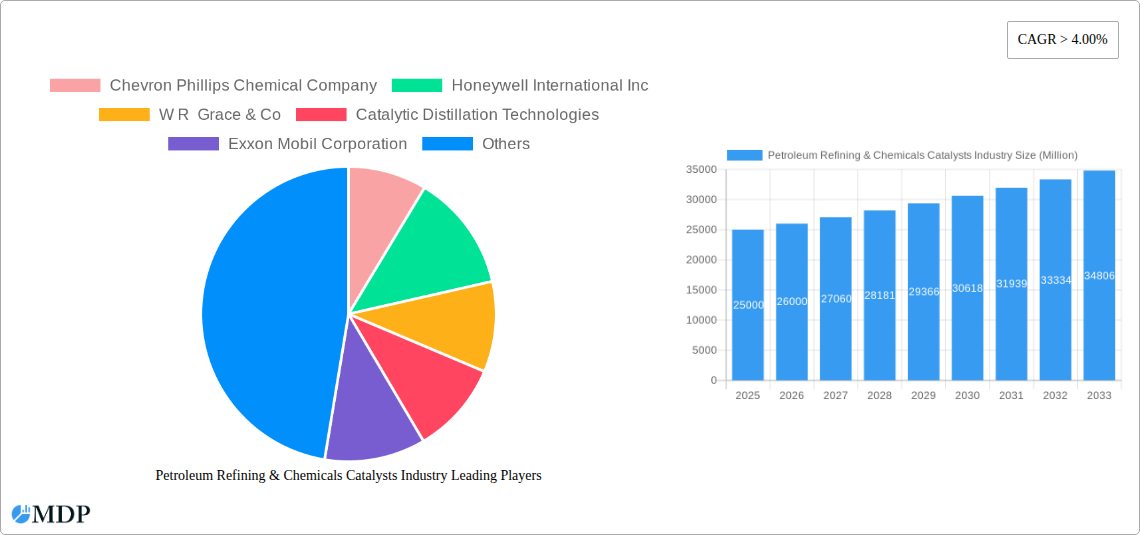
Petroleum Refining & Chemicals Catalysts Industry Company Market Share
The competitive environment features a dynamic interplay between large multinational corporations and specialized catalyst providers. Intense research and development efforts are focused on enhancing catalyst performance, efficiency, and durability. Strategic collaborations, mergers, and acquisitions are instrumental in expanding market reach and acquiring novel technologies. Future market expansion will be significantly influenced by technological advancements in catalyst design, including the development of more selective, active, and environmentally benign catalysts. The increasing emphasis on sustainability and circular economy principles will further fuel demand for catalysts that reduce waste and energy consumption in petroleum refining and chemical production. The introduction of novel catalyst materials and refined manufacturing processes will also contribute to the market's growth trajectory. Continuous innovation in catalyst technology, coupled with expanding global demand for refined petroleum products and petrochemicals, establishes a strong foundation for sustained market growth.
Petroleum Refining & Chemicals Catalysts Industry: A Comprehensive Market Report (2019-2033)
This comprehensive report provides an in-depth analysis of the global Petroleum Refining & Chemicals Catalysts industry, covering market dynamics, leading players, emerging trends, and future growth prospects. The study period spans from 2019 to 2033, with a base year of 2025 and a forecast period of 2025-2033. This report is essential for industry stakeholders, investors, and researchers seeking actionable insights into this dynamic market. The global market size in 2025 is estimated at $XX Million.
Petroleum Refining & Chemicals Catalysts Industry Market Dynamics & Concentration
The Petroleum Refining & Chemicals Catalysts market is characterized by a moderately concentrated landscape with a few major players holding significant market share. In 2025, the top five companies are estimated to control approximately 45% of the global market. Innovation is a key driver, with companies investing heavily in R&D to develop more efficient and sustainable catalysts. Stringent environmental regulations are shaping the industry, pushing for catalysts that minimize emissions and improve process efficiency. The market also faces pressure from substitute technologies and evolving end-user preferences towards greener solutions. M&A activity has been relatively moderate in recent years, with approximately xx major deals concluded between 2019 and 2024. This trend reflects both consolidation efforts and strategic acquisitions to expand product portfolios and geographic reach.
- Market Concentration: Top 5 companies hold ~45% market share (2025 est.)
- Innovation Drivers: R&D investments in efficient and sustainable catalysts.
- Regulatory Framework: Stringent environmental regulations driving innovation.
- Product Substitutes: Pressure from alternative technologies.
- End-User Trends: Growing demand for environmentally friendly solutions.
- M&A Activity: Approx. xx major deals (2019-2024).
Petroleum Refining & Chemicals Catalysts Industry Industry Trends & Analysis
The Petroleum Refining & Chemicals Catalysts market is projected to experience a CAGR of xx% during the forecast period (2025-2033), driven by several key factors. Increasing demand for petrochemicals and refined petroleum products, particularly in developing economies, fuels market growth. Technological advancements, such as the development of more selective and active catalysts, are enhancing process efficiency and reducing production costs. Consumer preferences are shifting towards higher-quality products with improved performance and environmental sustainability, driving innovation in catalyst design. Intense competition among established players and new entrants is further stimulating innovation and market expansion. Market penetration of new catalyst technologies varies depending on the application, with some seeing rapid adoption while others face slower penetration due to technical or economic barriers.
Leading Markets & Segments in Petroleum Refining & Chemicals Catalysts Industry
The Asia-Pacific region is the dominant market for Petroleum Refining & Chemicals Catalysts, driven by rapid industrialization and expanding petrochemical production capacity. Within applications, Petroleum Refining constitutes the largest segment, followed by Chemical Synthesis (Isomerization and Polymerization). Metals and Organometallic Catalysts are the leading material type, followed by Aluminosilicates and Molecular Sieves.
Key Drivers in Asia-Pacific: Rapid industrialization, expanding petrochemical capacity, supportive government policies.
Petroleum Refining Segment Dominance: Driven by high demand for refined fuels and lubricants.
Metals and Organometallic Catalysts: High performance and versatility.
Aluminosilicates and Molecular Sieves: Wide applications in various refining and chemical processes.
Detailed Dominance Analysis (Paragraph): The Asia-Pacific region's dominance stems from its robust economic growth, substantial investments in refining and petrochemical infrastructure, and increasing energy consumption. This has created significant demand for catalysts across various applications, fueling market expansion. While other regions like North America and Europe continue to be important markets, their growth rate is relatively slower compared to the Asia-Pacific region.
Petroleum Refining & Chemicals Catalysts Industry Product Developments
Recent product innovations focus on enhancing catalyst selectivity, activity, and lifespan. New catalysts with improved resistance to deactivation and improved environmental performance are gaining traction. These advancements aim to optimize process efficiency, reduce waste generation, and minimize environmental impact, aligning with stringent environmental regulations and the growing demand for sustainable solutions. The development of customized catalysts tailored to specific applications provides a competitive advantage, enabling manufacturers to offer optimized solutions for various refining and chemical processes.
Key Drivers of Petroleum Refining & Chemicals Catalysts Industry Growth
The Petroleum Refining & Chemicals Catalysts industry's growth is propelled by several key factors. Firstly, increasing global demand for petroleum products and petrochemicals drives the need for efficient catalysts. Secondly, technological advancements leading to more efficient and sustainable catalysts are boosting market growth. Finally, stringent environmental regulations necessitate the use of cleaner catalysts, further fueling market demand.
Challenges in the Petroleum Refining & Chemicals Catalysts Industry Market
The industry faces challenges such as fluctuating raw material prices impacting production costs, stringent environmental regulations imposing compliance burdens, and intense competition leading to price pressures. Supply chain disruptions due to geopolitical events can also affect availability and pricing.
Emerging Opportunities in Petroleum Refining & Chemicals Catalysts Industry
Significant opportunities exist in developing innovative catalyst technologies for biofuel production and sustainable chemical synthesis. Strategic partnerships to leverage technological expertise and expand market reach, as well as exploring new markets in developing economies, promise long-term growth.
Leading Players in the Petroleum Refining & Chemicals Catalysts Industry Sector
- Chevron Phillips Chemical Company
- Honeywell International Inc
- W R Grace & Co
- Catalytic Distillation Technologies
- Exxon Mobil Corporation
- INEOS Technologies
- Johnson Matthey Inc
- Evonik Industries AG
- Wako Chemicals USA Inc
- KBR Inc
- BASF SE
- Eka Chemicals AB
- Zeochem LLC
- Zeolyst International
- Chicago Bridge & Iron Company
- Dow
- Bayer Technology Services
- Nova Chemicals Corp
- Clariant International Ltd
- Eastman Chemical Co
Key Milestones in Petroleum Refining & Chemicals Catalysts Industry Industry
- 2020: Launch of a new generation of high-performance catalysts by Company X, significantly improving efficiency in petroleum refining.
- 2022: Merger between Company Y and Company Z, creating a larger player with an expanded product portfolio.
- 2023: Introduction of stricter environmental regulations in Region A, stimulating the demand for eco-friendly catalysts.
- 2024: Development of a novel catalyst by Company W, enabling the production of a new type of biofuel.
Strategic Outlook for Petroleum Refining & Chemicals Catalysts Industry Market
The future of the Petroleum Refining & Chemicals Catalysts market is promising, driven by continued growth in petrochemical demand, technological innovations, and a focus on sustainability. Strategic partnerships, investments in R&D, and expansion into emerging markets will be crucial for sustained success. The industry's commitment to developing cleaner and more efficient catalysts will be key to meeting the evolving needs of the global market.
Petroleum Refining & Chemicals Catalysts Industry Segmentation
-
1. Material
-
1.1. Metals and Organometallic Catalysts
- 1.1.1. Inexpensive Metals
- 1.1.2. Precious Metals
- 1.1.3. Metallic Compounds
-
1.2. Aluminosilicates
- 1.2.1. Zeolites
- 1.2.2. Molecular Sieves
-
1.3. Chemical Compounds
- 1.3.1. Peroxides
- 1.3.2. Acids
- 1.3.3. Amines
- 1.3.4. Other Chemical Compounds
- 1.4. Other Materials
-
1.1. Metals and Organometallic Catalysts
-
2. Application
-
2.1. Petroleum Refining
- 2.1.1. Fluid Catalytic Cracking (FCC)
- 2.1.2. Hydrocracking
- 2.1.3. Hydrotreating
- 2.1.4. Alkylation
- 2.1.5. Reforming
- 2.1.6. Isomerization
-
2.2. Chemical Synthesis
- 2.2.1. Organic Synthesis
- 2.2.2. Oxidation
- 2.2.3. Hydrogenation
- 2.2.4. Dehydrogenation
- 2.2.5. Synthesis Gas Processes
-
2.3. Polymerization
- 2.3.1. Polyolefins
- 2.3.2. Condensation Polymers
- 2.3.3. Thermosetting Polymers
- 2.3.4. Additional Polymers
-
2.1. Petroleum Refining
Petroleum Refining & Chemicals Catalysts Industry Segmentation By Geography
-
1. Asia Pacific
- 1.1. China
- 1.2. India
- 1.3. Japan
- 1.4. South Korea
- 1.5. ASEAN Countries
- 1.6. Rest of Asia Pacific
-
2. North America
- 2.1. United States
- 2.2. Canada
- 2.3. Mexico
-
3. Europe
- 3.1. Germany
- 3.2. United Kingdom
- 3.3. Italy
- 3.4. France
- 3.5. Rest of Europe
-
4. South America
- 4.1. Brazil
- 4.2. Argentina
- 4.3. Rest of South America
-
5. Middle East and Africa
- 5.1. Saudi Arabia
- 5.2. South Africa
- 5.3. Rest of Middle East and Africa
Petroleum Refining & Chemicals Catalysts Industry Regional Market Share
Geographic Coverage of Petroleum Refining & Chemicals Catalysts Industry
Petroleum Refining & Chemicals Catalysts Industry REPORT HIGHLIGHTS
| Aspects | Details |
|---|---|
| Study Period | 2020-2034 |
| Base Year | 2025 |
| Estimated Year | 2026 |
| Forecast Period | 2026-2034 |
| Historical Period | 2020-2025 |
| Growth Rate | CAGR of 4.3% from 2020-2034 |
| Segmentation |
|
Table of Contents
- 1. Introduction
- 1.1. Research Scope
- 1.2. Market Segmentation
- 1.3. Research Objective
- 1.4. Definitions and Assumptions
- 2. Executive Summary
- 2.1. Market Snapshot
- 3. Market Dynamics
- 3.1. Market Drivers
- 3.2. Market Restrains
- 3.3. Market Trends
- 3.4. Market Opportunities
- 4. Market Factor Analysis
- 4.1. Porters Five Forces
- 4.1.1. Bargaining Power of Suppliers
- 4.1.2. Bargaining Power of Buyers
- 4.1.3. Threat of New Entrants
- 4.1.4. Threat of Substitutes
- 4.1.5. Competitive Rivalry
- 4.2. PESTEL analysis
- 4.3. BCG Analysis
- 4.3.1. Stars (High Growth, High Market Share)
- 4.3.2. Cash Cows (Low Growth, High Market Share)
- 4.3.3. Question Mark (High Growth, Low Market Share)
- 4.3.4. Dogs (Low Growth, Low Market Share)
- 4.4. Ansoff Matrix Analysis
- 4.5. Supply Chain Analysis
- 4.6. Regulatory Landscape
- 4.7. Current Market Potential and Opportunity Assessment (TAM–SAM–SOM Framework)
- 4.8. MDP Analyst Note
- 4.1. Porters Five Forces
- 5. Market Analysis, Insights and Forecast 2021-2033
- 5.1. Market Analysis, Insights and Forecast - by Material
- 5.1.1. Metals and Organometallic Catalysts
- 5.1.1.1. Inexpensive Metals
- 5.1.1.2. Precious Metals
- 5.1.1.3. Metallic Compounds
- 5.1.2. Aluminosilicates
- 5.1.2.1. Zeolites
- 5.1.2.2. Molecular Sieves
- 5.1.3. Chemical Compounds
- 5.1.3.1. Peroxides
- 5.1.3.2. Acids
- 5.1.3.3. Amines
- 5.1.3.4. Other Chemical Compounds
- 5.1.4. Other Materials
- 5.1.1. Metals and Organometallic Catalysts
- 5.2. Market Analysis, Insights and Forecast - by Application
- 5.2.1. Petroleum Refining
- 5.2.1.1. Fluid Catalytic Cracking (FCC)
- 5.2.1.2. Hydrocracking
- 5.2.1.3. Hydrotreating
- 5.2.1.4. Alkylation
- 5.2.1.5. Reforming
- 5.2.1.6. Isomerization
- 5.2.2. Chemical Synthesis
- 5.2.2.1. Organic Synthesis
- 5.2.2.2. Oxidation
- 5.2.2.3. Hydrogenation
- 5.2.2.4. Dehydrogenation
- 5.2.2.5. Synthesis Gas Processes
- 5.2.3. Polymerization
- 5.2.3.1. Polyolefins
- 5.2.3.2. Condensation Polymers
- 5.2.3.3. Thermosetting Polymers
- 5.2.3.4. Additional Polymers
- 5.2.1. Petroleum Refining
- 5.3. Market Analysis, Insights and Forecast - by Region
- 5.3.1. Asia Pacific
- 5.3.2. North America
- 5.3.3. Europe
- 5.3.4. South America
- 5.3.5. Middle East and Africa
- 5.1. Market Analysis, Insights and Forecast - by Material
- 6. Global Petroleum Refining & Chemicals Catalysts Industry Analysis, Insights and Forecast, 2021-2033
- 6.1. Market Analysis, Insights and Forecast - by Material
- 6.1.1. Metals and Organometallic Catalysts
- 6.1.1.1. Inexpensive Metals
- 6.1.1.2. Precious Metals
- 6.1.1.3. Metallic Compounds
- 6.1.2. Aluminosilicates
- 6.1.2.1. Zeolites
- 6.1.2.2. Molecular Sieves
- 6.1.3. Chemical Compounds
- 6.1.3.1. Peroxides
- 6.1.3.2. Acids
- 6.1.3.3. Amines
- 6.1.3.4. Other Chemical Compounds
- 6.1.4. Other Materials
- 6.1.1. Metals and Organometallic Catalysts
- 6.2. Market Analysis, Insights and Forecast - by Application
- 6.2.1. Petroleum Refining
- 6.2.1.1. Fluid Catalytic Cracking (FCC)
- 6.2.1.2. Hydrocracking
- 6.2.1.3. Hydrotreating
- 6.2.1.4. Alkylation
- 6.2.1.5. Reforming
- 6.2.1.6. Isomerization
- 6.2.2. Chemical Synthesis
- 6.2.2.1. Organic Synthesis
- 6.2.2.2. Oxidation
- 6.2.2.3. Hydrogenation
- 6.2.2.4. Dehydrogenation
- 6.2.2.5. Synthesis Gas Processes
- 6.2.3. Polymerization
- 6.2.3.1. Polyolefins
- 6.2.3.2. Condensation Polymers
- 6.2.3.3. Thermosetting Polymers
- 6.2.3.4. Additional Polymers
- 6.2.1. Petroleum Refining
- 6.1. Market Analysis, Insights and Forecast - by Material
- 7. Asia Pacific Petroleum Refining & Chemicals Catalysts Industry Analysis, Insights and Forecast, 2020-2032
- 7.1. Market Analysis, Insights and Forecast - by Material
- 7.1.1. Metals and Organometallic Catalysts
- 7.1.1.1. Inexpensive Metals
- 7.1.1.2. Precious Metals
- 7.1.1.3. Metallic Compounds
- 7.1.2. Aluminosilicates
- 7.1.2.1. Zeolites
- 7.1.2.2. Molecular Sieves
- 7.1.3. Chemical Compounds
- 7.1.3.1. Peroxides
- 7.1.3.2. Acids
- 7.1.3.3. Amines
- 7.1.3.4. Other Chemical Compounds
- 7.1.4. Other Materials
- 7.1.1. Metals and Organometallic Catalysts
- 7.2. Market Analysis, Insights and Forecast - by Application
- 7.2.1. Petroleum Refining
- 7.2.1.1. Fluid Catalytic Cracking (FCC)
- 7.2.1.2. Hydrocracking
- 7.2.1.3. Hydrotreating
- 7.2.1.4. Alkylation
- 7.2.1.5. Reforming
- 7.2.1.6. Isomerization
- 7.2.2. Chemical Synthesis
- 7.2.2.1. Organic Synthesis
- 7.2.2.2. Oxidation
- 7.2.2.3. Hydrogenation
- 7.2.2.4. Dehydrogenation
- 7.2.2.5. Synthesis Gas Processes
- 7.2.3. Polymerization
- 7.2.3.1. Polyolefins
- 7.2.3.2. Condensation Polymers
- 7.2.3.3. Thermosetting Polymers
- 7.2.3.4. Additional Polymers
- 7.2.1. Petroleum Refining
- 7.1. Market Analysis, Insights and Forecast - by Material
- 8. North America Petroleum Refining & Chemicals Catalysts Industry Analysis, Insights and Forecast, 2020-2032
- 8.1. Market Analysis, Insights and Forecast - by Material
- 8.1.1. Metals and Organometallic Catalysts
- 8.1.1.1. Inexpensive Metals
- 8.1.1.2. Precious Metals
- 8.1.1.3. Metallic Compounds
- 8.1.2. Aluminosilicates
- 8.1.2.1. Zeolites
- 8.1.2.2. Molecular Sieves
- 8.1.3. Chemical Compounds
- 8.1.3.1. Peroxides
- 8.1.3.2. Acids
- 8.1.3.3. Amines
- 8.1.3.4. Other Chemical Compounds
- 8.1.4. Other Materials
- 8.1.1. Metals and Organometallic Catalysts
- 8.2. Market Analysis, Insights and Forecast - by Application
- 8.2.1. Petroleum Refining
- 8.2.1.1. Fluid Catalytic Cracking (FCC)
- 8.2.1.2. Hydrocracking
- 8.2.1.3. Hydrotreating
- 8.2.1.4. Alkylation
- 8.2.1.5. Reforming
- 8.2.1.6. Isomerization
- 8.2.2. Chemical Synthesis
- 8.2.2.1. Organic Synthesis
- 8.2.2.2. Oxidation
- 8.2.2.3. Hydrogenation
- 8.2.2.4. Dehydrogenation
- 8.2.2.5. Synthesis Gas Processes
- 8.2.3. Polymerization
- 8.2.3.1. Polyolefins
- 8.2.3.2. Condensation Polymers
- 8.2.3.3. Thermosetting Polymers
- 8.2.3.4. Additional Polymers
- 8.2.1. Petroleum Refining
- 8.1. Market Analysis, Insights and Forecast - by Material
- 9. Europe Petroleum Refining & Chemicals Catalysts Industry Analysis, Insights and Forecast, 2020-2032
- 9.1. Market Analysis, Insights and Forecast - by Material
- 9.1.1. Metals and Organometallic Catalysts
- 9.1.1.1. Inexpensive Metals
- 9.1.1.2. Precious Metals
- 9.1.1.3. Metallic Compounds
- 9.1.2. Aluminosilicates
- 9.1.2.1. Zeolites
- 9.1.2.2. Molecular Sieves
- 9.1.3. Chemical Compounds
- 9.1.3.1. Peroxides
- 9.1.3.2. Acids
- 9.1.3.3. Amines
- 9.1.3.4. Other Chemical Compounds
- 9.1.4. Other Materials
- 9.1.1. Metals and Organometallic Catalysts
- 9.2. Market Analysis, Insights and Forecast - by Application
- 9.2.1. Petroleum Refining
- 9.2.1.1. Fluid Catalytic Cracking (FCC)
- 9.2.1.2. Hydrocracking
- 9.2.1.3. Hydrotreating
- 9.2.1.4. Alkylation
- 9.2.1.5. Reforming
- 9.2.1.6. Isomerization
- 9.2.2. Chemical Synthesis
- 9.2.2.1. Organic Synthesis
- 9.2.2.2. Oxidation
- 9.2.2.3. Hydrogenation
- 9.2.2.4. Dehydrogenation
- 9.2.2.5. Synthesis Gas Processes
- 9.2.3. Polymerization
- 9.2.3.1. Polyolefins
- 9.2.3.2. Condensation Polymers
- 9.2.3.3. Thermosetting Polymers
- 9.2.3.4. Additional Polymers
- 9.2.1. Petroleum Refining
- 9.1. Market Analysis, Insights and Forecast - by Material
- 10. South America Petroleum Refining & Chemicals Catalysts Industry Analysis, Insights and Forecast, 2020-2032
- 10.1. Market Analysis, Insights and Forecast - by Material
- 10.1.1. Metals and Organometallic Catalysts
- 10.1.1.1. Inexpensive Metals
- 10.1.1.2. Precious Metals
- 10.1.1.3. Metallic Compounds
- 10.1.2. Aluminosilicates
- 10.1.2.1. Zeolites
- 10.1.2.2. Molecular Sieves
- 10.1.3. Chemical Compounds
- 10.1.3.1. Peroxides
- 10.1.3.2. Acids
- 10.1.3.3. Amines
- 10.1.3.4. Other Chemical Compounds
- 10.1.4. Other Materials
- 10.1.1. Metals and Organometallic Catalysts
- 10.2. Market Analysis, Insights and Forecast - by Application
- 10.2.1. Petroleum Refining
- 10.2.1.1. Fluid Catalytic Cracking (FCC)
- 10.2.1.2. Hydrocracking
- 10.2.1.3. Hydrotreating
- 10.2.1.4. Alkylation
- 10.2.1.5. Reforming
- 10.2.1.6. Isomerization
- 10.2.2. Chemical Synthesis
- 10.2.2.1. Organic Synthesis
- 10.2.2.2. Oxidation
- 10.2.2.3. Hydrogenation
- 10.2.2.4. Dehydrogenation
- 10.2.2.5. Synthesis Gas Processes
- 10.2.3. Polymerization
- 10.2.3.1. Polyolefins
- 10.2.3.2. Condensation Polymers
- 10.2.3.3. Thermosetting Polymers
- 10.2.3.4. Additional Polymers
- 10.2.1. Petroleum Refining
- 10.1. Market Analysis, Insights and Forecast - by Material
- 11. Middle East and Africa Petroleum Refining & Chemicals Catalysts Industry Analysis, Insights and Forecast, 2020-2032
- 11.1. Market Analysis, Insights and Forecast - by Material
- 11.1.1. Metals and Organometallic Catalysts
- 11.1.1.1. Inexpensive Metals
- 11.1.1.2. Precious Metals
- 11.1.1.3. Metallic Compounds
- 11.1.2. Aluminosilicates
- 11.1.2.1. Zeolites
- 11.1.2.2. Molecular Sieves
- 11.1.3. Chemical Compounds
- 11.1.3.1. Peroxides
- 11.1.3.2. Acids
- 11.1.3.3. Amines
- 11.1.3.4. Other Chemical Compounds
- 11.1.4. Other Materials
- 11.1.1. Metals and Organometallic Catalysts
- 11.2. Market Analysis, Insights and Forecast - by Application
- 11.2.1. Petroleum Refining
- 11.2.1.1. Fluid Catalytic Cracking (FCC)
- 11.2.1.2. Hydrocracking
- 11.2.1.3. Hydrotreating
- 11.2.1.4. Alkylation
- 11.2.1.5. Reforming
- 11.2.1.6. Isomerization
- 11.2.2. Chemical Synthesis
- 11.2.2.1. Organic Synthesis
- 11.2.2.2. Oxidation
- 11.2.2.3. Hydrogenation
- 11.2.2.4. Dehydrogenation
- 11.2.2.5. Synthesis Gas Processes
- 11.2.3. Polymerization
- 11.2.3.1. Polyolefins
- 11.2.3.2. Condensation Polymers
- 11.2.3.3. Thermosetting Polymers
- 11.2.3.4. Additional Polymers
- 11.2.1. Petroleum Refining
- 11.1. Market Analysis, Insights and Forecast - by Material
- 12. Competitive Analysis
- 12.1. Company Profiles
- 12.1.1 Chevron Phillips Chemical Company
- 12.1.1.1. Company Overview
- 12.1.1.2. Products
- 12.1.1.3. Company Financials
- 12.1.1.4. SWOT Analysis
- 12.1.2 Honeywell International Inc
- 12.1.2.1. Company Overview
- 12.1.2.2. Products
- 12.1.2.3. Company Financials
- 12.1.2.4. SWOT Analysis
- 12.1.3 W R Grace & Co
- 12.1.3.1. Company Overview
- 12.1.3.2. Products
- 12.1.3.3. Company Financials
- 12.1.3.4. SWOT Analysis
- 12.1.4 Catalytic Distillation Technologies
- 12.1.4.1. Company Overview
- 12.1.4.2. Products
- 12.1.4.3. Company Financials
- 12.1.4.4. SWOT Analysis
- 12.1.5 Exxon Mobil Corporation
- 12.1.5.1. Company Overview
- 12.1.5.2. Products
- 12.1.5.3. Company Financials
- 12.1.5.4. SWOT Analysis
- 12.1.6 INEOS Technologies
- 12.1.6.1. Company Overview
- 12.1.6.2. Products
- 12.1.6.3. Company Financials
- 12.1.6.4. SWOT Analysis
- 12.1.7 Johnson Matthey Inc
- 12.1.7.1. Company Overview
- 12.1.7.2. Products
- 12.1.7.3. Company Financials
- 12.1.7.4. SWOT Analysis
- 12.1.8 Evonik Industries AG
- 12.1.8.1. Company Overview
- 12.1.8.2. Products
- 12.1.8.3. Company Financials
- 12.1.8.4. SWOT Analysis
- 12.1.9 Wako Chemicals USA Inc
- 12.1.9.1. Company Overview
- 12.1.9.2. Products
- 12.1.9.3. Company Financials
- 12.1.9.4. SWOT Analysis
- 12.1.10 KBR Inc
- 12.1.10.1. Company Overview
- 12.1.10.2. Products
- 12.1.10.3. Company Financials
- 12.1.10.4. SWOT Analysis
- 12.1.11 BASF SE
- 12.1.11.1. Company Overview
- 12.1.11.2. Products
- 12.1.11.3. Company Financials
- 12.1.11.4. SWOT Analysis
- 12.1.12 Eka Chemicals AB
- 12.1.12.1. Company Overview
- 12.1.12.2. Products
- 12.1.12.3. Company Financials
- 12.1.12.4. SWOT Analysis
- 12.1.13 Zeochem LLC
- 12.1.13.1. Company Overview
- 12.1.13.2. Products
- 12.1.13.3. Company Financials
- 12.1.13.4. SWOT Analysis
- 12.1.14 Zeolyst International*List Not Exhaustive
- 12.1.14.1. Company Overview
- 12.1.14.2. Products
- 12.1.14.3. Company Financials
- 12.1.14.4. SWOT Analysis
- 12.1.15 Chicago Bridge & Iron Company
- 12.1.15.1. Company Overview
- 12.1.15.2. Products
- 12.1.15.3. Company Financials
- 12.1.15.4. SWOT Analysis
- 12.1.16 Dow
- 12.1.16.1. Company Overview
- 12.1.16.2. Products
- 12.1.16.3. Company Financials
- 12.1.16.4. SWOT Analysis
- 12.1.17 Bayer Technology Services
- 12.1.17.1. Company Overview
- 12.1.17.2. Products
- 12.1.17.3. Company Financials
- 12.1.17.4. SWOT Analysis
- 12.1.18 Nova Chemicals Corp
- 12.1.18.1. Company Overview
- 12.1.18.2. Products
- 12.1.18.3. Company Financials
- 12.1.18.4. SWOT Analysis
- 12.1.19 Clariant International Ltd
- 12.1.19.1. Company Overview
- 12.1.19.2. Products
- 12.1.19.3. Company Financials
- 12.1.19.4. SWOT Analysis
- 12.1.20 Eastman Chemical Co
- 12.1.20.1. Company Overview
- 12.1.20.2. Products
- 12.1.20.3. Company Financials
- 12.1.20.4. SWOT Analysis
- 12.1.1 Chevron Phillips Chemical Company
- 12.2. Market Entropy
- 12.2.1 Company's Key Areas Served
- 12.2.2 Recent Developments
- 12.3. Company Market Share Analysis 2025
- 12.3.1 Top 5 Companies Market Share Analysis
- 12.3.2 Top 3 Companies Market Share Analysis
- 12.4. List of Potential Customers
- 13. Research Methodology
List of Figures
- Figure 1: Global Petroleum Refining & Chemicals Catalysts Industry Revenue Breakdown (million, %) by Region 2025 & 2033
- Figure 2: Asia Pacific Petroleum Refining & Chemicals Catalysts Industry Revenue (million), by Material 2025 & 2033
- Figure 3: Asia Pacific Petroleum Refining & Chemicals Catalysts Industry Revenue Share (%), by Material 2025 & 2033
- Figure 4: Asia Pacific Petroleum Refining & Chemicals Catalysts Industry Revenue (million), by Application 2025 & 2033
- Figure 5: Asia Pacific Petroleum Refining & Chemicals Catalysts Industry Revenue Share (%), by Application 2025 & 2033
- Figure 6: Asia Pacific Petroleum Refining & Chemicals Catalysts Industry Revenue (million), by Country 2025 & 2033
- Figure 7: Asia Pacific Petroleum Refining & Chemicals Catalysts Industry Revenue Share (%), by Country 2025 & 2033
- Figure 8: North America Petroleum Refining & Chemicals Catalysts Industry Revenue (million), by Material 2025 & 2033
- Figure 9: North America Petroleum Refining & Chemicals Catalysts Industry Revenue Share (%), by Material 2025 & 2033
- Figure 10: North America Petroleum Refining & Chemicals Catalysts Industry Revenue (million), by Application 2025 & 2033
- Figure 11: North America Petroleum Refining & Chemicals Catalysts Industry Revenue Share (%), by Application 2025 & 2033
- Figure 12: North America Petroleum Refining & Chemicals Catalysts Industry Revenue (million), by Country 2025 & 2033
- Figure 13: North America Petroleum Refining & Chemicals Catalysts Industry Revenue Share (%), by Country 2025 & 2033
- Figure 14: Europe Petroleum Refining & Chemicals Catalysts Industry Revenue (million), by Material 2025 & 2033
- Figure 15: Europe Petroleum Refining & Chemicals Catalysts Industry Revenue Share (%), by Material 2025 & 2033
- Figure 16: Europe Petroleum Refining & Chemicals Catalysts Industry Revenue (million), by Application 2025 & 2033
- Figure 17: Europe Petroleum Refining & Chemicals Catalysts Industry Revenue Share (%), by Application 2025 & 2033
- Figure 18: Europe Petroleum Refining & Chemicals Catalysts Industry Revenue (million), by Country 2025 & 2033
- Figure 19: Europe Petroleum Refining & Chemicals Catalysts Industry Revenue Share (%), by Country 2025 & 2033
- Figure 20: South America Petroleum Refining & Chemicals Catalysts Industry Revenue (million), by Material 2025 & 2033
- Figure 21: South America Petroleum Refining & Chemicals Catalysts Industry Revenue Share (%), by Material 2025 & 2033
- Figure 22: South America Petroleum Refining & Chemicals Catalysts Industry Revenue (million), by Application 2025 & 2033
- Figure 23: South America Petroleum Refining & Chemicals Catalysts Industry Revenue Share (%), by Application 2025 & 2033
- Figure 24: South America Petroleum Refining & Chemicals Catalysts Industry Revenue (million), by Country 2025 & 2033
- Figure 25: South America Petroleum Refining & Chemicals Catalysts Industry Revenue Share (%), by Country 2025 & 2033
- Figure 26: Middle East and Africa Petroleum Refining & Chemicals Catalysts Industry Revenue (million), by Material 2025 & 2033
- Figure 27: Middle East and Africa Petroleum Refining & Chemicals Catalysts Industry Revenue Share (%), by Material 2025 & 2033
- Figure 28: Middle East and Africa Petroleum Refining & Chemicals Catalysts Industry Revenue (million), by Application 2025 & 2033
- Figure 29: Middle East and Africa Petroleum Refining & Chemicals Catalysts Industry Revenue Share (%), by Application 2025 & 2033
- Figure 30: Middle East and Africa Petroleum Refining & Chemicals Catalysts Industry Revenue (million), by Country 2025 & 2033
- Figure 31: Middle East and Africa Petroleum Refining & Chemicals Catalysts Industry Revenue Share (%), by Country 2025 & 2033
List of Tables
- Table 1: Global Petroleum Refining & Chemicals Catalysts Industry Revenue million Forecast, by Material 2020 & 2033
- Table 2: Global Petroleum Refining & Chemicals Catalysts Industry Revenue million Forecast, by Application 2020 & 2033
- Table 3: Global Petroleum Refining & Chemicals Catalysts Industry Revenue million Forecast, by Region 2020 & 2033
- Table 4: Global Petroleum Refining & Chemicals Catalysts Industry Revenue million Forecast, by Material 2020 & 2033
- Table 5: Global Petroleum Refining & Chemicals Catalysts Industry Revenue million Forecast, by Application 2020 & 2033
- Table 6: Global Petroleum Refining & Chemicals Catalysts Industry Revenue million Forecast, by Country 2020 & 2033
- Table 7: China Petroleum Refining & Chemicals Catalysts Industry Revenue (million) Forecast, by Application 2020 & 2033
- Table 8: India Petroleum Refining & Chemicals Catalysts Industry Revenue (million) Forecast, by Application 2020 & 2033
- Table 9: Japan Petroleum Refining & Chemicals Catalysts Industry Revenue (million) Forecast, by Application 2020 & 2033
- Table 10: South Korea Petroleum Refining & Chemicals Catalysts Industry Revenue (million) Forecast, by Application 2020 & 2033
- Table 11: ASEAN Countries Petroleum Refining & Chemicals Catalysts Industry Revenue (million) Forecast, by Application 2020 & 2033
- Table 12: Rest of Asia Pacific Petroleum Refining & Chemicals Catalysts Industry Revenue (million) Forecast, by Application 2020 & 2033
- Table 13: Global Petroleum Refining & Chemicals Catalysts Industry Revenue million Forecast, by Material 2020 & 2033
- Table 14: Global Petroleum Refining & Chemicals Catalysts Industry Revenue million Forecast, by Application 2020 & 2033
- Table 15: Global Petroleum Refining & Chemicals Catalysts Industry Revenue million Forecast, by Country 2020 & 2033
- Table 16: United States Petroleum Refining & Chemicals Catalysts Industry Revenue (million) Forecast, by Application 2020 & 2033
- Table 17: Canada Petroleum Refining & Chemicals Catalysts Industry Revenue (million) Forecast, by Application 2020 & 2033
- Table 18: Mexico Petroleum Refining & Chemicals Catalysts Industry Revenue (million) Forecast, by Application 2020 & 2033
- Table 19: Global Petroleum Refining & Chemicals Catalysts Industry Revenue million Forecast, by Material 2020 & 2033
- Table 20: Global Petroleum Refining & Chemicals Catalysts Industry Revenue million Forecast, by Application 2020 & 2033
- Table 21: Global Petroleum Refining & Chemicals Catalysts Industry Revenue million Forecast, by Country 2020 & 2033
- Table 22: Germany Petroleum Refining & Chemicals Catalysts Industry Revenue (million) Forecast, by Application 2020 & 2033
- Table 23: United Kingdom Petroleum Refining & Chemicals Catalysts Industry Revenue (million) Forecast, by Application 2020 & 2033
- Table 24: Italy Petroleum Refining & Chemicals Catalysts Industry Revenue (million) Forecast, by Application 2020 & 2033
- Table 25: France Petroleum Refining & Chemicals Catalysts Industry Revenue (million) Forecast, by Application 2020 & 2033
- Table 26: Rest of Europe Petroleum Refining & Chemicals Catalysts Industry Revenue (million) Forecast, by Application 2020 & 2033
- Table 27: Global Petroleum Refining & Chemicals Catalysts Industry Revenue million Forecast, by Material 2020 & 2033
- Table 28: Global Petroleum Refining & Chemicals Catalysts Industry Revenue million Forecast, by Application 2020 & 2033
- Table 29: Global Petroleum Refining & Chemicals Catalysts Industry Revenue million Forecast, by Country 2020 & 2033
- Table 30: Brazil Petroleum Refining & Chemicals Catalysts Industry Revenue (million) Forecast, by Application 2020 & 2033
- Table 31: Argentina Petroleum Refining & Chemicals Catalysts Industry Revenue (million) Forecast, by Application 2020 & 2033
- Table 32: Rest of South America Petroleum Refining & Chemicals Catalysts Industry Revenue (million) Forecast, by Application 2020 & 2033
- Table 33: Global Petroleum Refining & Chemicals Catalysts Industry Revenue million Forecast, by Material 2020 & 2033
- Table 34: Global Petroleum Refining & Chemicals Catalysts Industry Revenue million Forecast, by Application 2020 & 2033
- Table 35: Global Petroleum Refining & Chemicals Catalysts Industry Revenue million Forecast, by Country 2020 & 2033
- Table 36: Saudi Arabia Petroleum Refining & Chemicals Catalysts Industry Revenue (million) Forecast, by Application 2020 & 2033
- Table 37: South Africa Petroleum Refining & Chemicals Catalysts Industry Revenue (million) Forecast, by Application 2020 & 2033
- Table 38: Rest of Middle East and Africa Petroleum Refining & Chemicals Catalysts Industry Revenue (million) Forecast, by Application 2020 & 2033
Frequently Asked Questions
1. What is the projected Compound Annual Growth Rate (CAGR) of the Petroleum Refining & Chemicals Catalysts Industry?
The projected CAGR is approximately 4.3%.
2. Which companies are prominent players in the Petroleum Refining & Chemicals Catalysts Industry?
Key companies in the market include Chevron Phillips Chemical Company, Honeywell International Inc, W R Grace & Co, Catalytic Distillation Technologies, Exxon Mobil Corporation, INEOS Technologies, Johnson Matthey Inc, Evonik Industries AG, Wako Chemicals USA Inc, KBR Inc, BASF SE, Eka Chemicals AB, Zeochem LLC, Zeolyst International*List Not Exhaustive, Chicago Bridge & Iron Company, Dow, Bayer Technology Services, Nova Chemicals Corp, Clariant International Ltd, Eastman Chemical Co.
3. What are the main segments of the Petroleum Refining & Chemicals Catalysts Industry?
The market segments include Material, Application.
4. Can you provide details about the market size?
The market size is estimated to be USD 10096.57 million as of 2022.
5. What are some drivers contributing to market growth?
Increasing Refinery Market Output in Africa; Middle East; and Asia-Pacific; Rising Demand for Maintaining High Octane Figures.
6. What are the notable trends driving market growth?
Petroleum Refining Application to Dominate the Market.
7. Are there any restraints impacting market growth?
High Manufacturing Costs; Other Restraints.
8. Can you provide examples of recent developments in the market?
N/A
9. What pricing options are available for accessing the report?
Pricing options include single-user, multi-user, and enterprise licenses priced at USD 4750, USD 5250, and USD 8750 respectively.
10. Is the market size provided in terms of value or volume?
The market size is provided in terms of value, measured in million.
11. Are there any specific market keywords associated with the report?
Yes, the market keyword associated with the report is "Petroleum Refining & Chemicals Catalysts Industry," which aids in identifying and referencing the specific market segment covered.
12. How do I determine which pricing option suits my needs best?
The pricing options vary based on user requirements and access needs. Individual users may opt for single-user licenses, while businesses requiring broader access may choose multi-user or enterprise licenses for cost-effective access to the report.
13. Are there any additional resources or data provided in the Petroleum Refining & Chemicals Catalysts Industry report?
While the report offers comprehensive insights, it's advisable to review the specific contents or supplementary materials provided to ascertain if additional resources or data are available.
14. How can I stay updated on further developments or reports in the Petroleum Refining & Chemicals Catalysts Industry?
To stay informed about further developments, trends, and reports in the Petroleum Refining & Chemicals Catalysts Industry, consider subscribing to industry newsletters, following relevant companies and organizations, or regularly checking reputable industry news sources and publications.
Methodology
Step 1 - Identification of Relevant Samples Size from Population Database


Step 2 - Approaches for Defining Global Market Size (Value, Volume* & Price*)

Note*: In applicable scenarios
Step 3 - Data Sources
Primary Research
- Web Analytics
- Survey Reports
- Research Institute
- Latest Research Reports
- Opinion Leaders
Secondary Research
- Annual Reports
- White Paper
- Latest Press Release
- Industry Association
- Paid Database
- Investor Presentations

Step 4 - Data Triangulation
Involves using different sources of information in order to increase the validity of a study
These sources are likely to be stakeholders in a program - participants, other researchers, program staff, other community members, and so on.
Then we put all data in single framework & apply various statistical tools to find out the dynamic on the market.
During the analysis stage, feedback from the stakeholder groups would be compared to determine areas of agreement as well as areas of divergence