

Key Insights
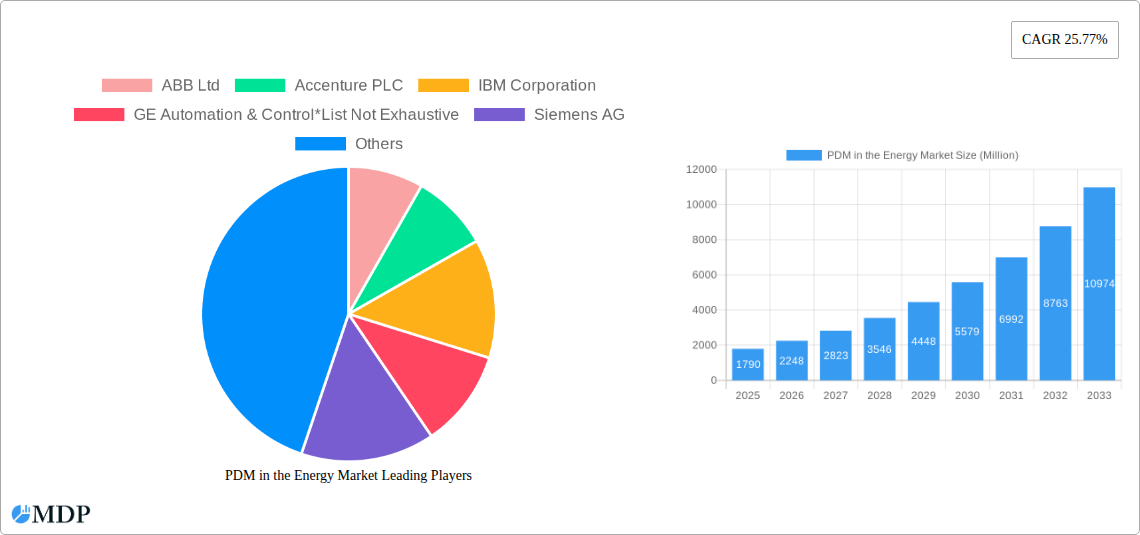
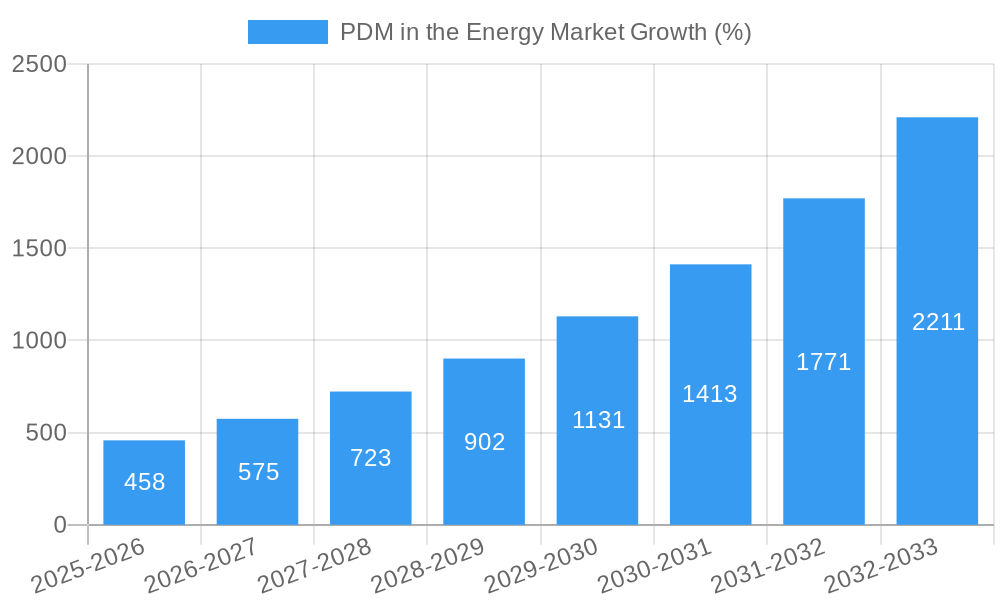
The Product Data Management (PDM) market within the energy sector is experiencing robust growth, projected to reach $1.79 billion in 2025 and exhibiting a Compound Annual Growth Rate (CAGR) of 25.77% from 2025 to 2033. This expansion is fueled by several key drivers. The increasing complexity of energy projects, coupled with a rising demand for efficient asset management and improved collaboration across dispersed teams, necessitates sophisticated PDM solutions. Furthermore, the energy industry's ongoing digital transformation, including the adoption of smart grids and renewable energy sources, creates a significant opportunity for PDM systems to streamline data management and optimize operational efficiency. Regulatory pressures to enhance safety and reduce environmental impact also contribute to the market's growth, as PDM systems facilitate better compliance tracking and reporting. The cloud-based deployment model is gaining traction, offering scalability and accessibility advantages over on-premise solutions, while North America currently holds a substantial market share due to high technology adoption rates and a mature energy infrastructure. However, challenges remain, including the high initial investment costs of implementing PDM systems and the need for comprehensive employee training to maximize their effectiveness. The market is segmented by offering (solutions and services), deployment model (on-premise and cloud), and region, reflecting the diverse needs and technological capabilities across the global energy landscape.
The competitive landscape is characterized by a mix of established players like ABB Ltd, Siemens AG, and Schneider Electric, alongside specialized software providers and technology giants such as IBM and SAP SE. These companies are continually innovating to offer integrated solutions that cater to the specific challenges and opportunities within the energy sector. Future growth will likely be driven by the increasing adoption of advanced analytics capabilities within PDM systems, allowing for predictive maintenance, optimized resource allocation, and improved decision-making based on real-time data insights. The integration of PDM with other enterprise systems, such as Enterprise Resource Planning (ERP) and supply chain management (SCM) solutions, will also play a crucial role in enhancing the value proposition of PDM for energy companies. The market's continued expansion hinges on the industry's ongoing commitment to digitalization and the sustained demand for improved efficiency, safety, and sustainability.
Predictive Maintenance (PDM) in the Energy Market: A Comprehensive Report (2019-2033)
This comprehensive report provides an in-depth analysis of the Predictive Maintenance (PDM) market within the energy sector, offering invaluable insights for stakeholders, investors, and industry professionals. With a study period spanning 2019-2033, a base year of 2025, and a forecast period of 2025-2033, this report meticulously examines market dynamics, trends, leading players, and future opportunities. The global PDM market in the energy sector is projected to reach USD xx Million by 2033, exhibiting a significant CAGR of xx% during the forecast period.
PDM in the Energy Market Market Dynamics & Concentration
The PDM market in the energy sector is characterized by a moderately concentrated landscape with several major players vying for market share. ABB Ltd, Accenture PLC, IBM Corporation, GE Automation & Control, Siemens AG, Banner Engineering Corp, Schneider Electric, Robert Bosch GmbH, Intel Corporation, and SAP SE are some of the key players, though the market also includes numerous smaller, specialized firms. Market concentration is influenced by factors such as technological advancements, regulatory changes, and the increasing adoption of digitalization strategies within the energy industry.
- Market Share: The top five players hold an estimated xx% of the market share in 2025.
- Innovation Drivers: The push for increased operational efficiency, reduced downtime, and enhanced safety within energy production and distribution is driving innovation in PDM solutions. Advancements in AI, machine learning, and IoT are key factors fueling this growth.
- Regulatory Frameworks: Government regulations aimed at improving energy infrastructure reliability and safety are creating demand for PDM solutions. These regulations vary across regions, impacting market dynamics accordingly.
- Product Substitutes: While PDM offers a significant advantage in predictive capabilities, traditional reactive maintenance approaches continue to exist, though their market share is steadily declining.
- End-User Trends: Energy companies are increasingly adopting PDM solutions to optimize asset performance, minimize operational costs, and enhance sustainability efforts.
- M&A Activities: The number of M&A deals in the PDM energy sector has increased in recent years, reflecting the consolidation of the market and strategic expansion efforts of key players. An estimated xx M&A deals were recorded in the period 2019-2024.
PDM in the Energy Market Industry Trends & Analysis
The PDM market in the energy sector is experiencing robust growth driven by several key trends. The increasing complexity of energy infrastructure, coupled with the need for enhanced operational efficiency and reduced downtime, is fueling the demand for advanced PDM solutions. The integration of IoT sensors, AI-powered analytics, and cloud computing technologies are transforming PDM capabilities, enabling more accurate predictions and proactive maintenance strategies. The rising adoption of renewable energy sources, such as solar and wind power, also contributes to the growth of the PDM market, as these sources require robust monitoring and maintenance to ensure optimal performance. Consumer preferences are shifting towards environmentally friendly and cost-effective energy solutions, prompting energy companies to embrace PDM for improved operational efficiency and sustainability. Competitive dynamics are intensifying, with leading players investing heavily in research and development to enhance their PDM offerings and expand their market reach. This results in a projected market value of USD xx Million by 2033.
Leading Markets & Segments in PDM in the Energy Market
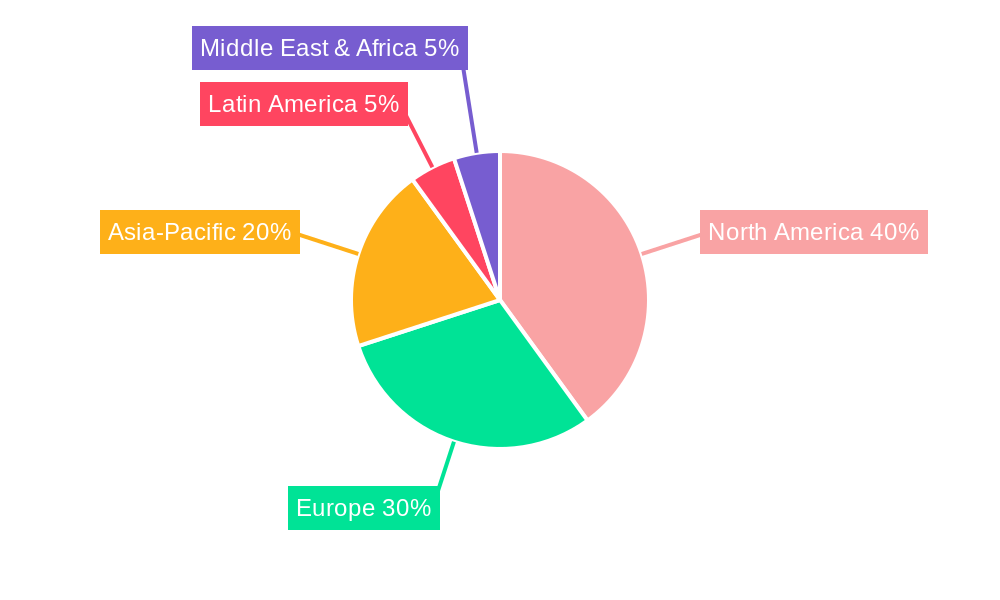
North America currently dominates the PDM market in the energy sector, driven by high investments in digital infrastructure and advanced technologies. However, the Asia-Pacific region is expected to witness significant growth in the coming years due to rapid industrialization and increasing energy demand.
- By Offering: The solutions segment currently holds the larger market share, followed by services. However, the services segment is expected to experience higher growth rates driven by the increasing demand for expertise in implementing and maintaining PDM systems.
- By Deployment Model: The on-premise deployment model currently dominates due to existing infrastructure and security concerns, but cloud-based deployments are gaining traction, driven by cost-effectiveness and scalability advantages.
- By Region:
- North America: Strong regulatory support, advanced technological infrastructure, and high adoption rates within the energy sector.
- Europe: Significant investments in renewable energy and a focus on energy efficiency, driving demand for PDM solutions.
- Asia-Pacific: Rapid industrialization and expanding energy infrastructure, presenting a high-growth potential.
- Latin America: Emerging markets with increasing investments in renewable energy, presenting growth opportunities.
- Middle East & Africa: Focus on developing energy infrastructure, which provides opportunities for PDM adoption.
PDM in the Energy Market Product Developments
Recent product innovations focus on enhancing predictive accuracy, integrating data from diverse sources, and improving user experience. AI-powered diagnostic tools, advanced sensor technologies, and cloud-based platforms are improving PDM solutions' capabilities. The integration of machine learning algorithms enhances predictive accuracy and allows for proactive maintenance scheduling, minimizing downtime and optimizing asset performance. The market is seeing a move towards more user-friendly interfaces and data visualization tools that allow for easy interpretation of insights and improved decision-making.
Key Drivers of PDM in the Energy Market Growth
Several factors are propelling the growth of the PDM market in the energy sector. Technological advancements such as AI and IoT are enabling more accurate and timely predictions, improving efficiency and cost-effectiveness. Stringent government regulations aimed at improving energy infrastructure reliability and safety are driving demand for sophisticated PDM solutions. Economic factors, including the increasing cost of downtime and the need to optimize asset utilization, are further fueling market growth.
Challenges in the PDM in the Energy Market Market
Despite the significant growth potential, the PDM market faces challenges including high initial investment costs for implementing PDM systems, complexities in data integration from diverse sources, and a shortage of skilled professionals to manage and interpret PDM data. Data security and privacy concerns are also significant, impacting the wider adoption of cloud-based PDM solutions. Further, the high cost of specialized hardware and software can hinder entry into the market for smaller energy companies.
Emerging Opportunities in the PDM in the Energy Market
Long-term growth in the PDM market is fueled by several opportunities, including the increasing adoption of renewable energy sources, the continued advancement of AI and IoT technologies, and the growing need for enhanced cybersecurity and data integrity within energy infrastructure. Strategic partnerships between PDM solution providers and energy companies will play a key role in accelerating market penetration and fostering innovation. Expansion into emerging markets will also create significant growth opportunities for PDM solution providers.
Leading Players in the PDM in the Energy Market Sector
- ABB Ltd
- Accenture PLC
- IBM Corporation
- GE Automation & Control
- Siemens AG
- Banner Engineering Corp
- Schneider Electric
- Robert Bosch GmbH
- Intel Corporation
- SAP SE
Key Milestones in PDM in the Energy Market Industry
- September 2022: Atlas AI's partnership with the Rockefeller Foundation to leverage satellite data and ML technologies for green infrastructure investment in Sub-Saharan Africa highlights the growing adoption of predictive analytics for sustainable energy development.
- June 2022: Hinduja Tech's entry into the IoT market with Senseye's AI-powered predictive maintenance solution showcases the increasing convergence of AI and IoT in PDM for enhanced machine reliability.
- February 2022: The European Union's EUR 1.6 billion investment in Morocco's green energy sector signifies the growing political and financial support for technologies like predictive maintenance to accelerate the green and digital transition.
Strategic Outlook for PDM in the Energy Market Market
The future of the PDM market in the energy sector is bright. Continued technological advancements, coupled with increasing regulatory pressure and the rising demand for operational efficiency and sustainability, will drive long-term growth. Strategic partnerships, expansion into emerging markets, and a focus on developing user-friendly and easily integrated solutions will be key to success in this rapidly evolving market. The market presents significant opportunities for companies that can effectively leverage technological advancements and adapt to changing industry needs.
PDM in the Energy Market Segmentation
-
1. Offering
- 1.1. Solutions
- 1.2. Services
-
2. Deployment Model
- 2.1. On-premise
- 2.2. Cloud
PDM in the Energy Market Segmentation By Geography
-
1. North America
- 1.1. United States
- 1.2. Canada
- 1.3. Mexico
-
2. South America
- 2.1. Brazil
- 2.2. Argentina
- 2.3. Rest of South America
-
3. Europe
- 3.1. United Kingdom
- 3.2. Germany
- 3.3. France
- 3.4. Italy
- 3.5. Spain
- 3.6. Russia
- 3.7. Benelux
- 3.8. Nordics
- 3.9. Rest of Europe
-
4. Middle East & Africa
- 4.1. Turkey
- 4.2. Israel
- 4.3. GCC
- 4.4. North Africa
- 4.5. South Africa
- 4.6. Rest of Middle East & Africa
-
5. Asia Pacific
- 5.1. China
- 5.2. India
- 5.3. Japan
- 5.4. South Korea
- 5.5. ASEAN
- 5.6. Oceania
- 5.7. Rest of Asia Pacific
PDM in the Energy Market REPORT HIGHLIGHTS
| Aspects | Details |
|---|---|
| Study Period | 2019-2033 |
| Base Year | 2024 |
| Estimated Year | 2025 |
| Forecast Period | 2025-2033 |
| Historical Period | 2019-2024 |
| Growth Rate | CAGR of 25.77% from 2019-2033 |
| Segmentation |
|
Table of Contents
- 1. Introduction
- 1.1. Research Scope
- 1.2. Market Segmentation
- 1.3. Research Methodology
- 1.4. Definitions and Assumptions
- 2. Executive Summary
- 2.1. Introduction
- 3. Market Dynamics
- 3.1. Introduction
- 3.2. Market Drivers
- 3.2.1. Increasing Investments in the Energy Sector; Increasing Adoption of Automation
- 3.3. Market Restrains
- 3.3.1. Lack of Awareness About the Benefits of Sports Analytics Solutions
- 3.4. Market Trends
- 3.4.1. Solutions Segment is Anticipated to Witness Significant Growth
- 4. Market Factor Analysis
- 4.1. Porters Five Forces
- 4.2. Supply/Value Chain
- 4.3. PESTEL analysis
- 4.4. Market Entropy
- 4.5. Patent/Trademark Analysis
- 5. Global PDM in the Energy Market Analysis, Insights and Forecast, 2019-2031
- 5.1. Market Analysis, Insights and Forecast - by Offering
- 5.1.1. Solutions
- 5.1.2. Services
- 5.2. Market Analysis, Insights and Forecast - by Deployment Model
- 5.2.1. On-premise
- 5.2.2. Cloud
- 5.3. Market Analysis, Insights and Forecast - by Region
- 5.3.1. North America
- 5.3.2. South America
- 5.3.3. Europe
- 5.3.4. Middle East & Africa
- 5.3.5. Asia Pacific
- 5.1. Market Analysis, Insights and Forecast - by Offering
- 6. North America PDM in the Energy Market Analysis, Insights and Forecast, 2019-2031
- 6.1. Market Analysis, Insights and Forecast - by Offering
- 6.1.1. Solutions
- 6.1.2. Services
- 6.2. Market Analysis, Insights and Forecast - by Deployment Model
- 6.2.1. On-premise
- 6.2.2. Cloud
- 6.1. Market Analysis, Insights and Forecast - by Offering
- 7. South America PDM in the Energy Market Analysis, Insights and Forecast, 2019-2031
- 7.1. Market Analysis, Insights and Forecast - by Offering
- 7.1.1. Solutions
- 7.1.2. Services
- 7.2. Market Analysis, Insights and Forecast - by Deployment Model
- 7.2.1. On-premise
- 7.2.2. Cloud
- 7.1. Market Analysis, Insights and Forecast - by Offering
- 8. Europe PDM in the Energy Market Analysis, Insights and Forecast, 2019-2031
- 8.1. Market Analysis, Insights and Forecast - by Offering
- 8.1.1. Solutions
- 8.1.2. Services
- 8.2. Market Analysis, Insights and Forecast - by Deployment Model
- 8.2.1. On-premise
- 8.2.2. Cloud
- 8.1. Market Analysis, Insights and Forecast - by Offering
- 9. Middle East & Africa PDM in the Energy Market Analysis, Insights and Forecast, 2019-2031
- 9.1. Market Analysis, Insights and Forecast - by Offering
- 9.1.1. Solutions
- 9.1.2. Services
- 9.2. Market Analysis, Insights and Forecast - by Deployment Model
- 9.2.1. On-premise
- 9.2.2. Cloud
- 9.1. Market Analysis, Insights and Forecast - by Offering
- 10. Asia Pacific PDM in the Energy Market Analysis, Insights and Forecast, 2019-2031
- 10.1. Market Analysis, Insights and Forecast - by Offering
- 10.1.1. Solutions
- 10.1.2. Services
- 10.2. Market Analysis, Insights and Forecast - by Deployment Model
- 10.2.1. On-premise
- 10.2.2. Cloud
- 10.1. Market Analysis, Insights and Forecast - by Offering
- 11. North America PDM in the Energy Market Analysis, Insights and Forecast, 2019-2031
- 11.1. Market Analysis, Insights and Forecast - By Country/Sub-region
- 11.1.1 United States
- 11.1.2 Canada
- 11.1.3 Mexico
- 12. Europe PDM in the Energy Market Analysis, Insights and Forecast, 2019-2031
- 12.1. Market Analysis, Insights and Forecast - By Country/Sub-region
- 12.1.1 Germany
- 12.1.2 United Kingdom
- 12.1.3 France
- 12.1.4 Spain
- 12.1.5 Italy
- 12.1.6 Spain
- 12.1.7 Belgium
- 12.1.8 Netherland
- 12.1.9 Nordics
- 12.1.10 Rest of Europe
- 13. Asia Pacific PDM in the Energy Market Analysis, Insights and Forecast, 2019-2031
- 13.1. Market Analysis, Insights and Forecast - By Country/Sub-region
- 13.1.1 China
- 13.1.2 Japan
- 13.1.3 India
- 13.1.4 South Korea
- 13.1.5 Southeast Asia
- 13.1.6 Australia
- 13.1.7 Indonesia
- 13.1.8 Phillipes
- 13.1.9 Singapore
- 13.1.10 Thailandc
- 13.1.11 Rest of Asia Pacific
- 14. South America PDM in the Energy Market Analysis, Insights and Forecast, 2019-2031
- 14.1. Market Analysis, Insights and Forecast - By Country/Sub-region
- 14.1.1 Brazil
- 14.1.2 Argentina
- 14.1.3 Peru
- 14.1.4 Chile
- 14.1.5 Colombia
- 14.1.6 Ecuador
- 14.1.7 Venezuela
- 14.1.8 Rest of South America
- 15. North America PDM in the Energy Market Analysis, Insights and Forecast, 2019-2031
- 15.1. Market Analysis, Insights and Forecast - By Country/Sub-region
- 15.1.1 United States
- 15.1.2 Canada
- 15.1.3 Mexico
- 16. MEA PDM in the Energy Market Analysis, Insights and Forecast, 2019-2031
- 16.1. Market Analysis, Insights and Forecast - By Country/Sub-region
- 16.1.1 United Arab Emirates
- 16.1.2 Saudi Arabia
- 16.1.3 South Africa
- 16.1.4 Rest of Middle East and Africa
- 17. Competitive Analysis
- 17.1. Global Market Share Analysis 2024
- 17.2. Company Profiles
- 17.2.1 ABB Ltd
- 17.2.1.1. Overview
- 17.2.1.2. Products
- 17.2.1.3. SWOT Analysis
- 17.2.1.4. Recent Developments
- 17.2.1.5. Financials (Based on Availability)
- 17.2.2 Accenture PLC
- 17.2.2.1. Overview
- 17.2.2.2. Products
- 17.2.2.3. SWOT Analysis
- 17.2.2.4. Recent Developments
- 17.2.2.5. Financials (Based on Availability)
- 17.2.3 IBM Corporation
- 17.2.3.1. Overview
- 17.2.3.2. Products
- 17.2.3.3. SWOT Analysis
- 17.2.3.4. Recent Developments
- 17.2.3.5. Financials (Based on Availability)
- 17.2.4 GE Automation & Control*List Not Exhaustive
- 17.2.4.1. Overview
- 17.2.4.2. Products
- 17.2.4.3. SWOT Analysis
- 17.2.4.4. Recent Developments
- 17.2.4.5. Financials (Based on Availability)
- 17.2.5 Siemens AG
- 17.2.5.1. Overview
- 17.2.5.2. Products
- 17.2.5.3. SWOT Analysis
- 17.2.5.4. Recent Developments
- 17.2.5.5. Financials (Based on Availability)
- 17.2.6 Banner Engineering Corp
- 17.2.6.1. Overview
- 17.2.6.2. Products
- 17.2.6.3. SWOT Analysis
- 17.2.6.4. Recent Developments
- 17.2.6.5. Financials (Based on Availability)
- 17.2.7 Schneider Electric
- 17.2.7.1. Overview
- 17.2.7.2. Products
- 17.2.7.3. SWOT Analysis
- 17.2.7.4. Recent Developments
- 17.2.7.5. Financials (Based on Availability)
- 17.2.8 Robert Bosch GmbH
- 17.2.8.1. Overview
- 17.2.8.2. Products
- 17.2.8.3. SWOT Analysis
- 17.2.8.4. Recent Developments
- 17.2.8.5. Financials (Based on Availability)
- 17.2.9 Intel Corporation
- 17.2.9.1. Overview
- 17.2.9.2. Products
- 17.2.9.3. SWOT Analysis
- 17.2.9.4. Recent Developments
- 17.2.9.5. Financials (Based on Availability)
- 17.2.10 SAP SE
- 17.2.10.1. Overview
- 17.2.10.2. Products
- 17.2.10.3. SWOT Analysis
- 17.2.10.4. Recent Developments
- 17.2.10.5. Financials (Based on Availability)
- 17.2.1 ABB Ltd
List of Figures
- Figure 1: Global PDM in the Energy Market Revenue Breakdown (Million, %) by Region 2024 & 2032
- Figure 2: North America PDM in the Energy Market Revenue (Million), by Country 2024 & 2032
- Figure 3: North America PDM in the Energy Market Revenue Share (%), by Country 2024 & 2032
- Figure 4: Europe PDM in the Energy Market Revenue (Million), by Country 2024 & 2032
- Figure 5: Europe PDM in the Energy Market Revenue Share (%), by Country 2024 & 2032
- Figure 6: Asia Pacific PDM in the Energy Market Revenue (Million), by Country 2024 & 2032
- Figure 7: Asia Pacific PDM in the Energy Market Revenue Share (%), by Country 2024 & 2032
- Figure 8: South America PDM in the Energy Market Revenue (Million), by Country 2024 & 2032
- Figure 9: South America PDM in the Energy Market Revenue Share (%), by Country 2024 & 2032
- Figure 10: North America PDM in the Energy Market Revenue (Million), by Country 2024 & 2032
- Figure 11: North America PDM in the Energy Market Revenue Share (%), by Country 2024 & 2032
- Figure 12: MEA PDM in the Energy Market Revenue (Million), by Country 2024 & 2032
- Figure 13: MEA PDM in the Energy Market Revenue Share (%), by Country 2024 & 2032
- Figure 14: North America PDM in the Energy Market Revenue (Million), by Offering 2024 & 2032
- Figure 15: North America PDM in the Energy Market Revenue Share (%), by Offering 2024 & 2032
- Figure 16: North America PDM in the Energy Market Revenue (Million), by Deployment Model 2024 & 2032
- Figure 17: North America PDM in the Energy Market Revenue Share (%), by Deployment Model 2024 & 2032
- Figure 18: North America PDM in the Energy Market Revenue (Million), by Country 2024 & 2032
- Figure 19: North America PDM in the Energy Market Revenue Share (%), by Country 2024 & 2032
- Figure 20: South America PDM in the Energy Market Revenue (Million), by Offering 2024 & 2032
- Figure 21: South America PDM in the Energy Market Revenue Share (%), by Offering 2024 & 2032
- Figure 22: South America PDM in the Energy Market Revenue (Million), by Deployment Model 2024 & 2032
- Figure 23: South America PDM in the Energy Market Revenue Share (%), by Deployment Model 2024 & 2032
- Figure 24: South America PDM in the Energy Market Revenue (Million), by Country 2024 & 2032
- Figure 25: South America PDM in the Energy Market Revenue Share (%), by Country 2024 & 2032
- Figure 26: Europe PDM in the Energy Market Revenue (Million), by Offering 2024 & 2032
- Figure 27: Europe PDM in the Energy Market Revenue Share (%), by Offering 2024 & 2032
- Figure 28: Europe PDM in the Energy Market Revenue (Million), by Deployment Model 2024 & 2032
- Figure 29: Europe PDM in the Energy Market Revenue Share (%), by Deployment Model 2024 & 2032
- Figure 30: Europe PDM in the Energy Market Revenue (Million), by Country 2024 & 2032
- Figure 31: Europe PDM in the Energy Market Revenue Share (%), by Country 2024 & 2032
- Figure 32: Middle East & Africa PDM in the Energy Market Revenue (Million), by Offering 2024 & 2032
- Figure 33: Middle East & Africa PDM in the Energy Market Revenue Share (%), by Offering 2024 & 2032
- Figure 34: Middle East & Africa PDM in the Energy Market Revenue (Million), by Deployment Model 2024 & 2032
- Figure 35: Middle East & Africa PDM in the Energy Market Revenue Share (%), by Deployment Model 2024 & 2032
- Figure 36: Middle East & Africa PDM in the Energy Market Revenue (Million), by Country 2024 & 2032
- Figure 37: Middle East & Africa PDM in the Energy Market Revenue Share (%), by Country 2024 & 2032
- Figure 38: Asia Pacific PDM in the Energy Market Revenue (Million), by Offering 2024 & 2032
- Figure 39: Asia Pacific PDM in the Energy Market Revenue Share (%), by Offering 2024 & 2032
- Figure 40: Asia Pacific PDM in the Energy Market Revenue (Million), by Deployment Model 2024 & 2032
- Figure 41: Asia Pacific PDM in the Energy Market Revenue Share (%), by Deployment Model 2024 & 2032
- Figure 42: Asia Pacific PDM in the Energy Market Revenue (Million), by Country 2024 & 2032
- Figure 43: Asia Pacific PDM in the Energy Market Revenue Share (%), by Country 2024 & 2032
List of Tables
- Table 1: Global PDM in the Energy Market Revenue Million Forecast, by Region 2019 & 2032
- Table 2: Global PDM in the Energy Market Revenue Million Forecast, by Offering 2019 & 2032
- Table 3: Global PDM in the Energy Market Revenue Million Forecast, by Deployment Model 2019 & 2032
- Table 4: Global PDM in the Energy Market Revenue Million Forecast, by Region 2019 & 2032
- Table 5: Global PDM in the Energy Market Revenue Million Forecast, by Country 2019 & 2032
- Table 6: United States PDM in the Energy Market Revenue (Million) Forecast, by Application 2019 & 2032
- Table 7: Canada PDM in the Energy Market Revenue (Million) Forecast, by Application 2019 & 2032
- Table 8: Mexico PDM in the Energy Market Revenue (Million) Forecast, by Application 2019 & 2032
- Table 9: Global PDM in the Energy Market Revenue Million Forecast, by Country 2019 & 2032
- Table 10: Germany PDM in the Energy Market Revenue (Million) Forecast, by Application 2019 & 2032
- Table 11: United Kingdom PDM in the Energy Market Revenue (Million) Forecast, by Application 2019 & 2032
- Table 12: France PDM in the Energy Market Revenue (Million) Forecast, by Application 2019 & 2032
- Table 13: Spain PDM in the Energy Market Revenue (Million) Forecast, by Application 2019 & 2032
- Table 14: Italy PDM in the Energy Market Revenue (Million) Forecast, by Application 2019 & 2032
- Table 15: Spain PDM in the Energy Market Revenue (Million) Forecast, by Application 2019 & 2032
- Table 16: Belgium PDM in the Energy Market Revenue (Million) Forecast, by Application 2019 & 2032
- Table 17: Netherland PDM in the Energy Market Revenue (Million) Forecast, by Application 2019 & 2032
- Table 18: Nordics PDM in the Energy Market Revenue (Million) Forecast, by Application 2019 & 2032
- Table 19: Rest of Europe PDM in the Energy Market Revenue (Million) Forecast, by Application 2019 & 2032
- Table 20: Global PDM in the Energy Market Revenue Million Forecast, by Country 2019 & 2032
- Table 21: China PDM in the Energy Market Revenue (Million) Forecast, by Application 2019 & 2032
- Table 22: Japan PDM in the Energy Market Revenue (Million) Forecast, by Application 2019 & 2032
- Table 23: India PDM in the Energy Market Revenue (Million) Forecast, by Application 2019 & 2032
- Table 24: South Korea PDM in the Energy Market Revenue (Million) Forecast, by Application 2019 & 2032
- Table 25: Southeast Asia PDM in the Energy Market Revenue (Million) Forecast, by Application 2019 & 2032
- Table 26: Australia PDM in the Energy Market Revenue (Million) Forecast, by Application 2019 & 2032
- Table 27: Indonesia PDM in the Energy Market Revenue (Million) Forecast, by Application 2019 & 2032
- Table 28: Phillipes PDM in the Energy Market Revenue (Million) Forecast, by Application 2019 & 2032
- Table 29: Singapore PDM in the Energy Market Revenue (Million) Forecast, by Application 2019 & 2032
- Table 30: Thailandc PDM in the Energy Market Revenue (Million) Forecast, by Application 2019 & 2032
- Table 31: Rest of Asia Pacific PDM in the Energy Market Revenue (Million) Forecast, by Application 2019 & 2032
- Table 32: Global PDM in the Energy Market Revenue Million Forecast, by Country 2019 & 2032
- Table 33: Brazil PDM in the Energy Market Revenue (Million) Forecast, by Application 2019 & 2032
- Table 34: Argentina PDM in the Energy Market Revenue (Million) Forecast, by Application 2019 & 2032
- Table 35: Peru PDM in the Energy Market Revenue (Million) Forecast, by Application 2019 & 2032
- Table 36: Chile PDM in the Energy Market Revenue (Million) Forecast, by Application 2019 & 2032
- Table 37: Colombia PDM in the Energy Market Revenue (Million) Forecast, by Application 2019 & 2032
- Table 38: Ecuador PDM in the Energy Market Revenue (Million) Forecast, by Application 2019 & 2032
- Table 39: Venezuela PDM in the Energy Market Revenue (Million) Forecast, by Application 2019 & 2032
- Table 40: Rest of South America PDM in the Energy Market Revenue (Million) Forecast, by Application 2019 & 2032
- Table 41: Global PDM in the Energy Market Revenue Million Forecast, by Country 2019 & 2032
- Table 42: United States PDM in the Energy Market Revenue (Million) Forecast, by Application 2019 & 2032
- Table 43: Canada PDM in the Energy Market Revenue (Million) Forecast, by Application 2019 & 2032
- Table 44: Mexico PDM in the Energy Market Revenue (Million) Forecast, by Application 2019 & 2032
- Table 45: Global PDM in the Energy Market Revenue Million Forecast, by Country 2019 & 2032
- Table 46: United Arab Emirates PDM in the Energy Market Revenue (Million) Forecast, by Application 2019 & 2032
- Table 47: Saudi Arabia PDM in the Energy Market Revenue (Million) Forecast, by Application 2019 & 2032
- Table 48: South Africa PDM in the Energy Market Revenue (Million) Forecast, by Application 2019 & 2032
- Table 49: Rest of Middle East and Africa PDM in the Energy Market Revenue (Million) Forecast, by Application 2019 & 2032
- Table 50: Global PDM in the Energy Market Revenue Million Forecast, by Offering 2019 & 2032
- Table 51: Global PDM in the Energy Market Revenue Million Forecast, by Deployment Model 2019 & 2032
- Table 52: Global PDM in the Energy Market Revenue Million Forecast, by Country 2019 & 2032
- Table 53: United States PDM in the Energy Market Revenue (Million) Forecast, by Application 2019 & 2032
- Table 54: Canada PDM in the Energy Market Revenue (Million) Forecast, by Application 2019 & 2032
- Table 55: Mexico PDM in the Energy Market Revenue (Million) Forecast, by Application 2019 & 2032
- Table 56: Global PDM in the Energy Market Revenue Million Forecast, by Offering 2019 & 2032
- Table 57: Global PDM in the Energy Market Revenue Million Forecast, by Deployment Model 2019 & 2032
- Table 58: Global PDM in the Energy Market Revenue Million Forecast, by Country 2019 & 2032
- Table 59: Brazil PDM in the Energy Market Revenue (Million) Forecast, by Application 2019 & 2032
- Table 60: Argentina PDM in the Energy Market Revenue (Million) Forecast, by Application 2019 & 2032
- Table 61: Rest of South America PDM in the Energy Market Revenue (Million) Forecast, by Application 2019 & 2032
- Table 62: Global PDM in the Energy Market Revenue Million Forecast, by Offering 2019 & 2032
- Table 63: Global PDM in the Energy Market Revenue Million Forecast, by Deployment Model 2019 & 2032
- Table 64: Global PDM in the Energy Market Revenue Million Forecast, by Country 2019 & 2032
- Table 65: United Kingdom PDM in the Energy Market Revenue (Million) Forecast, by Application 2019 & 2032
- Table 66: Germany PDM in the Energy Market Revenue (Million) Forecast, by Application 2019 & 2032
- Table 67: France PDM in the Energy Market Revenue (Million) Forecast, by Application 2019 & 2032
- Table 68: Italy PDM in the Energy Market Revenue (Million) Forecast, by Application 2019 & 2032
- Table 69: Spain PDM in the Energy Market Revenue (Million) Forecast, by Application 2019 & 2032
- Table 70: Russia PDM in the Energy Market Revenue (Million) Forecast, by Application 2019 & 2032
- Table 71: Benelux PDM in the Energy Market Revenue (Million) Forecast, by Application 2019 & 2032
- Table 72: Nordics PDM in the Energy Market Revenue (Million) Forecast, by Application 2019 & 2032
- Table 73: Rest of Europe PDM in the Energy Market Revenue (Million) Forecast, by Application 2019 & 2032
- Table 74: Global PDM in the Energy Market Revenue Million Forecast, by Offering 2019 & 2032
- Table 75: Global PDM in the Energy Market Revenue Million Forecast, by Deployment Model 2019 & 2032
- Table 76: Global PDM in the Energy Market Revenue Million Forecast, by Country 2019 & 2032
- Table 77: Turkey PDM in the Energy Market Revenue (Million) Forecast, by Application 2019 & 2032
- Table 78: Israel PDM in the Energy Market Revenue (Million) Forecast, by Application 2019 & 2032
- Table 79: GCC PDM in the Energy Market Revenue (Million) Forecast, by Application 2019 & 2032
- Table 80: North Africa PDM in the Energy Market Revenue (Million) Forecast, by Application 2019 & 2032
- Table 81: South Africa PDM in the Energy Market Revenue (Million) Forecast, by Application 2019 & 2032
- Table 82: Rest of Middle East & Africa PDM in the Energy Market Revenue (Million) Forecast, by Application 2019 & 2032
- Table 83: Global PDM in the Energy Market Revenue Million Forecast, by Offering 2019 & 2032
- Table 84: Global PDM in the Energy Market Revenue Million Forecast, by Deployment Model 2019 & 2032
- Table 85: Global PDM in the Energy Market Revenue Million Forecast, by Country 2019 & 2032
- Table 86: China PDM in the Energy Market Revenue (Million) Forecast, by Application 2019 & 2032
- Table 87: India PDM in the Energy Market Revenue (Million) Forecast, by Application 2019 & 2032
- Table 88: Japan PDM in the Energy Market Revenue (Million) Forecast, by Application 2019 & 2032
- Table 89: South Korea PDM in the Energy Market Revenue (Million) Forecast, by Application 2019 & 2032
- Table 90: ASEAN PDM in the Energy Market Revenue (Million) Forecast, by Application 2019 & 2032
- Table 91: Oceania PDM in the Energy Market Revenue (Million) Forecast, by Application 2019 & 2032
- Table 92: Rest of Asia Pacific PDM in the Energy Market Revenue (Million) Forecast, by Application 2019 & 2032
Frequently Asked Questions
1. What is the projected Compound Annual Growth Rate (CAGR) of the PDM in the Energy Market?
The projected CAGR is approximately 25.77%.
2. Which companies are prominent players in the PDM in the Energy Market?
Key companies in the market include ABB Ltd, Accenture PLC, IBM Corporation, GE Automation & Control*List Not Exhaustive, Siemens AG, Banner Engineering Corp, Schneider Electric, Robert Bosch GmbH, Intel Corporation, SAP SE.
3. What are the main segments of the PDM in the Energy Market?
The market segments include Offering, Deployment Model.
4. Can you provide details about the market size?
The market size is estimated to be USD 1.79 Million as of 2022.
5. What are some drivers contributing to market growth?
Increasing Investments in the Energy Sector; Increasing Adoption of Automation.
6. What are the notable trends driving market growth?
Solutions Segment is Anticipated to Witness Significant Growth.
7. Are there any restraints impacting market growth?
Lack of Awareness About the Benefits of Sports Analytics Solutions.
8. Can you provide examples of recent developments in the market?
September 2022: Electricity Growth and Use in Developing Economies Atlas AI, a predictive analytics platform, partnered with the Rockefeller Foundation, a US-based energy research organization, to assist Sub-Saharan African countries such as Kenya, Rwanda, Uganda, and Nigeria in addressing the impending green infrastructure investment gap and accelerating climate action initiatives through the use of satellite data and machine learning (ML) technologies.
9. What pricing options are available for accessing the report?
Pricing options include single-user, multi-user, and enterprise licenses priced at USD 4750, USD 5250, and USD 8750 respectively.
10. Is the market size provided in terms of value or volume?
The market size is provided in terms of value, measured in Million.
11. Are there any specific market keywords associated with the report?
Yes, the market keyword associated with the report is "PDM in the Energy Market," which aids in identifying and referencing the specific market segment covered.
12. How do I determine which pricing option suits my needs best?
The pricing options vary based on user requirements and access needs. Individual users may opt for single-user licenses, while businesses requiring broader access may choose multi-user or enterprise licenses for cost-effective access to the report.
13. Are there any additional resources or data provided in the PDM in the Energy Market report?
While the report offers comprehensive insights, it's advisable to review the specific contents or supplementary materials provided to ascertain if additional resources or data are available.
14. How can I stay updated on further developments or reports in the PDM in the Energy Market?
To stay informed about further developments, trends, and reports in the PDM in the Energy Market, consider subscribing to industry newsletters, following relevant companies and organizations, or regularly checking reputable industry news sources and publications.
Methodology
Step 1 - Identification of Relevant Samples Size from Population Database


Step 2 - Approaches for Defining Global Market Size (Value, Volume* & Price*)

Note*: In applicable scenarios
Step 3 - Data Sources
Primary Research
- Web Analytics
- Survey Reports
- Research Institute
- Latest Research Reports
- Opinion Leaders
Secondary Research
- Annual Reports
- White Paper
- Latest Press Release
- Industry Association
- Paid Database
- Investor Presentations

Step 4 - Data Triangulation
Involves using different sources of information in order to increase the validity of a study
These sources are likely to be stakeholders in a program - participants, other researchers, program staff, other community members, and so on.
Then we put all data in single framework & apply various statistical tools to find out the dynamic on the market.
During the analysis stage, feedback from the stakeholder groups would be compared to determine areas of agreement as well as areas of divergence
