

Key Insights
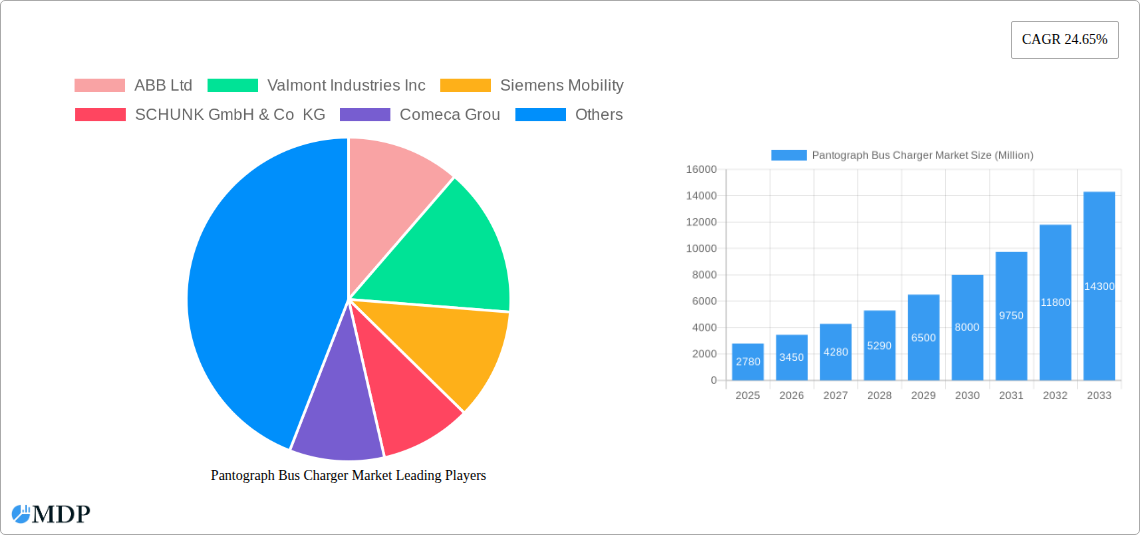
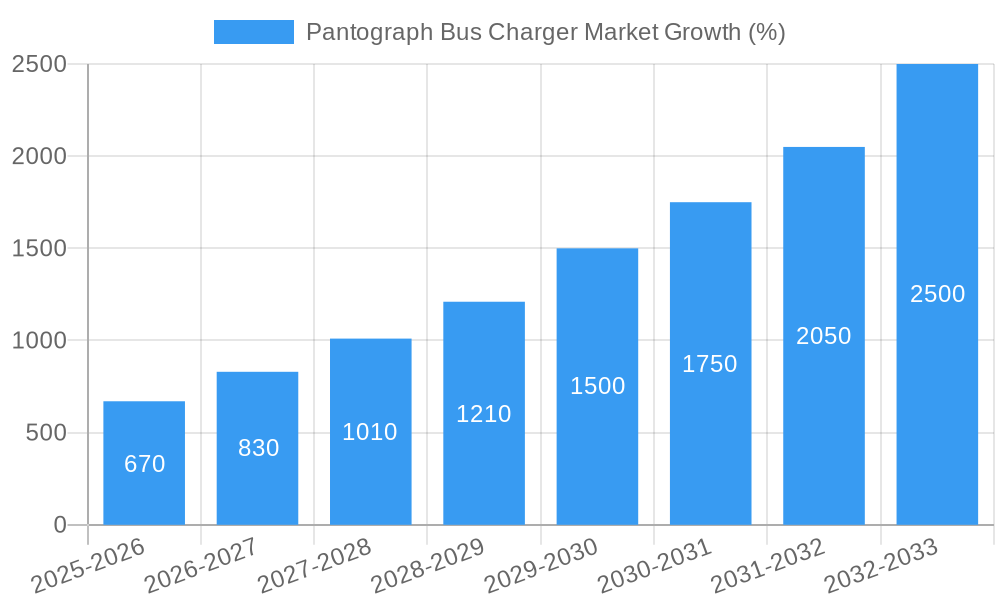
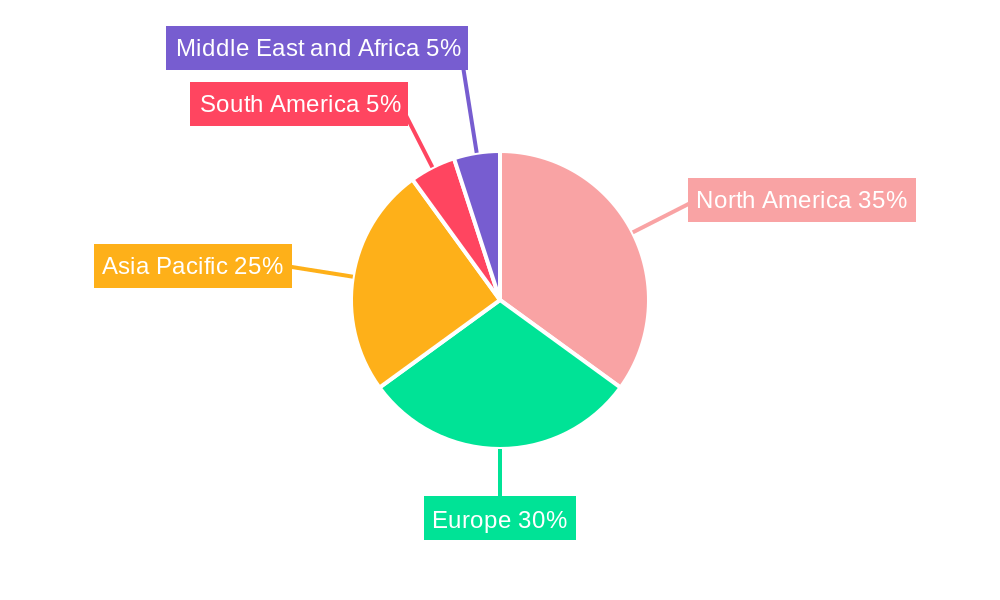
The global Pantograph Bus Charger market is experiencing robust growth, projected to reach \$2.78 billion in 2025 and exhibiting a Compound Annual Growth Rate (CAGR) of 24.65% from 2025 to 2033. This expansion is fueled by several key factors. Increasing urbanization and the consequent rise in public transportation demand are driving the adoption of electric buses, creating a surge in the need for efficient and reliable charging infrastructure. Governments worldwide are actively promoting electric mobility through various incentives and regulations, further accelerating market growth. Technological advancements in pantograph systems, leading to improved charging speeds and power efficiency, are also contributing significantly. The market is segmented by component type (hardware and software), charging infrastructure type (off-board top-down and on-board bottom-up pantographs), and charging type (level 1, level 2, and direct current fast charging). The hardware segment currently dominates due to the significant investments in infrastructure development. However, the software segment is poised for substantial growth driven by the increasing need for smart charging management systems and integration with smart city initiatives. Different regions are showing varied growth trajectories, with North America and Europe leading the market initially, followed by rapid expansion in the Asia-Pacific region due to significant investments in electric bus fleets in countries like China and India.
Competition in the market is intense, with established players like ABB Ltd, Siemens Mobility, and Valmont Industries Inc. alongside specialized companies like Comeca Group and Schunk Transit Systems GmbH competing for market share. The market is witnessing a shift towards innovative solutions like dynamic charging, wireless charging, and advanced power electronics to address challenges related to charging time and infrastructure costs. Despite this positive outlook, challenges such as high initial investment costs for infrastructure deployment and the need for robust grid infrastructure to support the increasing demand for electricity pose potential restraints. Overcoming these hurdles through strategic partnerships, technological innovation, and government support will be crucial for sustained market growth in the coming years. The focus on interoperability and standardization of charging technologies is likely to play a pivotal role in shaping the future of the pantograph bus charger market.
Pantograph Bus Charger Market: A Comprehensive Report (2019-2033)
This comprehensive report provides an in-depth analysis of the Pantograph Bus Charger Market, offering invaluable insights for stakeholders across the industry. With a study period spanning 2019-2033, a base year of 2025, and a forecast period of 2025-2033, this report unveils the market's dynamics, trends, and future potential. The analysis covers key segments including hardware and software components, off-board top-down and on-board bottom-up charging infrastructure types, and Level 2 and direct current fast charging. Leading players like ABB Ltd, Valmont Industries Inc, Siemens Mobility, SCHUNK GmbH & Co KG, Comeca Grou, Schunk Transit Systems GmBH, Wabtech Corporation, Vector Informatik GmbH, and SETEC Power are profiled, highlighting their contributions to market growth and innovation. The report projects a xx Million market value by 2033, with a CAGR of xx% during the forecast period.
Pantograph Bus Charger Market Market Dynamics & Concentration
The Pantograph Bus Charger market is experiencing significant growth driven by the global push towards electric public transportation. Market concentration is currently moderate, with several key players holding substantial market share. However, the market is witnessing increased competition due to new entrants and technological advancements. Innovation is a primary driver, with companies continuously developing faster, more efficient, and reliable charging solutions. Stringent environmental regulations globally are compelling cities to adopt electric bus fleets, boosting demand for pantograph chargers. While there are currently limited direct substitutes for pantograph charging, alternative technologies such as inductive charging are emerging as potential competitors. End-user trends show a preference for faster charging times and reduced downtime, influencing product development and market segmentation. The number of M&A activities in the sector has increased in recent years, reaching approximately xx deals in 2024, indicating consolidation within the industry. The top three players command a combined market share of approximately xx%, reflecting the current competitive landscape.
Pantograph Bus Charger Market Industry Trends & Analysis
The global Pantograph Bus Charger market is experiencing robust growth, driven by several factors. The increasing adoption of electric buses in major cities worldwide is the primary catalyst, reflecting a global shift towards sustainable transportation. Technological advancements, including the development of higher-power charging systems and improved charging infrastructure, are accelerating market expansion. Consumer preferences are leaning towards efficient, reliable, and fast-charging solutions, compelling manufacturers to innovate and enhance their offerings. Intense competition among established players and new entrants fosters innovation and helps drive down costs, making pantograph charging more accessible. The market is projected to exhibit a CAGR of xx% from 2025 to 2033, indicating substantial future growth. Market penetration is expected to increase significantly in developing economies as investment in public transportation infrastructure rises. The shift from diesel to electric buses is creating significant opportunities for market expansion, particularly in urban areas with high public transit ridership.
Leading Markets & Segments in Pantograph Bus Charger Market
The European Union currently dominates the Pantograph Bus Charger market, driven by strong government support for electric mobility and extensive investments in public transportation infrastructure. Within Europe, countries such as Germany, France, and the UK stand out due to large-scale electric bus deployments and favorable policy frameworks. The off-board top-down pantograph segment holds the largest market share by charging infrastructure type, primarily due to its established presence and suitability for depot charging. Hardware constitutes the larger segment by component type, reflecting the significant cost associated with infrastructure deployment. Direct Current Fast Charging, offering faster charging times, is becoming increasingly popular compared to Level 2 charging.
- Key Drivers in Leading Markets:
- EU: Stringent emission regulations, substantial government subsidies for electric vehicles, and robust investments in public transport infrastructure.
- North America: Growing awareness of environmental concerns, government incentives, and increasing focus on reducing carbon emissions.
- Asia Pacific: Rapid urbanization, growing disposable incomes, and supportive government policies aimed at promoting sustainable transport.
Pantograph Bus Charger Market Product Developments
Recent product developments focus on increasing charging power, enhancing efficiency, and improving the overall user experience. Manufacturers are introducing smart charging systems that optimize energy consumption and reduce charging times. There's a growing emphasis on developing robust and weatherproof pantograph designs suitable for various climates and operating conditions. The integration of advanced safety features is also a key trend. This continuous product innovation is crucial for meeting the demands of a rapidly evolving market and expanding the adoption of electric bus systems.
Key Drivers of Pantograph Bus Charger Market Growth
The rapid growth of the Pantograph Bus Charger market is propelled by several key factors. Firstly, government regulations worldwide are pushing for cleaner transportation, resulting in massive investments in electric bus fleets. Secondly, the continuous technological advancements in battery technology and charging infrastructure are increasing the efficiency and practicality of electric buses. Finally, rising environmental awareness and concerns about air pollution are further driving the adoption of electric public transportation, creating significant demand for pantograph chargers.
Challenges in the Pantograph Bus Charger Market Market
The Pantograph Bus Charger market faces certain challenges. High initial investment costs associated with infrastructure development can be a barrier to entry for smaller companies. Supply chain disruptions, particularly regarding crucial components like semiconductors, can impact production and delivery timelines. Competition among established players is intense, leading to price pressures and the need for continuous innovation. Regulatory hurdles and varying standards across different regions can add complexity to market operations.
Emerging Opportunities in Pantograph Bus Charger Market
The Pantograph Bus Charger market presents significant opportunities for long-term growth. Technological advancements, such as wireless charging and advancements in fast-charging technologies, are poised to open new markets and create innovative solutions. Strategic partnerships between charger manufacturers, bus manufacturers, and public transportation operators will facilitate smoother integration and deployment of electric bus systems. The expansion into developing markets with increasing urban populations and rising public transport needs offers significant potential for market growth.
Leading Players in the Pantograph Bus Charger Market Sector
- ABB Ltd
- Valmont Industries Inc
- Siemens Mobility
- SCHUNK GmbH & Co KG
- Comeca Grou
- Schunk Transit Systems GmBH
- Wabtech Corporation
- Vector Informatik GmbH
- SETEC Power
Key Milestones in Pantograph Bus Charger Market Industry
August 2022: First Bus's order of 193 electric buses with 150 kW DC charging and optional 450 kW pantograph charging highlights the increasing demand for high-power charging solutions.
May 2022: San Diego Metropolitan Transit System's USD 8.5 Million investment in a Schunk SLS 301 series pantograph charging system demonstrates the growing adoption of advanced charging technologies.
April 2022: TMB's tender for up to 83 electric buses with pantograph charging options underscores the significant investment in electric public transport within Europe.
April 2022: The contract awarded in Grudziądz, Poland for 17 electric buses with pantograph chargers signifies the expanding market for these systems in Eastern Europe.
November 2021: Moscow's pilot project with a bus-down pantograph showcases the ongoing exploration of innovative charging technologies.
Strategic Outlook for Pantograph Bus Charger Market Market
The Pantograph Bus Charger market is poised for continued expansion, driven by the global transition to sustainable public transportation. Further technological advancements, coupled with supportive government policies and growing environmental awareness, will fuel market growth in the coming years. Strategic partnerships between key players across the value chain will be crucial in optimizing the deployment of electric bus systems and ensuring widespread adoption. Expansion into emerging markets and the development of innovative charging solutions will create new opportunities and drive future market potential.
Pantograph Bus Charger Market Segmentation
-
1. Charging Type
- 1.1. Level 1
- 1.2. Level 2
- 1.3. Direct Current Fast Charging
-
2. Pcomponent Type
- 2.1. Hardware
- 2.2. Software
-
3. Charging Infrastructure Type
- 3.1. Off-board top-down pantograph
- 3.2. On-Board Bottom-Up Pantograph
Pantograph Bus Charger Market Segmentation By Geography
-
1. North America
- 1.1. United States
- 1.2. Canada
- 1.3. Rest of North America
-
2. Europe
- 2.1. Germany
- 2.2. United Kingdom
- 2.3. France
- 2.4. Italy
- 2.5. Spain
- 2.6. Rest of Europe
-
3. Asia Pacific
- 3.1. India
- 3.2. China
- 3.3. South Korea
- 3.4. Japan
- 3.5. Rest of Asia Pacific
-
4. South America
- 4.1. Brazil
- 4.2. Aegentina
- 4.3. Rest of the South America
-
5. Middle East and Africa
- 5.1. Saudi Arabia
- 5.2. South Africa
- 5.3. Rest of the Middle East and Africa
Pantograph Bus Charger Market REPORT HIGHLIGHTS
| Aspects | Details |
|---|---|
| Study Period | 2019-2033 |
| Base Year | 2024 |
| Estimated Year | 2025 |
| Forecast Period | 2025-2033 |
| Historical Period | 2019-2024 |
| Growth Rate | CAGR of 24.65% from 2019-2033 |
| Segmentation |
|
Table of Contents
- 1. Introduction
- 1.1. Research Scope
- 1.2. Market Segmentation
- 1.3. Research Methodology
- 1.4. Definitions and Assumptions
- 2. Executive Summary
- 2.1. Introduction
- 3. Market Dynamics
- 3.1. Introduction
- 3.2. Market Drivers
- 3.2.1. Rise in Vehicle Sale
- 3.3. Market Restrains
- 3.3.1. Increase in demand for Electric Vehicles
- 3.4. Market Trends
- 3.4.1. Rising Emphasis of Government on Eco-Friendly Buses
- 4. Market Factor Analysis
- 4.1. Porters Five Forces
- 4.2. Supply/Value Chain
- 4.3. PESTEL analysis
- 4.4. Market Entropy
- 4.5. Patent/Trademark Analysis
- 5. Global Pantograph Bus Charger Market Analysis, Insights and Forecast, 2019-2031
- 5.1. Market Analysis, Insights and Forecast - by Charging Type
- 5.1.1. Level 1
- 5.1.2. Level 2
- 5.1.3. Direct Current Fast Charging
- 5.2. Market Analysis, Insights and Forecast - by Pcomponent Type
- 5.2.1. Hardware
- 5.2.2. Software
- 5.3. Market Analysis, Insights and Forecast - by Charging Infrastructure Type
- 5.3.1. Off-board top-down pantograph
- 5.3.2. On-Board Bottom-Up Pantograph
- 5.4. Market Analysis, Insights and Forecast - by Region
- 5.4.1. North America
- 5.4.2. Europe
- 5.4.3. Asia Pacific
- 5.4.4. South America
- 5.4.5. Middle East and Africa
- 5.1. Market Analysis, Insights and Forecast - by Charging Type
- 6. North America Pantograph Bus Charger Market Analysis, Insights and Forecast, 2019-2031
- 6.1. Market Analysis, Insights and Forecast - by Charging Type
- 6.1.1. Level 1
- 6.1.2. Level 2
- 6.1.3. Direct Current Fast Charging
- 6.2. Market Analysis, Insights and Forecast - by Pcomponent Type
- 6.2.1. Hardware
- 6.2.2. Software
- 6.3. Market Analysis, Insights and Forecast - by Charging Infrastructure Type
- 6.3.1. Off-board top-down pantograph
- 6.3.2. On-Board Bottom-Up Pantograph
- 6.1. Market Analysis, Insights and Forecast - by Charging Type
- 7. Europe Pantograph Bus Charger Market Analysis, Insights and Forecast, 2019-2031
- 7.1. Market Analysis, Insights and Forecast - by Charging Type
- 7.1.1. Level 1
- 7.1.2. Level 2
- 7.1.3. Direct Current Fast Charging
- 7.2. Market Analysis, Insights and Forecast - by Pcomponent Type
- 7.2.1. Hardware
- 7.2.2. Software
- 7.3. Market Analysis, Insights and Forecast - by Charging Infrastructure Type
- 7.3.1. Off-board top-down pantograph
- 7.3.2. On-Board Bottom-Up Pantograph
- 7.1. Market Analysis, Insights and Forecast - by Charging Type
- 8. Asia Pacific Pantograph Bus Charger Market Analysis, Insights and Forecast, 2019-2031
- 8.1. Market Analysis, Insights and Forecast - by Charging Type
- 8.1.1. Level 1
- 8.1.2. Level 2
- 8.1.3. Direct Current Fast Charging
- 8.2. Market Analysis, Insights and Forecast - by Pcomponent Type
- 8.2.1. Hardware
- 8.2.2. Software
- 8.3. Market Analysis, Insights and Forecast - by Charging Infrastructure Type
- 8.3.1. Off-board top-down pantograph
- 8.3.2. On-Board Bottom-Up Pantograph
- 8.1. Market Analysis, Insights and Forecast - by Charging Type
- 9. South America Pantograph Bus Charger Market Analysis, Insights and Forecast, 2019-2031
- 9.1. Market Analysis, Insights and Forecast - by Charging Type
- 9.1.1. Level 1
- 9.1.2. Level 2
- 9.1.3. Direct Current Fast Charging
- 9.2. Market Analysis, Insights and Forecast - by Pcomponent Type
- 9.2.1. Hardware
- 9.2.2. Software
- 9.3. Market Analysis, Insights and Forecast - by Charging Infrastructure Type
- 9.3.1. Off-board top-down pantograph
- 9.3.2. On-Board Bottom-Up Pantograph
- 9.1. Market Analysis, Insights and Forecast - by Charging Type
- 10. Middle East and Africa Pantograph Bus Charger Market Analysis, Insights and Forecast, 2019-2031
- 10.1. Market Analysis, Insights and Forecast - by Charging Type
- 10.1.1. Level 1
- 10.1.2. Level 2
- 10.1.3. Direct Current Fast Charging
- 10.2. Market Analysis, Insights and Forecast - by Pcomponent Type
- 10.2.1. Hardware
- 10.2.2. Software
- 10.3. Market Analysis, Insights and Forecast - by Charging Infrastructure Type
- 10.3.1. Off-board top-down pantograph
- 10.3.2. On-Board Bottom-Up Pantograph
- 10.1. Market Analysis, Insights and Forecast - by Charging Type
- 11. North America Pantograph Bus Charger Market Analysis, Insights and Forecast, 2019-2031
- 11.1. Market Analysis, Insights and Forecast - By Country/Sub-region
- 11.1.1 United States
- 11.1.2 Canada
- 11.1.3 Rest of North America
- 12. Europe Pantograph Bus Charger Market Analysis, Insights and Forecast, 2019-2031
- 12.1. Market Analysis, Insights and Forecast - By Country/Sub-region
- 12.1.1 Germany
- 12.1.2 United Kingdom
- 12.1.3 France
- 12.1.4 Italy
- 12.1.5 Spain
- 12.1.6 Rest of Europe
- 13. Asia Pacific Pantograph Bus Charger Market Analysis, Insights and Forecast, 2019-2031
- 13.1. Market Analysis, Insights and Forecast - By Country/Sub-region
- 13.1.1 India
- 13.1.2 China
- 13.1.3 South Korea
- 13.1.4 Japan
- 13.1.5 Rest of Asia Pacific
- 14. South America Pantograph Bus Charger Market Analysis, Insights and Forecast, 2019-2031
- 14.1. Market Analysis, Insights and Forecast - By Country/Sub-region
- 14.1.1 Brazil
- 14.1.2 Aegentina
- 14.1.3 Rest of the South America
- 15. Middle East and Africa Pantograph Bus Charger Market Analysis, Insights and Forecast, 2019-2031
- 15.1. Market Analysis, Insights and Forecast - By Country/Sub-region
- 15.1.1 Saudi Arabia
- 15.1.2 South Africa
- 15.1.3 Rest of the Middle East and Africa
- 16. Competitive Analysis
- 16.1. Global Market Share Analysis 2024
- 16.2. Company Profiles
- 16.2.1 ABB Ltd
- 16.2.1.1. Overview
- 16.2.1.2. Products
- 16.2.1.3. SWOT Analysis
- 16.2.1.4. Recent Developments
- 16.2.1.5. Financials (Based on Availability)
- 16.2.2 Valmont Industries Inc
- 16.2.2.1. Overview
- 16.2.2.2. Products
- 16.2.2.3. SWOT Analysis
- 16.2.2.4. Recent Developments
- 16.2.2.5. Financials (Based on Availability)
- 16.2.3 Siemens Mobility
- 16.2.3.1. Overview
- 16.2.3.2. Products
- 16.2.3.3. SWOT Analysis
- 16.2.3.4. Recent Developments
- 16.2.3.5. Financials (Based on Availability)
- 16.2.4 SCHUNK GmbH & Co KG
- 16.2.4.1. Overview
- 16.2.4.2. Products
- 16.2.4.3. SWOT Analysis
- 16.2.4.4. Recent Developments
- 16.2.4.5. Financials (Based on Availability)
- 16.2.5 Comeca Grou
- 16.2.5.1. Overview
- 16.2.5.2. Products
- 16.2.5.3. SWOT Analysis
- 16.2.5.4. Recent Developments
- 16.2.5.5. Financials (Based on Availability)
- 16.2.6 Schunk Transit Systems GmBH
- 16.2.6.1. Overview
- 16.2.6.2. Products
- 16.2.6.3. SWOT Analysis
- 16.2.6.4. Recent Developments
- 16.2.6.5. Financials (Based on Availability)
- 16.2.7 Wabtech Corporation
- 16.2.7.1. Overview
- 16.2.7.2. Products
- 16.2.7.3. SWOT Analysis
- 16.2.7.4. Recent Developments
- 16.2.7.5. Financials (Based on Availability)
- 16.2.8 Vector Informatik GmbH
- 16.2.8.1. Overview
- 16.2.8.2. Products
- 16.2.8.3. SWOT Analysis
- 16.2.8.4. Recent Developments
- 16.2.8.5. Financials (Based on Availability)
- 16.2.9 SETEC Power
- 16.2.9.1. Overview
- 16.2.9.2. Products
- 16.2.9.3. SWOT Analysis
- 16.2.9.4. Recent Developments
- 16.2.9.5. Financials (Based on Availability)
- 16.2.1 ABB Ltd
List of Figures
- Figure 1: Global Pantograph Bus Charger Market Revenue Breakdown (Million, %) by Region 2024 & 2032
- Figure 2: North America Pantograph Bus Charger Market Revenue (Million), by Country 2024 & 2032
- Figure 3: North America Pantograph Bus Charger Market Revenue Share (%), by Country 2024 & 2032
- Figure 4: Europe Pantograph Bus Charger Market Revenue (Million), by Country 2024 & 2032
- Figure 5: Europe Pantograph Bus Charger Market Revenue Share (%), by Country 2024 & 2032
- Figure 6: Asia Pacific Pantograph Bus Charger Market Revenue (Million), by Country 2024 & 2032
- Figure 7: Asia Pacific Pantograph Bus Charger Market Revenue Share (%), by Country 2024 & 2032
- Figure 8: South America Pantograph Bus Charger Market Revenue (Million), by Country 2024 & 2032
- Figure 9: South America Pantograph Bus Charger Market Revenue Share (%), by Country 2024 & 2032
- Figure 10: Middle East and Africa Pantograph Bus Charger Market Revenue (Million), by Country 2024 & 2032
- Figure 11: Middle East and Africa Pantograph Bus Charger Market Revenue Share (%), by Country 2024 & 2032
- Figure 12: North America Pantograph Bus Charger Market Revenue (Million), by Charging Type 2024 & 2032
- Figure 13: North America Pantograph Bus Charger Market Revenue Share (%), by Charging Type 2024 & 2032
- Figure 14: North America Pantograph Bus Charger Market Revenue (Million), by Pcomponent Type 2024 & 2032
- Figure 15: North America Pantograph Bus Charger Market Revenue Share (%), by Pcomponent Type 2024 & 2032
- Figure 16: North America Pantograph Bus Charger Market Revenue (Million), by Charging Infrastructure Type 2024 & 2032
- Figure 17: North America Pantograph Bus Charger Market Revenue Share (%), by Charging Infrastructure Type 2024 & 2032
- Figure 18: North America Pantograph Bus Charger Market Revenue (Million), by Country 2024 & 2032
- Figure 19: North America Pantograph Bus Charger Market Revenue Share (%), by Country 2024 & 2032
- Figure 20: Europe Pantograph Bus Charger Market Revenue (Million), by Charging Type 2024 & 2032
- Figure 21: Europe Pantograph Bus Charger Market Revenue Share (%), by Charging Type 2024 & 2032
- Figure 22: Europe Pantograph Bus Charger Market Revenue (Million), by Pcomponent Type 2024 & 2032
- Figure 23: Europe Pantograph Bus Charger Market Revenue Share (%), by Pcomponent Type 2024 & 2032
- Figure 24: Europe Pantograph Bus Charger Market Revenue (Million), by Charging Infrastructure Type 2024 & 2032
- Figure 25: Europe Pantograph Bus Charger Market Revenue Share (%), by Charging Infrastructure Type 2024 & 2032
- Figure 26: Europe Pantograph Bus Charger Market Revenue (Million), by Country 2024 & 2032
- Figure 27: Europe Pantograph Bus Charger Market Revenue Share (%), by Country 2024 & 2032
- Figure 28: Asia Pacific Pantograph Bus Charger Market Revenue (Million), by Charging Type 2024 & 2032
- Figure 29: Asia Pacific Pantograph Bus Charger Market Revenue Share (%), by Charging Type 2024 & 2032
- Figure 30: Asia Pacific Pantograph Bus Charger Market Revenue (Million), by Pcomponent Type 2024 & 2032
- Figure 31: Asia Pacific Pantograph Bus Charger Market Revenue Share (%), by Pcomponent Type 2024 & 2032
- Figure 32: Asia Pacific Pantograph Bus Charger Market Revenue (Million), by Charging Infrastructure Type 2024 & 2032
- Figure 33: Asia Pacific Pantograph Bus Charger Market Revenue Share (%), by Charging Infrastructure Type 2024 & 2032
- Figure 34: Asia Pacific Pantograph Bus Charger Market Revenue (Million), by Country 2024 & 2032
- Figure 35: Asia Pacific Pantograph Bus Charger Market Revenue Share (%), by Country 2024 & 2032
- Figure 36: South America Pantograph Bus Charger Market Revenue (Million), by Charging Type 2024 & 2032
- Figure 37: South America Pantograph Bus Charger Market Revenue Share (%), by Charging Type 2024 & 2032
- Figure 38: South America Pantograph Bus Charger Market Revenue (Million), by Pcomponent Type 2024 & 2032
- Figure 39: South America Pantograph Bus Charger Market Revenue Share (%), by Pcomponent Type 2024 & 2032
- Figure 40: South America Pantograph Bus Charger Market Revenue (Million), by Charging Infrastructure Type 2024 & 2032
- Figure 41: South America Pantograph Bus Charger Market Revenue Share (%), by Charging Infrastructure Type 2024 & 2032
- Figure 42: South America Pantograph Bus Charger Market Revenue (Million), by Country 2024 & 2032
- Figure 43: South America Pantograph Bus Charger Market Revenue Share (%), by Country 2024 & 2032
- Figure 44: Middle East and Africa Pantograph Bus Charger Market Revenue (Million), by Charging Type 2024 & 2032
- Figure 45: Middle East and Africa Pantograph Bus Charger Market Revenue Share (%), by Charging Type 2024 & 2032
- Figure 46: Middle East and Africa Pantograph Bus Charger Market Revenue (Million), by Pcomponent Type 2024 & 2032
- Figure 47: Middle East and Africa Pantograph Bus Charger Market Revenue Share (%), by Pcomponent Type 2024 & 2032
- Figure 48: Middle East and Africa Pantograph Bus Charger Market Revenue (Million), by Charging Infrastructure Type 2024 & 2032
- Figure 49: Middle East and Africa Pantograph Bus Charger Market Revenue Share (%), by Charging Infrastructure Type 2024 & 2032
- Figure 50: Middle East and Africa Pantograph Bus Charger Market Revenue (Million), by Country 2024 & 2032
- Figure 51: Middle East and Africa Pantograph Bus Charger Market Revenue Share (%), by Country 2024 & 2032
List of Tables
- Table 1: Global Pantograph Bus Charger Market Revenue Million Forecast, by Region 2019 & 2032
- Table 2: Global Pantograph Bus Charger Market Revenue Million Forecast, by Charging Type 2019 & 2032
- Table 3: Global Pantograph Bus Charger Market Revenue Million Forecast, by Pcomponent Type 2019 & 2032
- Table 4: Global Pantograph Bus Charger Market Revenue Million Forecast, by Charging Infrastructure Type 2019 & 2032
- Table 5: Global Pantograph Bus Charger Market Revenue Million Forecast, by Region 2019 & 2032
- Table 6: Global Pantograph Bus Charger Market Revenue Million Forecast, by Country 2019 & 2032
- Table 7: United States Pantograph Bus Charger Market Revenue (Million) Forecast, by Application 2019 & 2032
- Table 8: Canada Pantograph Bus Charger Market Revenue (Million) Forecast, by Application 2019 & 2032
- Table 9: Rest of North America Pantograph Bus Charger Market Revenue (Million) Forecast, by Application 2019 & 2032
- Table 10: Global Pantograph Bus Charger Market Revenue Million Forecast, by Country 2019 & 2032
- Table 11: Germany Pantograph Bus Charger Market Revenue (Million) Forecast, by Application 2019 & 2032
- Table 12: United Kingdom Pantograph Bus Charger Market Revenue (Million) Forecast, by Application 2019 & 2032
- Table 13: France Pantograph Bus Charger Market Revenue (Million) Forecast, by Application 2019 & 2032
- Table 14: Italy Pantograph Bus Charger Market Revenue (Million) Forecast, by Application 2019 & 2032
- Table 15: Spain Pantograph Bus Charger Market Revenue (Million) Forecast, by Application 2019 & 2032
- Table 16: Rest of Europe Pantograph Bus Charger Market Revenue (Million) Forecast, by Application 2019 & 2032
- Table 17: Global Pantograph Bus Charger Market Revenue Million Forecast, by Country 2019 & 2032
- Table 18: India Pantograph Bus Charger Market Revenue (Million) Forecast, by Application 2019 & 2032
- Table 19: China Pantograph Bus Charger Market Revenue (Million) Forecast, by Application 2019 & 2032
- Table 20: South Korea Pantograph Bus Charger Market Revenue (Million) Forecast, by Application 2019 & 2032
- Table 21: Japan Pantograph Bus Charger Market Revenue (Million) Forecast, by Application 2019 & 2032
- Table 22: Rest of Asia Pacific Pantograph Bus Charger Market Revenue (Million) Forecast, by Application 2019 & 2032
- Table 23: Global Pantograph Bus Charger Market Revenue Million Forecast, by Country 2019 & 2032
- Table 24: Brazil Pantograph Bus Charger Market Revenue (Million) Forecast, by Application 2019 & 2032
- Table 25: Aegentina Pantograph Bus Charger Market Revenue (Million) Forecast, by Application 2019 & 2032
- Table 26: Rest of the South America Pantograph Bus Charger Market Revenue (Million) Forecast, by Application 2019 & 2032
- Table 27: Global Pantograph Bus Charger Market Revenue Million Forecast, by Country 2019 & 2032
- Table 28: Saudi Arabia Pantograph Bus Charger Market Revenue (Million) Forecast, by Application 2019 & 2032
- Table 29: South Africa Pantograph Bus Charger Market Revenue (Million) Forecast, by Application 2019 & 2032
- Table 30: Rest of the Middle East and Africa Pantograph Bus Charger Market Revenue (Million) Forecast, by Application 2019 & 2032
- Table 31: Global Pantograph Bus Charger Market Revenue Million Forecast, by Charging Type 2019 & 2032
- Table 32: Global Pantograph Bus Charger Market Revenue Million Forecast, by Pcomponent Type 2019 & 2032
- Table 33: Global Pantograph Bus Charger Market Revenue Million Forecast, by Charging Infrastructure Type 2019 & 2032
- Table 34: Global Pantograph Bus Charger Market Revenue Million Forecast, by Country 2019 & 2032
- Table 35: United States Pantograph Bus Charger Market Revenue (Million) Forecast, by Application 2019 & 2032
- Table 36: Canada Pantograph Bus Charger Market Revenue (Million) Forecast, by Application 2019 & 2032
- Table 37: Rest of North America Pantograph Bus Charger Market Revenue (Million) Forecast, by Application 2019 & 2032
- Table 38: Global Pantograph Bus Charger Market Revenue Million Forecast, by Charging Type 2019 & 2032
- Table 39: Global Pantograph Bus Charger Market Revenue Million Forecast, by Pcomponent Type 2019 & 2032
- Table 40: Global Pantograph Bus Charger Market Revenue Million Forecast, by Charging Infrastructure Type 2019 & 2032
- Table 41: Global Pantograph Bus Charger Market Revenue Million Forecast, by Country 2019 & 2032
- Table 42: Germany Pantograph Bus Charger Market Revenue (Million) Forecast, by Application 2019 & 2032
- Table 43: United Kingdom Pantograph Bus Charger Market Revenue (Million) Forecast, by Application 2019 & 2032
- Table 44: France Pantograph Bus Charger Market Revenue (Million) Forecast, by Application 2019 & 2032
- Table 45: Italy Pantograph Bus Charger Market Revenue (Million) Forecast, by Application 2019 & 2032
- Table 46: Spain Pantograph Bus Charger Market Revenue (Million) Forecast, by Application 2019 & 2032
- Table 47: Rest of Europe Pantograph Bus Charger Market Revenue (Million) Forecast, by Application 2019 & 2032
- Table 48: Global Pantograph Bus Charger Market Revenue Million Forecast, by Charging Type 2019 & 2032
- Table 49: Global Pantograph Bus Charger Market Revenue Million Forecast, by Pcomponent Type 2019 & 2032
- Table 50: Global Pantograph Bus Charger Market Revenue Million Forecast, by Charging Infrastructure Type 2019 & 2032
- Table 51: Global Pantograph Bus Charger Market Revenue Million Forecast, by Country 2019 & 2032
- Table 52: India Pantograph Bus Charger Market Revenue (Million) Forecast, by Application 2019 & 2032
- Table 53: China Pantograph Bus Charger Market Revenue (Million) Forecast, by Application 2019 & 2032
- Table 54: South Korea Pantograph Bus Charger Market Revenue (Million) Forecast, by Application 2019 & 2032
- Table 55: Japan Pantograph Bus Charger Market Revenue (Million) Forecast, by Application 2019 & 2032
- Table 56: Rest of Asia Pacific Pantograph Bus Charger Market Revenue (Million) Forecast, by Application 2019 & 2032
- Table 57: Global Pantograph Bus Charger Market Revenue Million Forecast, by Charging Type 2019 & 2032
- Table 58: Global Pantograph Bus Charger Market Revenue Million Forecast, by Pcomponent Type 2019 & 2032
- Table 59: Global Pantograph Bus Charger Market Revenue Million Forecast, by Charging Infrastructure Type 2019 & 2032
- Table 60: Global Pantograph Bus Charger Market Revenue Million Forecast, by Country 2019 & 2032
- Table 61: Brazil Pantograph Bus Charger Market Revenue (Million) Forecast, by Application 2019 & 2032
- Table 62: Aegentina Pantograph Bus Charger Market Revenue (Million) Forecast, by Application 2019 & 2032
- Table 63: Rest of the South America Pantograph Bus Charger Market Revenue (Million) Forecast, by Application 2019 & 2032
- Table 64: Global Pantograph Bus Charger Market Revenue Million Forecast, by Charging Type 2019 & 2032
- Table 65: Global Pantograph Bus Charger Market Revenue Million Forecast, by Pcomponent Type 2019 & 2032
- Table 66: Global Pantograph Bus Charger Market Revenue Million Forecast, by Charging Infrastructure Type 2019 & 2032
- Table 67: Global Pantograph Bus Charger Market Revenue Million Forecast, by Country 2019 & 2032
- Table 68: Saudi Arabia Pantograph Bus Charger Market Revenue (Million) Forecast, by Application 2019 & 2032
- Table 69: South Africa Pantograph Bus Charger Market Revenue (Million) Forecast, by Application 2019 & 2032
- Table 70: Rest of the Middle East and Africa Pantograph Bus Charger Market Revenue (Million) Forecast, by Application 2019 & 2032
Frequently Asked Questions
1. What is the projected Compound Annual Growth Rate (CAGR) of the Pantograph Bus Charger Market?
The projected CAGR is approximately 24.65%.
2. Which companies are prominent players in the Pantograph Bus Charger Market?
Key companies in the market include ABB Ltd, Valmont Industries Inc, Siemens Mobility, SCHUNK GmbH & Co KG, Comeca Grou, Schunk Transit Systems GmBH, Wabtech Corporation, Vector Informatik GmbH, SETEC Power.
3. What are the main segments of the Pantograph Bus Charger Market?
The market segments include Charging Type, Pcomponent Type, Charging Infrastructure Type.
4. Can you provide details about the market size?
The market size is estimated to be USD 2.78 Million as of 2022.
5. What are some drivers contributing to market growth?
Rise in Vehicle Sale.
6. What are the notable trends driving market growth?
Rising Emphasis of Government on Eco-Friendly Buses.
7. Are there any restraints impacting market growth?
Increase in demand for Electric Vehicles.
8. Can you provide examples of recent developments in the market?
August 2022: British bus company First Bus ordered 193 electric buses worth GBP 81 million (~USD 96.4 million) from Northern Irish bus manufacturer Wrightbus. Furthermore, the company initially specifies the DC charging power at 150 kW and optional opportunity charging at 450 kW through pantograph options.
9. What pricing options are available for accessing the report?
Pricing options include single-user, multi-user, and enterprise licenses priced at USD 4750, USD 5250, and USD 8750 respectively.
10. Is the market size provided in terms of value or volume?
The market size is provided in terms of value, measured in Million.
11. Are there any specific market keywords associated with the report?
Yes, the market keyword associated with the report is "Pantograph Bus Charger Market," which aids in identifying and referencing the specific market segment covered.
12. How do I determine which pricing option suits my needs best?
The pricing options vary based on user requirements and access needs. Individual users may opt for single-user licenses, while businesses requiring broader access may choose multi-user or enterprise licenses for cost-effective access to the report.
13. Are there any additional resources or data provided in the Pantograph Bus Charger Market report?
While the report offers comprehensive insights, it's advisable to review the specific contents or supplementary materials provided to ascertain if additional resources or data are available.
14. How can I stay updated on further developments or reports in the Pantograph Bus Charger Market?
To stay informed about further developments, trends, and reports in the Pantograph Bus Charger Market, consider subscribing to industry newsletters, following relevant companies and organizations, or regularly checking reputable industry news sources and publications.
Methodology
Step 1 - Identification of Relevant Samples Size from Population Database


Step 2 - Approaches for Defining Global Market Size (Value, Volume* & Price*)

Note*: In applicable scenarios
Step 3 - Data Sources
Primary Research
- Web Analytics
- Survey Reports
- Research Institute
- Latest Research Reports
- Opinion Leaders
Secondary Research
- Annual Reports
- White Paper
- Latest Press Release
- Industry Association
- Paid Database
- Investor Presentations

Step 4 - Data Triangulation
Involves using different sources of information in order to increase the validity of a study
These sources are likely to be stakeholders in a program - participants, other researchers, program staff, other community members, and so on.
Then we put all data in single framework & apply various statistical tools to find out the dynamic on the market.
During the analysis stage, feedback from the stakeholder groups would be compared to determine areas of agreement as well as areas of divergence
